Microsoft Excel in ENGR 13300
1/26
Earn XP
Description and Tags
Flashcards to go over concepts covered in Excel 3. Excel 1 & 2 not included.
Name | Mastery | Learn | Test | Matching | Spaced | Call with Kai |
|---|
No analytics yet
Send a link to your students to track their progress
27 Terms
Count
=COUNT() - Total # of data points in set
Minimum
=MIN() - Smallest value in data set
Maximum
=MAX() - Latest value in data set
Range
=MAX() - MIN() - Difference between min and max values (Helpful to identify outliers)
Mean
=AVERAGE() - Sum of all data points / count of data points (Sensitive to Outliers)
Median
=MEDIAN() - Middle number of data set (Sort data smallest to largest)
Mode
=MODE() - Most frequently occurring numbe
One Mode
=MODE.SNGL() - One commonly occurring number
Multi Mode
=MODE.MULT() - Multiple commonly occurring numbers
Standard Deviation
=STDEV.S() - Measure of variation in data set (Also = variance1/2)
Variance
=VAR.S() - Average of squared difference of each data point from the mean (Also = SD²)
Low Standard Deviation
data points are closer to the mean
Plugin for Histograms
Data Analysis ToolPak (File ⇒ Options ⇒ Add-ins ⇒ press “Go” ⇒ Analysis ToolPak ⇒ Ok)
Where to access Data Analysis ToolPak (To Make Histograms)
Data tab in Alalysis
Bin
A range of values that group a histogram bar
Number of Bins
=ROUND( sqrt(COUNT()), 0 )
Bin Width
=ROUND( RANGE / NUM_BINS)
Bin Upper Limits (Bin Table)
Sets the maximum value (upper limit) for each bin
1st Bin Upper Limit (Bin Table)
=MIN() + BIN_WIDTH - 1
Other Bin Upper Limits (Bin Table)
=1st Bin Upper Limit + BIN_WIDTH
After the Histogram is created you should …
Correctly label the histogram axis and hide the legend
Skew
=SKEW() - Determines distribution symmetry
Normal / Symmetrical Skew
=SKEW() IS 0
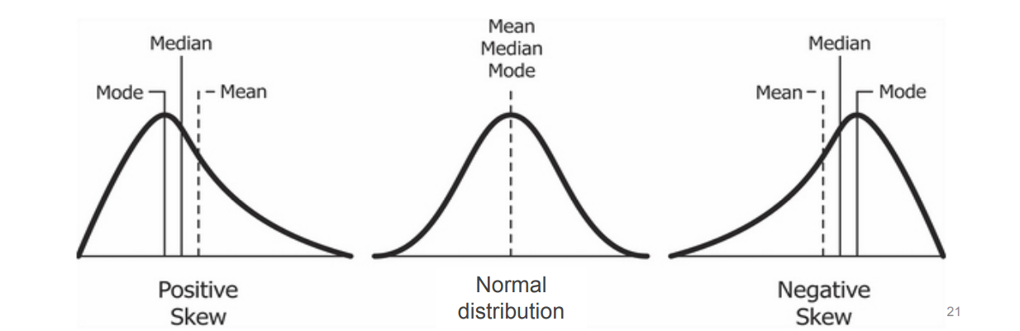
Skewed Left
=SKEW() IS Negative
Skewed Right
=SKEW() IS Positive
Kurtosis
=KURT() - Measures peakness / flatness of a distribution
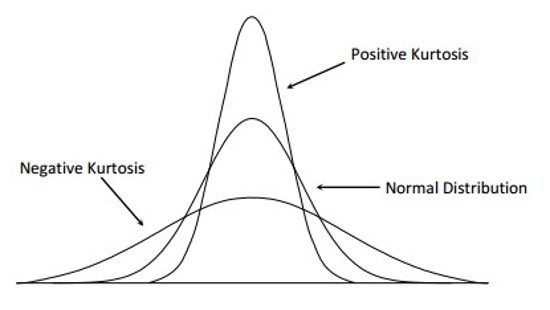
What does Kurtosis compare itself to?
A normal distribution