3.3.1 Revenue
1/4
There's no tags or description
Looks like no tags are added yet.
Name | Mastery | Learn | Test | Matching | Spaced | Call with Kai |
|---|
No analytics yet
Send a link to your students to track their progress
5 Terms
Formulae to calculate total revenue
price x quantity sold
Formulae to calculate average revenue
AR = Total revenue / quantity sold = PQ/Q = P
the revenue made per unit sold
Demand is also known as average revenue (AR)
This is because AR (& also MR) tend to be downward sloping like the demand curve due to the need for firms to lower prices to increase sales
Formulae to calculate marginal revenue
MR = change in TR / change in Q = change in PQ/change in Q = P = AR
Therefore, AR = MR = P
It’s the change in total revenue from selling one more unit of output
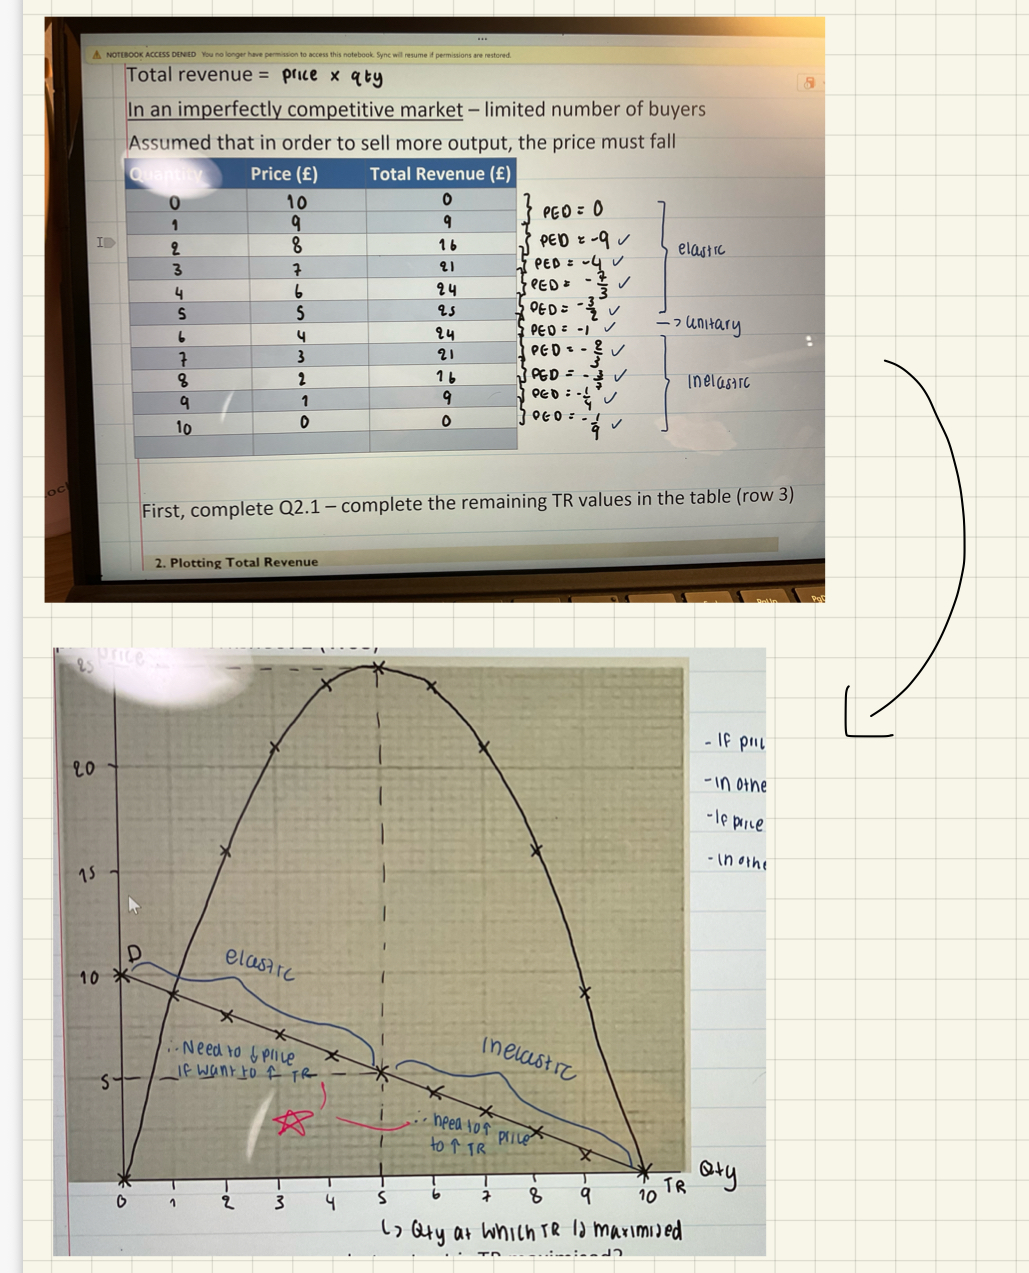
Price elasticity of demand & its relationship to revenue concepts (calculation required)
Calculation: PED=change in percentage of QD / change in percentage in price (ignore signs)
When plot the TR curve against the PED curve it will be like in the image:
According to the graph in the image:
If PED is elastic, reduce price to increase revenue
If PED in inelastic, increase price to increase revenue
When answering a question on this (3 marker + mcq): Draw the graph & label range of operation tailored to the answer
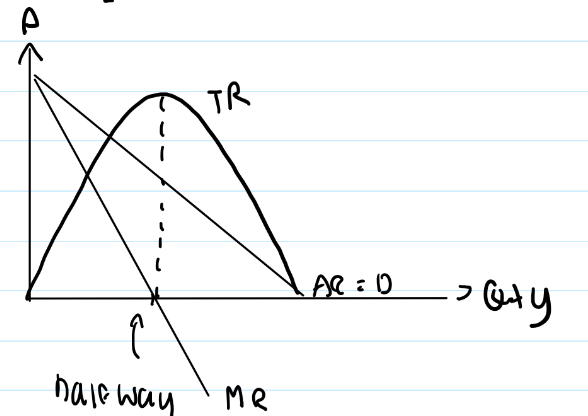
Points to remember when drawing revenue curve (MR, TR & AR)
Label AR = D
When MR more than 0, TR increases
When MR = 0, TR maximized
When MR less than 0, TR decreases
MR has twice the gradient of AR
1) Draw AR 45 degrees
2) Find half of that distance - intersection of MR with x-axis