Week 8 Data Analysis: Confidence Interval Estimation Techniques
1/64
There's no tags or description
Looks like no tags are added yet.
Name | Mastery | Learn | Test | Matching | Spaced |
|---|
No study sessions yet.
65 Terms
Confidence Interval
Range estimating population parameter's value. Range estimating true population parameter. Range estimating population parameters value with known sample. Range estimating a population parameter with certainty.
Population Mean (μ)
Average of all values in a population. Average value of a population's data points.
Population Proportion (π)
Ratio of a specific characteristic in a population.
Sample Statistic
Value calculated from sample data.
Upper Confidence Limit
Highest value in a confidence interval. Maximum value of the confidence interval.
Lower Confidence Limit
Lowest value in a confidence interval. Minimum value of the confidence interval.
Width of Confidence Interval
Difference between upper and lower limits.
Sample Size (n)
Number of observations in a sample.
Standard Deviation (σ)
Measure of data variability in a population.
95% Confidence Interval
Interval where 95% of estimates fall and 95% of samples contain true parameter.
Interval Estimate
Range providing more information than point estimate. Range of values for estimating a population parameter.
Variability
Extent to which data points differ.
Extrapolation
Inferring population characteristics from sample data.
Statistical Confidence
Degree of certainty in statistical estimates.
Sample Mean (X)
Average value calculated from sample data.
Interval Estimate Example
Illustrates confidence interval based on sample data.
Cereal Box Example
Application of confidence interval in real-world scenario.
Confidence Interval Calculation
Formula: X ± Z * (σ/√n).
Correct Statement about μ
Interval accurately reflects population mean based on sample.
Point Estimate
Sample statistic estimating population parameter. Single value estimate of a population parameter.
Standard Error
Standard deviation of the point estimate.
Zα/2
Critical value for normal distribution at α/2.
Level of Significance (α)
Probability of rejecting true null hypothesis.
Common Confidence Levels
Typical levels include 90%, 95%, and 99%.
Z-value for 95%
Zα/2 equals 1.96 for 95% confidence.
Population Standard Deviation (σ)
Measure of population data spread, can be known.
Confidence Coefficient
Probability that the confidence interval contains μ.
Sampling Distribution of the Mean
Distribution of sample means from repeated samples.
Confidence Interval Formula
Point Estimate ± (Critical Value)(Standard Error).
Example Calculation
Determine interval using sample mean and standard deviation.
Population Standard Deviation
Measure of variability in a population, σ.
95% Confidence Level
Probability that interval contains true mean.
Degrees of Freedom (df)
n - 1; number of free observations.
Sample Standard Deviation (S)
Estimate of population standard deviation from sample.
Normal Distribution
Symmetrical distribution where mean equals median. Probability distribution symmetric about the mean.
Critical Value (tα/2)
t value for specified confidence level and df.
Large Sample Size
n > 30; allows normal approximation.
William Gosset
Developed t distribution under pen name 'Student'.
Fat Tails
t distributions have heavier tails than normal.
Confidence Interval for μ (σ Unknown)
Uses t distribution when σ is not known.
t Table
Reference for critical t values based on df.
Standard Normal Distribution
Normal distribution with mean 0 and sd 1.
Random Sample
Subset of population selected without bias.
α Level
Significance level; probability of error.
t (df = ∞)
Standard normal distribution as sample size increases.
Sample Mean (X̄)
Average of values in a sample. Average value from a sample.
Confidence Interval Estimate Formula
X̄ ± tα/2 * (S/√n).
Degrees of Freedom (d.f.)
Calculated as sample size minus one (n - 1).
t Distribution
Used for estimating population parameters with small samples. Used when population standard deviation is unknown.
Normal Distribution Assumption
Population must be approximately normal for valid intervals.
Normal Probability Plot
Graphical tool to assess normality of data distribution.
Boxplot
Visual representation of data distribution and outliers.
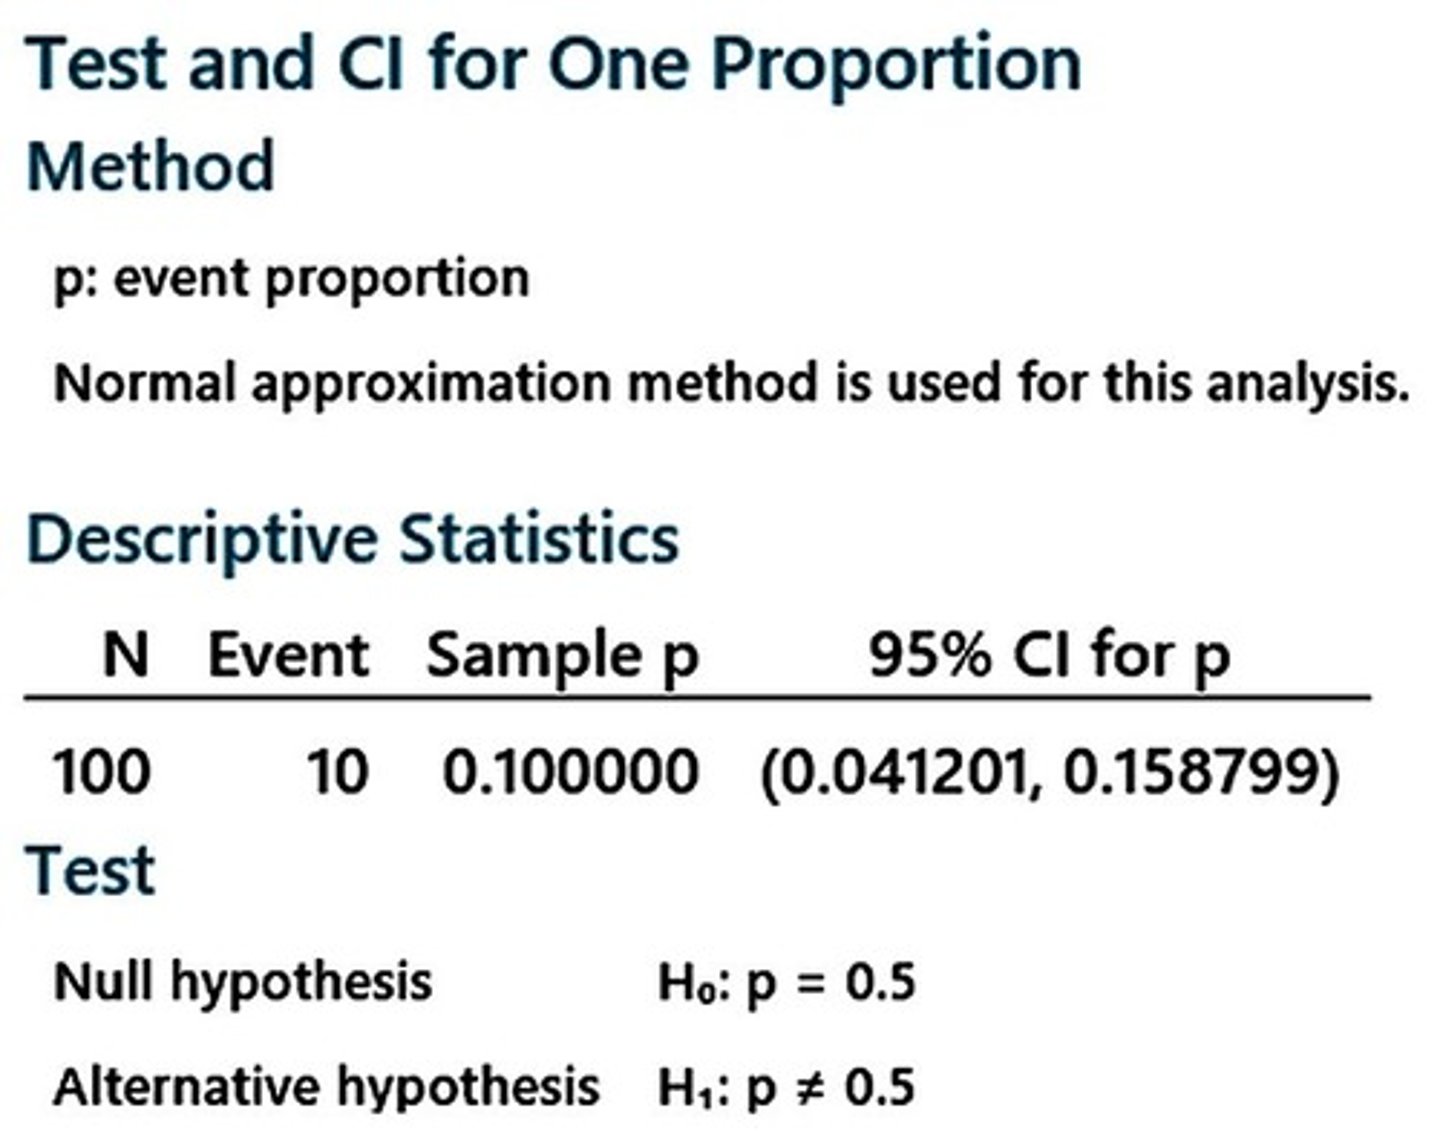
Sample Proportion (p)
Proportion calculated from sample data.
Standard Normal Value (Zα/2)
Critical value for desired confidence level.
Confidence Interval Endpoints
Upper and lower limits of the confidence interval.
Sampling Error
Imprecision in estimating population parameters.
Margin of Error (e)
Amount added/subtracted to point estimate for interval.
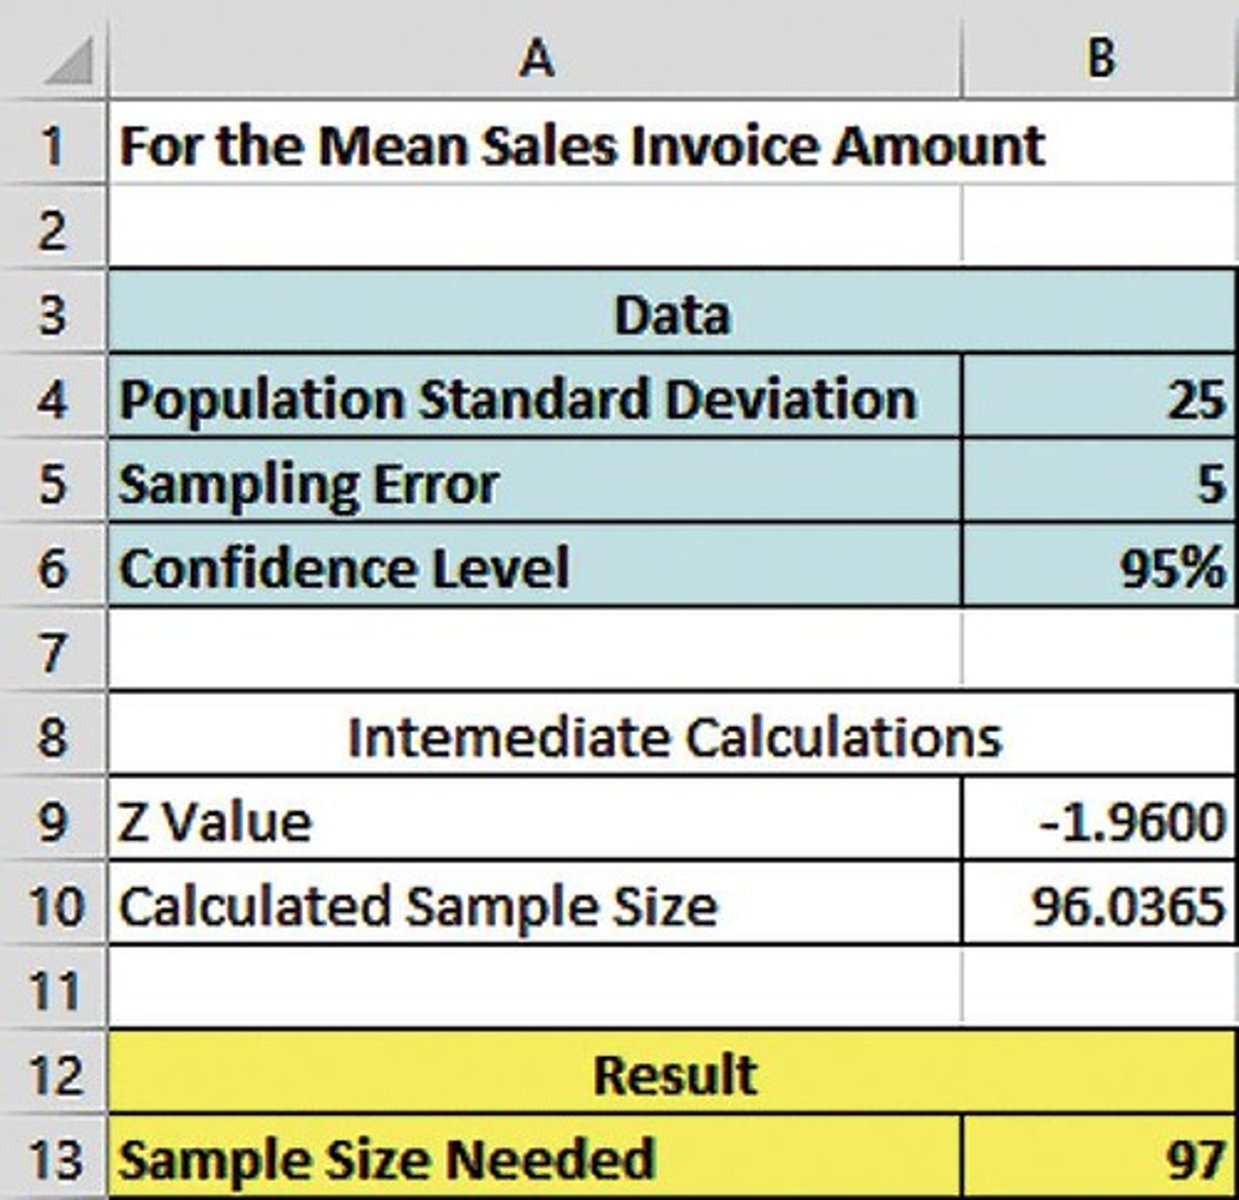
Required Sample Size (n)
Number of observations needed for desired accuracy.
Critical Value
Value used to determine confidence interval width. Table value based on desired confidence level.
Sample Size Formula for Mean
n = (Zα/2 * σ / e)².
Sample Size Formula for Proportion
n = (Zα/2² * p(1-p) / e²).
Pilot Sample
Initial sample used to estimate population parameters.
Confidence Level
Probability that the interval contains the true parameter. Percentage indicating interval reliability for parameter.
Left-Handed Proportion Example
Interval for left-handed individuals based on sample data.
Ethical Reporting
Include confidence intervals and sample sizes in reports.