research analysis quiz 4
1/27
There's no tags or description
Looks like no tags are added yet.
Name | Mastery | Learn | Test | Matching | Spaced |
|---|
No study sessions yet.
28 Terms
frequency expected vs observed expected
Observed frequency is the number of times a particular event is occurring actually when an experiment is conducted in the real world. While the expected frequency is the number of times a particular event is expected to occur or claimed to occur.
test linear relationships between two continuous variables
test correlations - Pearson’s r
what will provide equation for line that best fits data
regression analysis
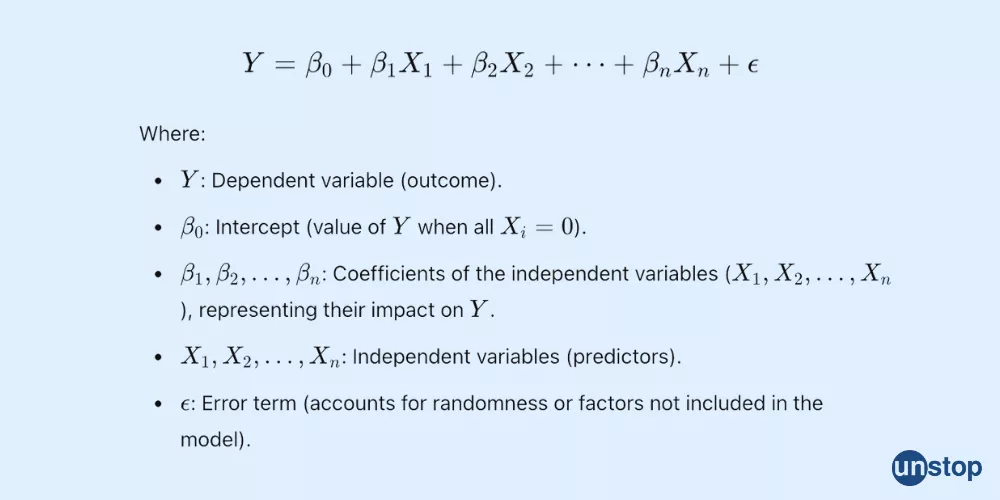
regression line equation for multiple linear regression
sum of squares
between the predicted value and the mean of the dependent variable
measures the deviation of data points away from the mean value
model sum of squares (SSR or explained sum of squares)
variation in the dependent variable explained by model
residual sum of squares (SSE or sum of squared errors)
variation not explained by model
model much bigger than residual
model effectively captures the variation in the data and errors (residual) relatively small
Covariance
joint variability, how much scores vary
partial correlation
a measure of the strength and direction of a linear relationship between two continuous variables whilst controlling for the effect of one or more other continuous variables
missing data what to do
easy list wise deletion or pair wise deletion
list wise deletion
delete all data in a row a whole observation
why do we standardize things?
can’t just use covariance because it is dependent on units of measurement which is difficult to interpret
test hypothesis between categorical variables
non parametric test
how to calculate power?
the probability of observing a statistically significant result at level alpha (α) if a true effect of a certain magnitude is present.
increased effect size and larger sample sizes lead to higher ____
How does power relate to type 1 & type 2 errors
setting a lower significance level decreases a type 1 error risk, but increases a type II errors risk
increasing ___ decreases a type II error risk, but increases a type 1 error risk
Binary outcome
Logistic regression
Interpret standardized beta coefficient from multiple linear regression model
if beta coefficient for predictor variable is .58, how to interpret - for every one unit change in x there is a .58 standard deviation increase in outcome
indicates the effect of a predictor variable on the dependent variable when both variables are measured in standard deviation units
testing data vs training data
see how well it predicts outcome in next group
logistic regression - see low base rate so model predicts no, model is bias just 1 or 0, bias is overfitted
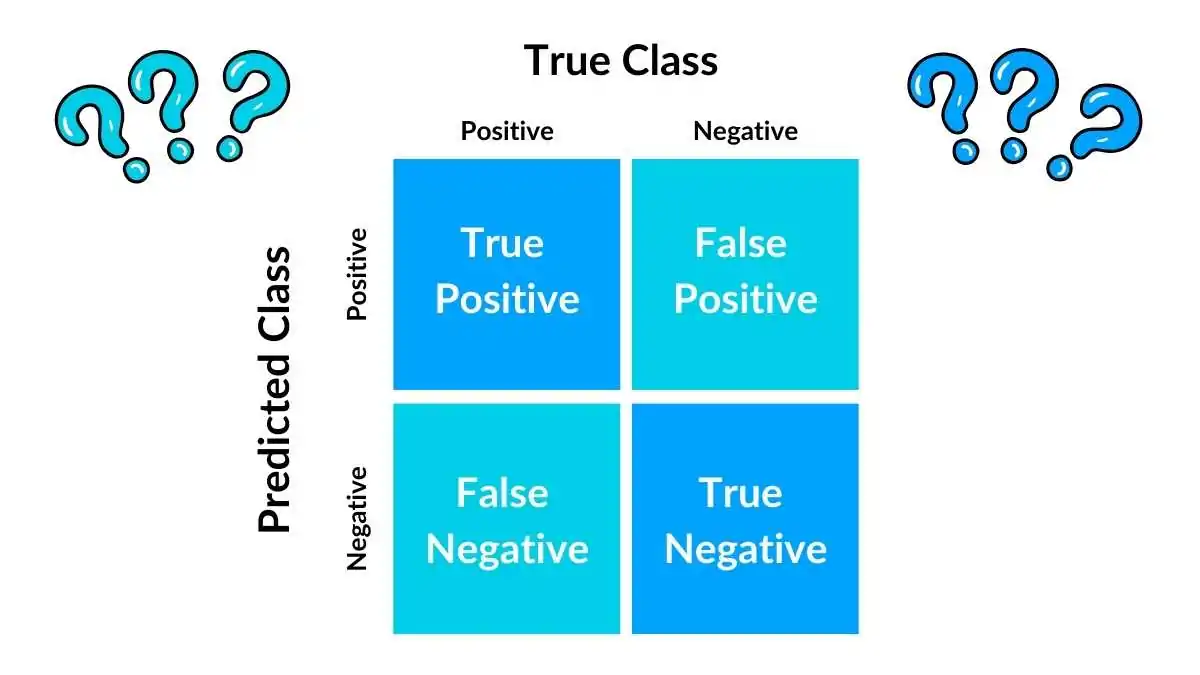
confusion matrix
ODDS ratio interpret
standardized to 1 - .45 oz ration - 55% decrease odds. 1.55 - 55% greater odds - percentage or times more likely - 3.1 3x more likely
multiple linear regression
continuous outcome(height age salary) with two or more variables
multiple independent variables determine the outcome of a single dependent variable
why would we use logistic regression and when?
trying to predict binary outcome (yes or no) with two or more predictors
when you want to predict a categorical outcome, specifically a binary (yes/no, success/failure) or multinomial (multiple categories) outcome, and you have one or more independent variables that you believe might influence the outcome
b knot
dummy coding (categorical variable into predictor model) how many groups you need to create
k-1
r square means what for multiple regression?
a statistical measure in a regression model that determines the proportion of variance in the dependent variable that can be explained by the independent variable
how does r square relate to Pearson’s r correlation ?
coefficient of determination r2 is the square of the Pearson correlation coefficient
correlation
pearsons r
when the relationship is linear and both variables are quantitative and normally distributed and have no outliers
chi square
to analyze categorical data and determine if there’s a statistically significant relationship between two or more variables
to compare observed results with expected results
x²
to analyze categorical variables, particularly when examining relationships between nominal variables (where order doesn't matter)
can binary outcome but one predictor is categorical
2 categorical variable