Unit 7.2 - Financial ratio analysis
1/49
There's no tags or description
Looks like no tags are added yet.
Name | Mastery | Learn | Test | Matching | Spaced | Call with Kai |
|---|
No study sessions yet.
50 Terms
Balance sheet
Financial statement recording the assets and liabilities of a business on a particular day at the end of an accounting period (a snapshot). May also be called a statement of financial position
Main features on a balance sheet
Non-current assets
Current assets
Current liabilities
working capital
non-current liabilities
net assets
total equity
can also calculate capital employed by adding total equity and non-current liabilities
Current assets
Assets that companies expect to convert to cash or use within one year.
Non-current assets
Items owned by the business for more than one year
Current liabilities
Debts that a business will have to pay back within a year
Non-current liabilities
Debts a business pay back for more than a year
Working capital
current assets - current liabilities (sometimes called net current assets)
Net assets
total assets - total liabilities
Shows the overall worth of a business
Capital employed
Total equity + non current liabilities
Total equity
The funds put into the business by shareholders and owners
Share capital + retained profit + reserves
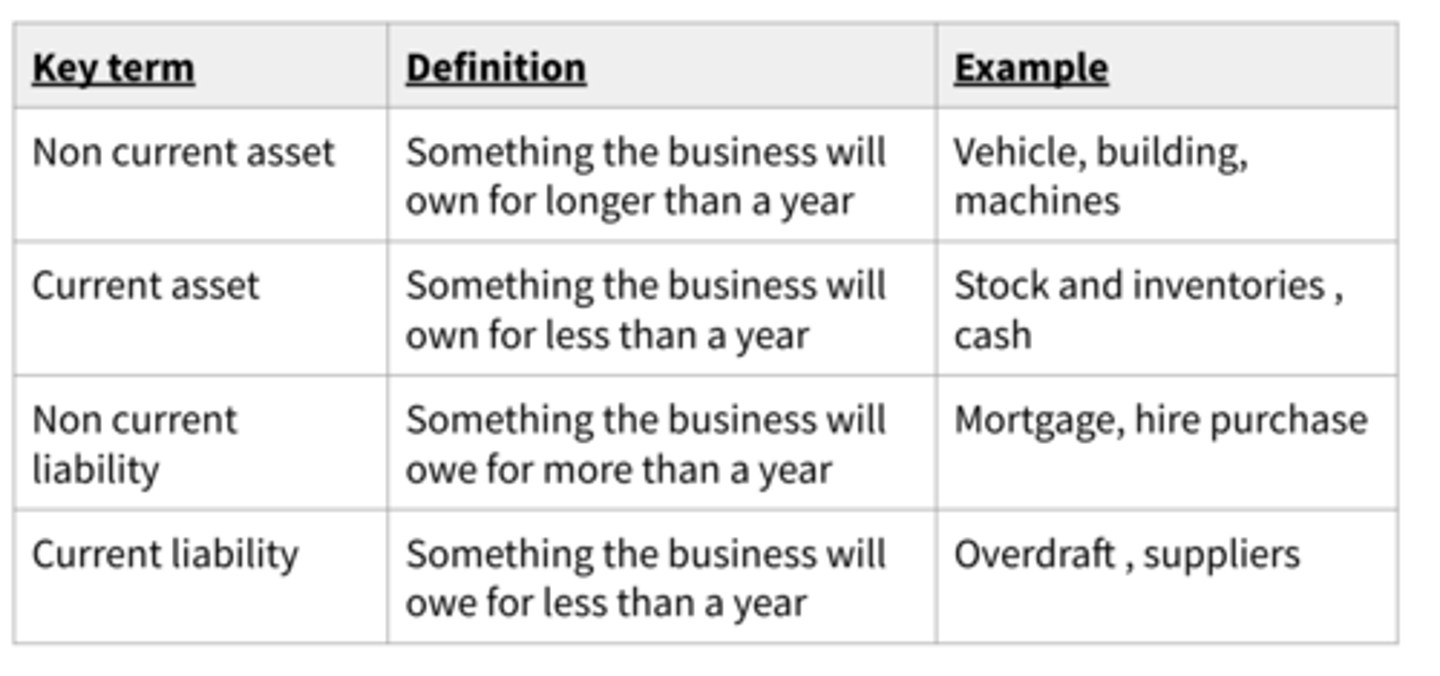
Different types of assets and liabilities (table)
Liquidity
How easily ans asset can be converted into cash, a business with more current assets is considered to be more liquid
Short term interpretations from the balance sheet
Net current assets/working capital: Measures the amount of money a business has available to pay for its day to day expenses
What might the issue be if a business doesn’t have enough working capital? what is the issue if they have too much?
Too little = they may not be able to cover their costs and have cash flow issues
Too much = Inefficient use of resources
Influences on level of working capital held
- Volume of sales
- Amount of trade credit offered by the business
- Whether or not the firm is growing
- The length of the operating cycle - time between paying for - raw materials and receiving payment from customers
-The rate of inflation
- Inventory management system (JIT or JIC)
Purposes of the balance sheet
- Help stakeholders assess financial strength of the business
- Recognise the scale of the business (Capital employed)
- Calculate net assets showing value of business
- Understanding of the nature of the business by the types and amounts of assets it holds
- Show liquidity position
- Show source of capital
- Recognise changes overtime and address any concerning trends
Benefit of the balance sheet to different stakeholders
Shareholders - value of the business, level of assets and potential for future return
Suppliers - Short-term position and liquidity (working capital) as they want to ensure credit is paid on time
Managers - capital employed and success of investment + possibility of raising future funds
Depreciation
Decrease in the value of assets overtime
Income statement
A financial statement showing all a firm's revenue over a trading period and the cost incurred to earn that revenue
Note: figures on the income statement (revenues and types of profit) take into account regular trading activities and ignore one off activities, non-trading activities like investments or joint venture profits
Components of an income statement
1) Revenue (from sales)
2) Direct costs (or cost of sales)
3) Gross profit
4) Indirect costs (or expenses)
5) Operating profit
6) Tax and interest
7) Net Profit
Revenue
earnings or income generated by firms as result of its trading activities
Formula - Selling price x Units sold
Direct costs (cost of goods sold)
spending that can be clearly allocated to a particular product or area of the business includes fuel and raw materials
Gross profit
Revenue - Direct costs
Indirect costs
spending that relates to all aspects of a business's activities includes building maintenance costs and salaries
Operating profit
Gross profit - Indirect costs
Financial surplus from business's normal trading before tax and interest
Net profit
Operating profit - tax and interest
Exceptional items
large transactions, in the usual trading activities
Extraordinary items
large transactions, outside the normal trading activities
Interpreting the income statement
- Assess the level of revenue the business is generating
- Compare the gross profit figure to revenues and operating profit to see how efficient the business is at achieving a high added value
- See which areas of the business present the most significant cost (indirect or direct)
- Can see the nature of the business and product by balance of costs
- Assess ability for business to pay dividends or fund expansion using retained profits through net profit
What may different stakeholder be interested in from the income statement
Managers: Cost of sales and expenses, revenue and operating profits, one off expenses
Shareholders: Operating and net profits to see if investment to see if there will be a return on investment
Employees: Expense such as wages, net profit (should they be getting paid more)
Financial ratio analysis
Method of assessing a firm's financial situation by comparing two sets of linked data
4 types of financial ratio
Profitability
Liquidity
Gearing
Efficiency
Profitability ratios
Compare the profits with the size of the business to see of efficiency a firm is at converting revenue and resources into profit
Include:
- Gross, operating and net profit margins
- Return on capital employed (ROCE)
Gross profit margin
Gross profit/sales revenue x 100
Shows us how much was spent on direct costs such as raw materials and direct wages to generate each £ of revenue.
Operating profit margin
Operating profit / sales revenue x 100
Considered the best measure for financial performance as it considered all costs that are incurred in generating revenue
Net profit margin
Net profit/sales revenue x 100
Will take into account interest payments or could show an improvement in debt financing, may be important indicator to show whether increasing dividends can be paid
Return on capital employed
(Operating profit / capital employed) x 100
Considered main performance ratio - shows how efficiently a business has used resources to generate returns
Liquidity ratios
Measure the ability for a business to remain solvent (pay its liabilities) in the short term
Includes:
Current ratio
Solvency
Firms ability to pays its debts on time, needs enough cash or current assets to remain solvent
Current ratio
Current assets/current liabilities
- Measures liquidity by expressing current assets as a ratio to current liabilities
i.e £500,000 current assets, £250,000 current liability
= £500,000/£250,000 - 2:1
Gearing
(non-current liabilities/capital employed x 100)
analyses capital structure of a firm showing how much of their capital has been raised through external sources
High gearing
Above 50% - shows a business has borrowed a significant amount of money
Low gearing
25% or below - shows a firm has raised most of its money through shareholders in the form of share capital and retained profits
Benefits of high gearing
- Less capital required to be invested by shareholders
- Debt can be a relatively cheap source of finance compared with dividends
- Easy to pay interest if profits and cash flows are strong
- Interest payment will be lower than dividend payments when profits are high so owner would rather borrow then have to sell more shares
Benefits of low gearing
- Less risk of defaulting on debts
- Avoid interest payments
- Business has the capacity to add debt if required
Financial efficiency ratios
Concentrates on how well a business managers certain assets and liabilities - internal operations
includes:
Payable days
Receivable days
Inventory turnover
Payable days
(Payables / cost of sales) x 365
- Shows the number of days it take to pay back any payable (trade credit from suppliers) - want this figure to be higher then receivable days
Receivable days
Receivables / revenue x 365
- Shows the number of days it takes for receivables to be converted in cash (credit extended to customers to be paid) - want this figure to be lower then payable days
Inventory turnover
cost of goods sold/average inventory
Shows how quickly stock is converted into sales.
i.e a business has inventory turnover of 26 times meaning it converts inventories into cash every 14 days (2 weeks)
- Higher the better
Factors influencing rate of inventory turnover
- nature of the product (perishable or not)
- importance of holding inventory
- length of product life cycle
- inventory management systems (e.g JIT will have low inventory levels)
- Quality of management
- Variety of products
Effective ways to analyse data from financial statements and ratios
- Overtime: comparing changes to data over year on year offers valuable insight into the changing performance of the business
- In comparison with other businesses: This will allow a benchmark for performance and can provide ways to enhance competitiveness
- Must apply context and qualitative information to numerical data to ensure data can be interpreted correctly, reason applied and appropriate plan put place going forward i.e impact of external factors, what is important to the business (corporate objectives)