BIOL101A: Ex. 2 Graphs and Measurements
1/12
There's no tags or description
Looks like no tags are added yet.
Name | Mastery | Learn | Test | Matching | Spaced |
|---|
No study sessions yet.
13 Terms
measurement
description of a phenomenon in precise terms which then can be handled objectively
systolic pressure
equal to the maximum pressure recorded in an artery
diastolic pressure
the minimum pressure recorded in an artery
waist-to-hip ratio
estimates belly fat
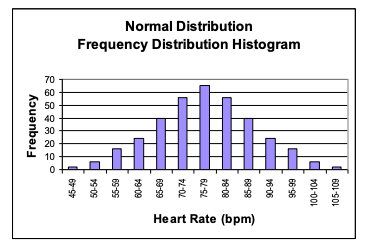
normal distribution
the definite pattern with most of the values clustered toward the middle of the range and very few values at the extreme edges of the range
described the variation in a large number of phenomena, biological and non-biological
central tendency
the idea that there is a tendency for values to group around a central value
distribution
a certain degree of variability or spread away from this central value
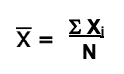
mean
the average value obtained by dividing the sum of a sample of quantities by the total number of quantities added
median
another measure of central tendency that is the middle-most value of a list of values comprising the data set
4,9,10,10,13,24,22,34
13 —> middle most
mode
the value in a data set that occurs most frequently
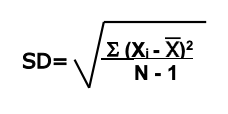
standard deviation
measure of variability relative to the mean
Xi - avg = the difference of each value from the mean
N = total number of individual measurements (same size)
can be used to predict the number of measurements which should fall within any given interval centered on the mean
causality
demonstrated by altering one variable (IV) in the system experimentally and then observe whether a corresponding change takes place in the other variable (DV)
statistical correlation
measures the strength and direction of a linear relationship between two variables