Frequency tables, mean, median, mode
1/29
Earn XP
Description and Tags
will need to study them written too with math
Name | Mastery | Learn | Test | Matching | Spaced | Call with Kai |
|---|
No analytics yet
Send a link to your students to track their progress
30 Terms
What is frequency in statistics
Frequency is how often a value or category occurs in a dataset (e.g., how many students got an A+).
What is a frequency table
Shows each category and the number of times it occurs — a summary of the data distribution
Conceptual meaning of a frequency table
Shows the shape of the data which categories are common rare or dominant
A distribution
A display of how often each value or category occurs in a sample or population.
Categories and frequency counts
Categories: the values being measured (e.g., grades, gender, income).
Frequency counts: how many times each category occurs.
Negative aspect of frequency tables
They lose detail, you can’t see the exact distribution within each group
A percentage in frequency table
Proportion of a category relative to the total number of observations, expressed as a percent. Allows comparison between categories even if sample sizes differ
Why can percentages be misleading with SMALL samples
Small chances cause a large amount of % swings
Ex. 2/4 50%, 3/4 75% = 25% increase
Always include ___ and ____ in frequency tables
Counts and percentages to avoid misrepresentation
Procedural process for creating a frequency table
List all categories
Count how many times each value occurs
Record counts
Add total row
Compute percentages
Procedural process for percentages in a frequency table
Divide category count by total
Multiply by 100
Round to one or two decimals
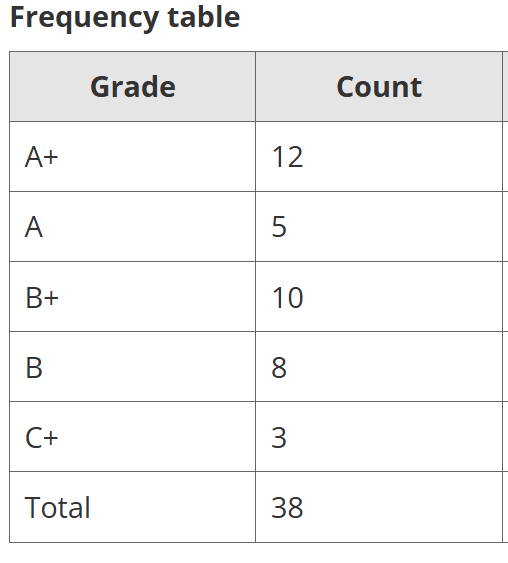
Example: heres the table calculate percentages
31.6
13.2
26.3
21.1
7.9
100.1
Why is understanding frequency tables important?
Essential for making distributions, percentages, bar charts, inferential tests
What is the Mean (sample)
Representation of the balance point, centre or average of a dataset
The most commonly used measure of central tendency
The mean can only be used for ____ or ___ data
Interval or ratio data
Procedure of the mean (sample)
Add the values (Σx)
Divide by number of values (n)
Mean = Σx/n
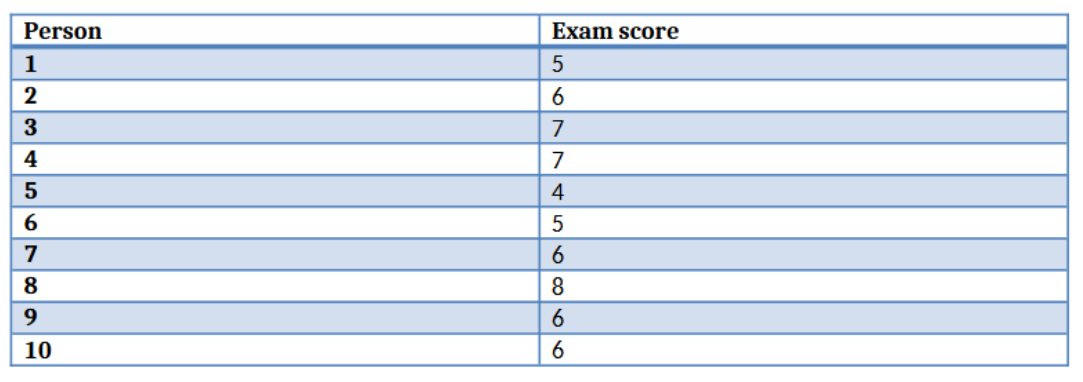
Calculate the Mean (sample)
Sum of numbers = 60, n = 10
Therefore:
(5+6+7+7+4+5+6+8+6+6) / 10 = 60 / 10
60 / 10 = 6
Outliers for the mean (sample)
The mean is sensitive to extreme values (bill gates), one high value can distort
If outliers distrort the mean:
Remove the outlier and report it
Use median instead
Difference between population mean and sample mean
P: Uses Greek letter μ and capital N for population size.
Sample mean: Uses x̄ and lowercase n.
Both measure the same thing — the average — but one describes a parameter (population) and the other a statistic (sample).
What is the median
Middle value in sorted data
Good when data is skewed, outliers and for ordinal data only
How to calculate the median
Sort data from smallest to largest
If n is odd: middle value
If n is even: average of two middle values
Shortcut to calculate median POSITION
(n+1)/2
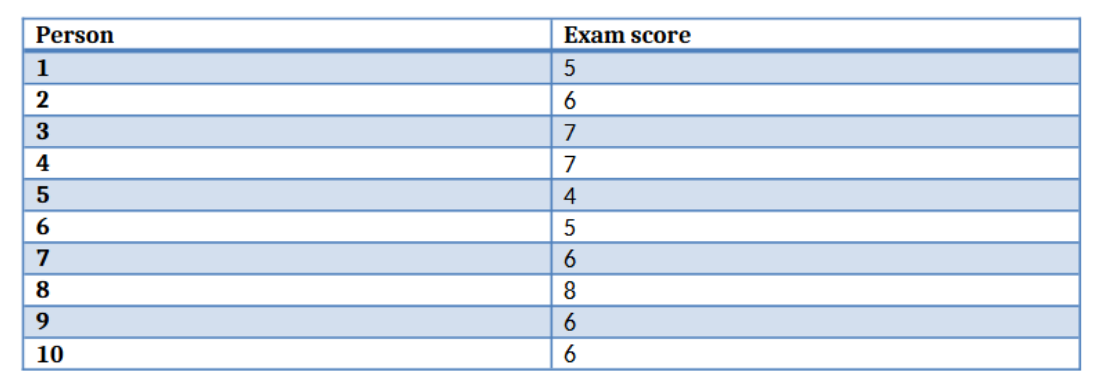
Example of median (even)
5, 6, 7, 7, 4, 5, 6, 8, 6, 6 —> 4, 5, 5, 6, 6, 6, 6, 7, 7, 8
Middle values are 6 & 6
Therefore: (6+6) / 2 = 6
Example of median (odd)
Data: 3, 8, 4, 7, 12
3, 4, 7, 8, 12
Therefore its 7
What is the mode
Most frequent value in a dataset
Good for categories, peak of distribution
Example of mode
Data: 1, 3, 3, 5, 5, 5, 5, 8, 22, 24
Mode = 5
Right‑skewed distribution rule
Mean > Median = Mode
Cheat card for mean median mode
Mean: add and divide
Median: middle
Mode: most
Rhyme to remember mean median mode
Mean is so mean, I have to add and divide
Median middle like the fiddle I slide
Mode shows the most, even when values collide