GEOG 1201 EXAM #1
1/108
Earn XP
Description and Tags
Name | Mastery | Learn | Test | Matching | Spaced | Call with Kai |
|---|
No analytics yet
Send a link to your students to track their progress
109 Terms
Cryosphere
frozen water (part of hydrosphere)
Latitude
specifies north/south position (North Pole: 90 degrees)
Longitude
vertical lines
Prime meridian
Greenwich England (marker for time zones, etc.)
When did Earth’s atmo form?
4.6 billion years ago
Why did atmo form?
outgassing (release of gasses trapped in Earth’s interior, usually through volcanic activity)
1st atmo/primordial atmo
mostly sulfuric (O2 lacking), volcanic eruptions, water vapor, CO2
2nd atmo formation
formed as Earth cooled and water vapor formed clouds
Ocean formation
N2 increase
O2 not present still
3rd atmo
formed as ocean life evolved
Bacteria began photosynthesis (phytoplankton)
O2 became significant 2.2 billion years ago
Modern atmo
formed when ozone in stratosphere developed
Atmospheric pressure at sea level
1kg on 1 cm²
Atmo composition
Heterosphere
Homosphere
Heterosphere
outer atmo
Not uniform (gases occur in distinct layers according to atomic weight)
Hydrogen and helium are lighter, O2 and N2 heavier
Homosphere
fairly uniform blend of gases
Constant gases
Variable gases
Constant gases
AMOUNT DOESN’T REALLY CHANGE
N2, O2, Ar (argon), Ne (neon(, He (helium), Kr (krypton), and Xe (xenon)
Variable gases
AMOUNT CHANGES IN ATMOSPHERE
H2O, CO2, CH4, N2O (nitrous oxide), O3
Layers of atmo
Thermosphere
Mesosphere
Stratosphere
Troposphere
Thermosphere
outermost (upper limit = thermopause)
TEMPERATURES RISE - no other layers blocking radiation, takes in lots of solar radiation
Mesosphere
coldest part of atmo, low air pressure (upper limit = mesopause)
TEMPERATURES DECREASE WITH ALTITUDE
Stratosphere
ozone layer converting ultraviolet energy to heat → heating (outer boundary = stratopause)
TEMPERATURES INCREASE WITH ALTITUDE
Troposphere
where weather occurs (outer boundary = tropopause)
TEMPERATURES DECREASE WITH ALTITUDE
Atmo function
Ionosphere
Ozonosphere
Ionosphere
outer layer, absorbs cosmic rays, gamma rays, x-rays (etc.) - changes atoms to positively charged ions
Ozonosphere
O3 layer
Ozone depletion
caused by CFCs
UV → CFC = Cl, chlorine breaks down O3
Montreal Protocol
reduced sale and production of CFCs, improved conditions
Effects of O3 depletion
decrease agricultural productivity, alters phytoplankton/plant physiology, skin damage for humans
Natural sources of pollutants
volcanoes, forest fires, pollen, dust storms
Anthropogenic sources of pollution
transportation, burning of fossil fuels, deforestation, etc.
Photochemical smog
mix of UV/NOx/VOCs
UV breaks NO2 into O + NO, NO+O2=O3
Effects of photochemical smog
damage to biological tissues, lung irritation, asthma, increased risk of respiratory illness
NO + VOCS = PANS → eye irritation
Clean Air Act
control pollution on a national level
Industrial pollutants
CO2, pm, sulfuric oxides, SO2 (sulfuric dioxide)+O=SO3 (sulfur trioxide)
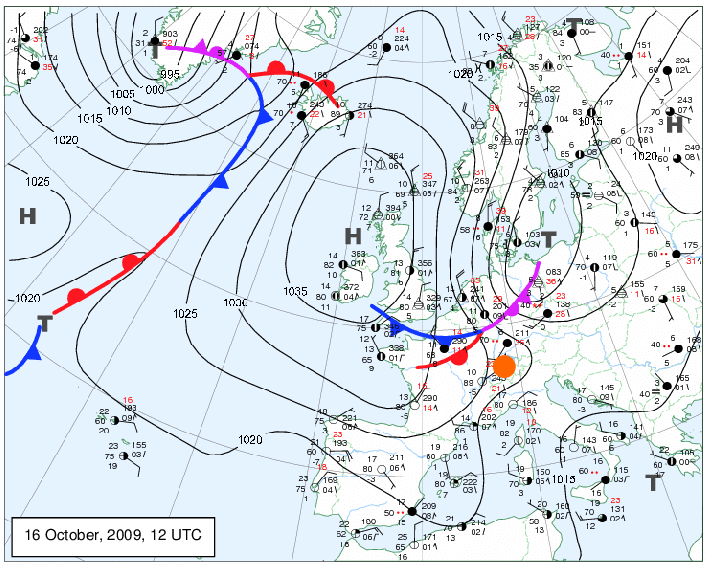
Synoptic maps
typically national, air temp,. cloud cover, wind, air pressure, fronts
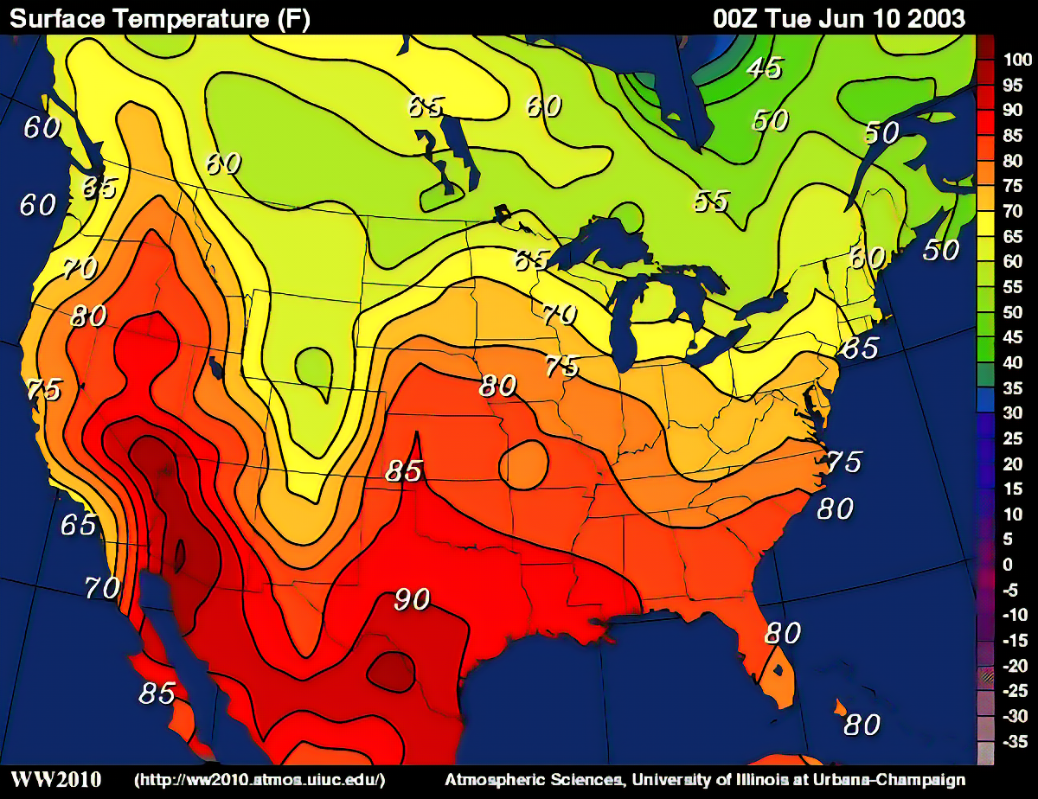
Isothermal
temp - contours correspond to temp
Isobaric
air pressure - lines called isobars
Radar
precipitation
Satellite imagery
from GOES, cloud formation, eastern and western satellites
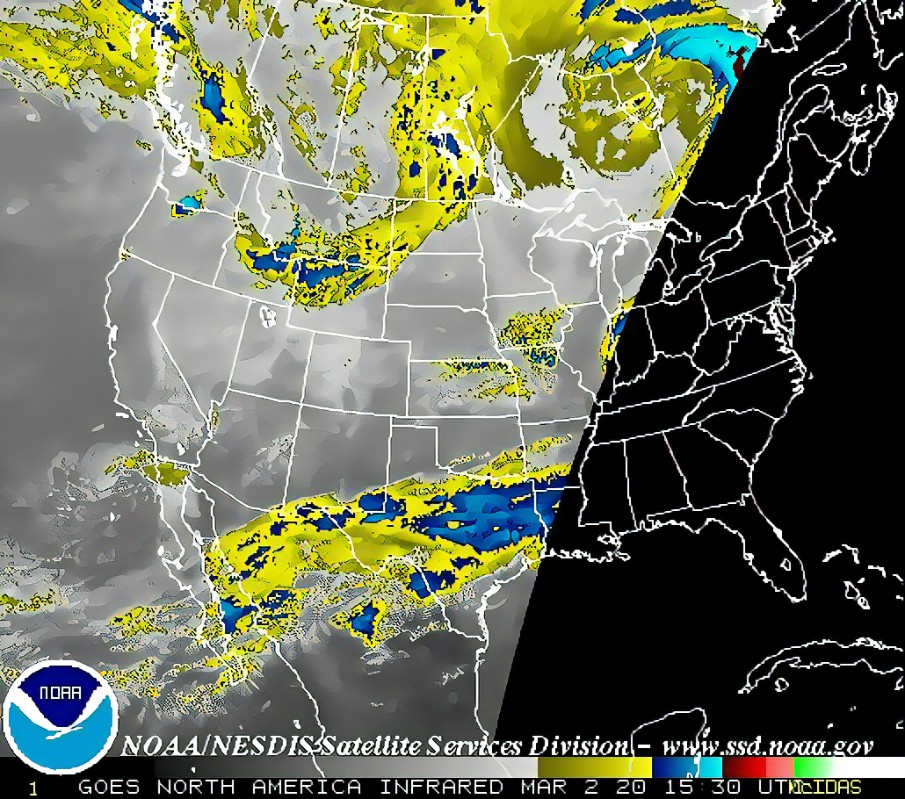
Composite satellite image
usually satellite+radar
Atmospheric soundings
by weather balloon, balloon carries radiosonde (measures temp, humidity, pressure, wind), data at specific altitudes
Smog
used to be byproduct of coal and fog (similar to sulfuric acid), engines produce NOX, forms with VOCs, temp inverses and local geo can trap pollutants
Origin of O2
photodissociation (water vapor→2H2O+vis→2H2+O2
photosynthesis (CO2+vis+H2O→CH2O+O2)
Photosynthesis formula
CO2+vis+H2O→CH2O+O2
Ozone formation
photodissociation and recombination of oxygen
O3+UV=2O
O2+O=O3
CO2 sources
decay, volcanoes, burning of fossil fuels, deforestation, weathering of carbonate rocks
Nitrogen sources
volcanoes, industry, vegetation
Argon sources
radioactive decay
Sunspots
sun’s surface disturbances caused by magnetic storms (more=increased radiation)
Solar minimum
period when few sunspots visible
Solar maximum
period with numerous sunspots
Solar wind
sun emitting clouds of electrically charged particles - interacts with Earth’s magnetic field and deflects solar wind towards poles
causes aurora borealis and aurora australis
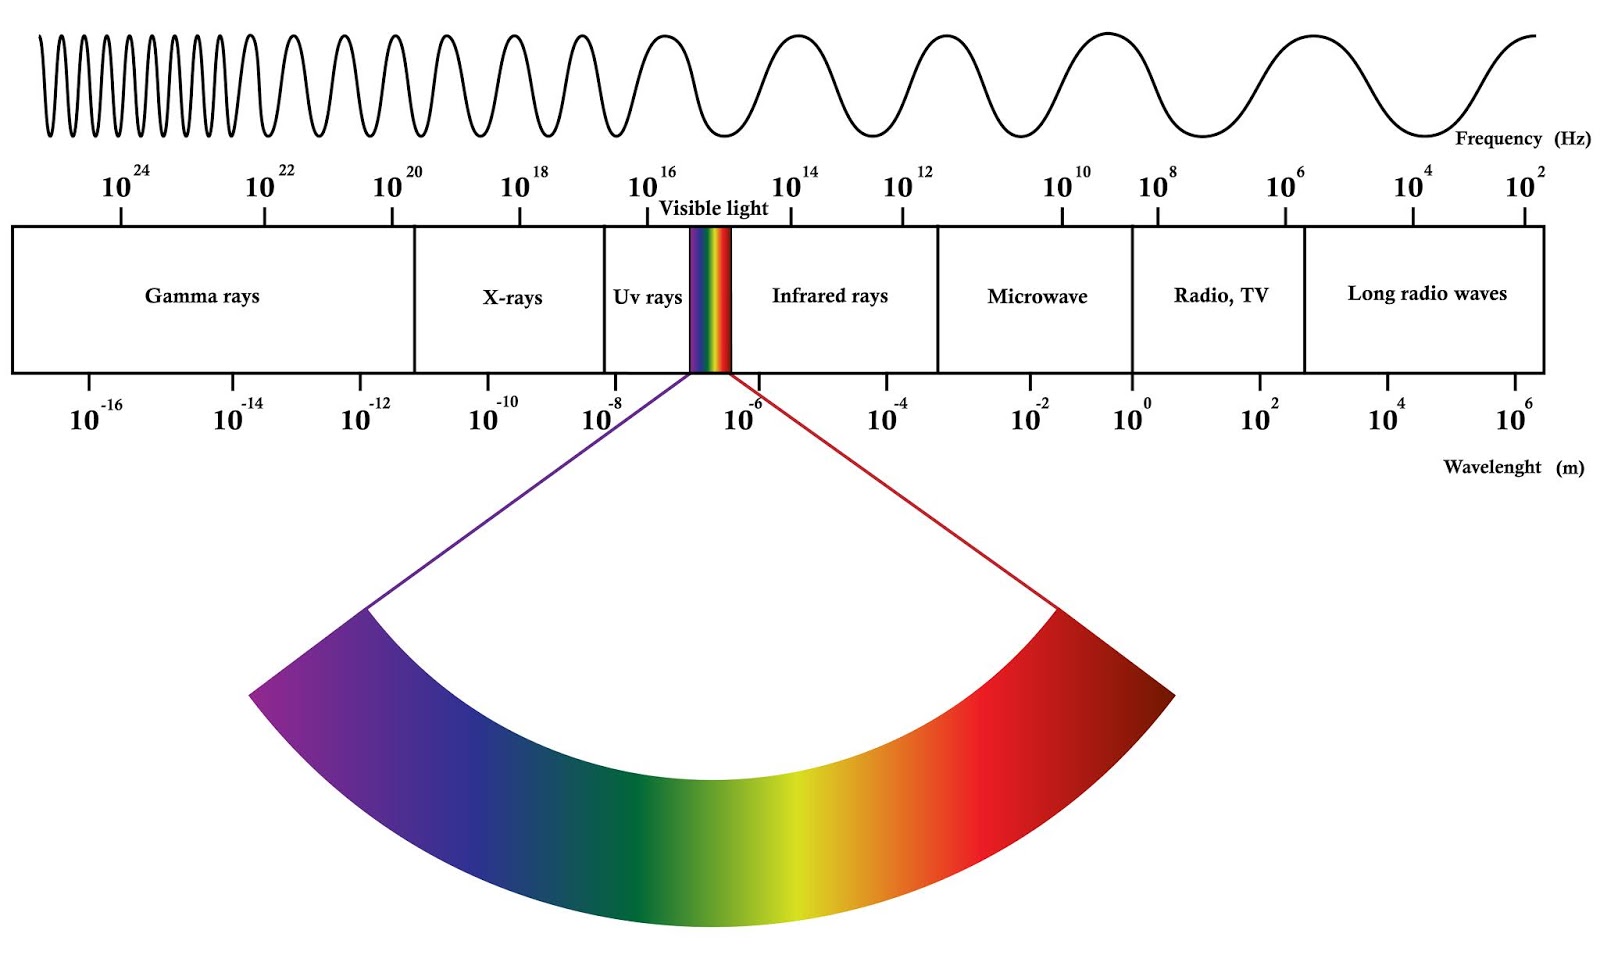
Radiant energy
sun’s energy, travels in waves
EM spectrum
hotter the object, shorter the wavelength
Insolation
solar energy intercepted by Earth
Solar constant
avg. insolation received at thermopause
Isotope analysis
16O and 18O specifically used to determine climate (more 16O is indicative of warmer climate conditions)
Sediment cores
calcium carbonate shells that build up and become sediment on ocean floor
Rapid warming
56 mya
Paleocene-Eocene Thermal Maximum (PETM) - suddenn increase in CO2 (potentially because of methane release from ocean floor)
Pleistocene
2.5 mya-11,700 years ago
most recent flaciation
Carbon isotope analysis
analyzing ration of 13C/12C - connected to radioactive decay
used for short-term dating
Speleothems
calcium carbonate mineral deposits in caves (stalactites and stalagmites)
similar to tree rings
climate paleontology
Corals
used for climate paleontology
similar to speleothems and tree rings
Transmissivity
radiation goes through substance
Rayleigh scatter
scatter more because shorter wavelength
Mic scatter
even scatter by O2 molecules
Natural climate fluctuation
solar variability - sunspots (not really driver of climate)
orbital cycles - elliptical orbit in 100,000 year cycles
axis wobbles - 26,000 year cycles
axial tilt - 41,000 year cycles
Feedback mechanisms
ice - albedo
water - vapor (increased evap→increased humidity→more evap)
permafrost
wildfire
Carbon budget
exchange of carbon between sources and sinks
largest sink is oceans
IPCC
Intergovernmental Panel on Climate Change
U.N. sponsored
findings: temps increasing globally, ice melt, sea level rise (melting of land mass, thermal expansion)
Kyoto Protocol
legally binding specific emission reductions
COP 21
agreement to reduce greenhouse gas emissions
Ozone hole
50% reduction seasonally, 4-7% depletion per decade
minimum occurs during spring
caused by polar vortex (circulation of cold air)
Polar stratospheric clouds (PSCs)
Cl compounds interacting with cloud particles → increased Cl concentration during winter (UV in spring release Cl, leading to rapid ozone depletion)
Energy
ability to do work (work=force applied over distance)
Power
work over time (measured in watts)
Conduction
transfer between matter in physical contact
Convection
transfer via heating of fluids
Stefan-Boltzmann Law
difference between temp of substance and radiation it gives off
Wien’s Law
wavelength of maximum emission inversely proportional to temp
Direct radiation
direct to ground
Diffuse radiation
passes through clouds to ground
Scattering
deflection and redirection of insolation (the lower the wavelength, greater the scattering)
Refraction
bending of em rays
Reflection
reflecting energy back into space
Absorbtion
assimilation of radiation by molecules of matter
Sensible heat
heat able to be sensed (from kinetic energy)
Latent heat
heat lost/gained when a subject changes states
Highest level of insolation
at tropics
Net radiation
sum of all incoming and outgoing radiation
Terrestrial radiation
about 460 w/m²
10 wavelength of max emission (longwave)
Atmospheric window
no absorption in atmosphere from earth reradiating heat
Revolution
orbit
365.4 days
Rotation
determines day length, deflection of winds, ocean currents, tides
variations in rotational velocity create the Coriolis effect
Axis tilt
about 23.5 degrees
Evidence of climate change
ice cores (isotope ratios, trapped air bubbles)
sea ice
fauna (invertabrae fossils, plankton, dinosaur fossils)
pollen samples (extracted from lake floors, pollen is seasonal)'
tree rings
historical logs and diaries
Diurnal variation
between day and night
Aphelion
Earth’s furthest point from sun (July 4)
Perihelion
Earth closes to the sun (Jan. 3)