ACCT3583 Strategic Value Management
1/94
There's no tags or description
Looks like no tags are added yet.
Name | Mastery | Learn | Test | Matching | Spaced | Call with Kai |
|---|
No analytics yet
Send a link to your students to track their progress
95 Terms
SWOT Analysis
Used to analyse the external environment to identify potential opportunities and threats and assessing an organiastions internal environment to identify its strengths and weaknesses
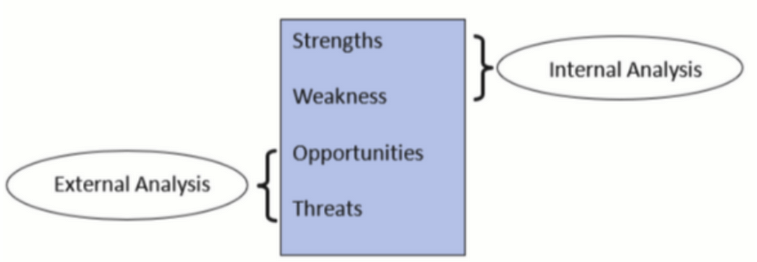
Strengths
Are something an organisation does well in, they enable an organisation to exploit opportunities and neutralise threats in its external environment, enhancing its competitiveness in markets.
Therefore organisations should build on its strengths and develop strategies that will exploit its strengths
Weaknesses
Are something the organisation does poorly in, they impede an organisation’s ability to exploit opportunities, exacerbate threats and reduce its competitiveness in markets.
Organisations need to identify ways to remove weaknesses and improve on deficiencies, they require an honest good look at organisations, confronting unpleasant truths about possible deficiencies
Opportunities
Are factors emerging in the external environment that if explited can improve an organisation’s competitiveness in markets. They may arise from markets they currently serve, or from unrelated industries
However not all opportunities should or can be exploited, as managers need to rank them by attractiveness, how they fit into the organisation’s current strategies and the org’s ability to exploit them
Threats
Are factors emerging in the external environment that can have a negative impact on an organisation’s competitiveness in markets. They can emerge from markets they currently operate in or from other industries
An organisation needs to determine the severity of the threats and take appropriate action to neutralise threats that may hinder an organisation’s ability to implement its strategies
External Environment Analysis
Assists an organisation to identify opportunities and threats
involves developing a list of relevant environmental trends that can affect an organisation, evaluate whether they are threats, opportunities or both, it is important at this step to specify the nature of the opportunity or threat at this stage
An organisation normally considers the “macro” environment and the competitive environment it operates in
Macro Environment Analysis
Comprises broad environmental trends that affect most organisations, industries and sectors.
Typically use the DEPEST framework to analyse the six macro environmental trends
Demographic Trends
Describe the broad charactheristics that make up a state or country
Elements include aging population, increasing/decreasing affluence, income disparities, changes in population size, and the geographic distribution of the population, etc
Economic Trends
State, nature and direction of a country’s economy
Indicators to consider include trends in interest rates, inflation rates, GDP, trade deficits/surpluses, unemployment rates, etc
Political / Legal Trends
Relates to how a society creates and exercises power, including its laws, rules, taxation policies, and the strength of the institutions (ACCC for example)
Ecologic Trends
Relate to changes in the natural environment such as the weather, climate change, rising sea levels and water shortages
Socio-Cultural Trends
Represent the set of values, beliefs, ideas, attitudes and other charactheristics that distinguish mmebers of one group from those of another
Should not be confused with demographic trends which relate to the broad charactheristics of the population
Include increasing concerns for healthier lifestyles, work life balance, cultural diversity and concern for climate change
Technological Trends
Represent innovation and development to be found in technology and knowledge
Include advancements in genetic engineering, nanotech, and the development of solar energy technology, etc
Competitive / Industry Environment
Typically analysed using a framework called Porter’s five forces (not to be used for analysing individual firms)
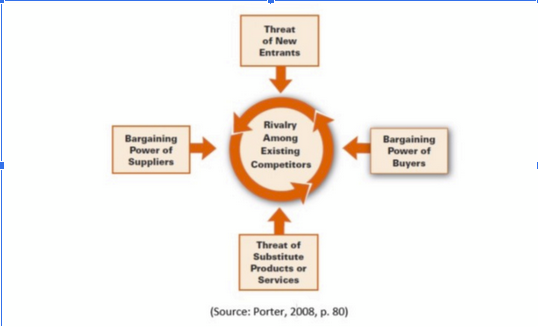
Threat of new entrants
competitive pressures coming from the possibility of new rivals entering an industry putting pressure on prices, costs, and market share.
level of threat from new entrants depends on existing barriers to entry. Sources of these barriers include:
Capital Requirements
Economies of Scale
Customer Loyalty and Brand Preference
Restrictive regulatory policies
Bargaining power of suppliers
bargaining power of the supplying industry depends on the supplier’s economic bargaining power relative to organisations in the industry of interest. Suppliers can threaten the profitability of an industry by exerting their power to raise prices or by restricting the quantity and/or quality of goods available for sale
Indicators of powerful supplying industries are:
Supplier group concentration
High switching costs
Buying industry’s organisations are not a major customer to the supplying industry
Threat of substitute products or services
Substitute products/services are products/services from outside an industry that perform similar/same functions as the industry’s products/services. Can threaten the profitability of an industry if they offer products/services that are (1) cheaper and (2) can perform similar functions.
Bargaining power of buyers
When buyers have higher bargaining power over an industry, they can threaten to drive down prices and demand better quality and quantity
Indicators include:
Buyer group concentration
Low switching costs
Industry’s products are standardised or undifferentiated (not unique)
Rivalry amongst existing competitors
Factors affecting the intensity of rivalry include:
Low industry growth
Numerous or equally balanced competitors
Lack of differentiation or low switching costs
High exit barrier
Internal Analysis Framework
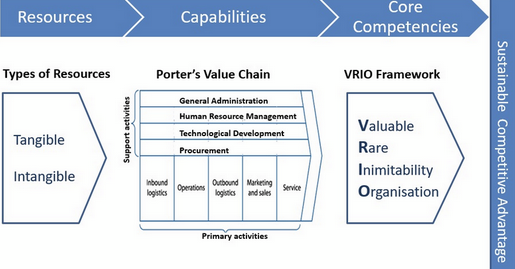
Tangible Resources
are highly visible, and the information can be found in the financial statements. They include:
Financial resources: this relates to the state of the organisation’s borrowing capacity, ability to raise equity and ability to generate internal funds (e.g., ROE, ROA, Debt to equity ratio, earning per share etc.) and credit ratings.
Physical resources: this relates to the physical assets of the organisation, such as the location of its production facilities and the state of manufacturing capacity
Organisational resources: this relates to an organisations’ formal structures (e.g., reporting, strategic planning processes and co-ordinating structures) evaluation and control systems
Intangible Resources
are less visible and are generally not reported in the financial statements. They
Include:
Human resources: cumulative knowledge, experience, capabiolities and motivation of the organisation’s workforce, managerial talent and leadership skills, and the intellectual capital / know-how of talent in an organisation
Technological resources: relates to the stock of technology of an organisation such as patents, copyrights, trademarks and trade secrets
Reputation resources: relates to the reputation with customers (e.g: brand name, customers perceptions of product / service quality) and reputation with suppliers for fairness, collaboration and efficiency
Culture: relates to the norms of behaviour, business practices, and beliefs within the organisation
Capabilities
Organisation’s capacity to deploy resources to achieve a desired outcome
Can be identified with Porter’s value chain framework
Porter value chain framework
Shows the sequence of activities that are needed to transform raw inputs into products and services for customers
Value to customers is reflected in the price that customers are willing to pay for the products / services
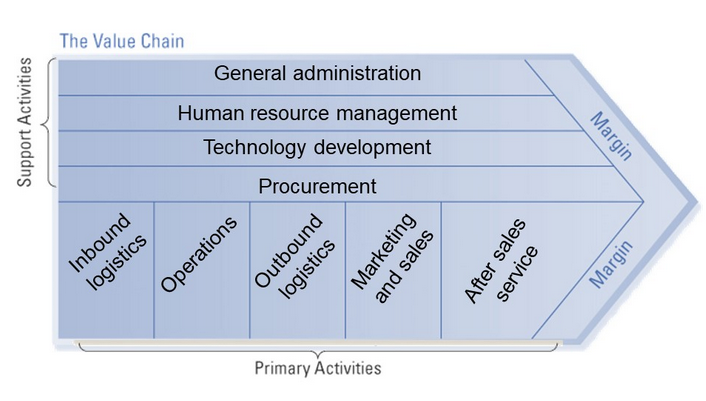
Primary activities
those that are directly involved in transforming raw materials to products, the sale and distribution of products and services after the sale
Consists of 5 primary activities:
Inbound logistics
Operations
Outbound logistics
Sales and marketing
After sales services
Inbound logistics
Relate to receiving, storing nad distributing inputs of a service
Ex: handling, warehousing, inventory control, vehicle scheduling, and returns to suppliers
Operations
Relate to the process of transforming inputs into the final product to be sold to custoers
Ex: assembling, QA, maintenance, facilities operations, stocking shelves and providing client services
NOTE: For service organisastions, providing these services are classified as services because they often apply specialised knowledge to provide outcomes to the client
Outbound logistics
Relate to collecting, storing and distributing finished products or services to customers
Ex: warehousing of finished products, delivering finished products to customers, and processing customers’ orders
Sales and marketing
Relate to providing after sales service to enhance or maintain the value of products and services provided to customers
Ex: promotion/advertising, conducting market research, pricing and selecting sales channel
After sales services
Relate to providing after sales service to enhance or maintain the value of products and services provided to customers
Ex:installing machines, repairing, training, supplying parts and providing technical support
Support Activities
Provide the ancillary support necessary for primary activities to take place and also provide assistance for other support activities
not directly involved in producing goods and services for the customers
4 categories
Procurement
Technological development
Human Resources Management (HRM)
General Administration
Procurement
Activities relate to purchasing inputs used by an organisation to create value
Includes purchasing raw materials for production, office supplies, fixed assets such as machinery, managing supplier relationships and supplier selection
Technological development
Relate to the development of new knowledge that enables new product innovations and new process innovations
Includes developing new products or services, new product features, new production methods, and basic research to discover new knowledge
Human Resources Management (HRM)
Relate to the acquisition, development and retention of personnel
Includes recruiting, hiring, training, development and compensation for all types of employees / personnel
General Administration
Activities that support the coordination of the entire value chaoin
Includes strategy development, general management , planning , accounting, finance and legal compliance
Core Compentency
Unique capabilities that an organisation can do better than it’s rivals
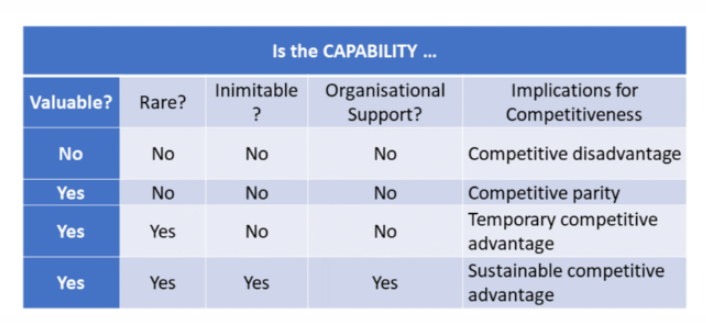
However they must meet four crtiteria to be considered a core competency (VRIO)
Valuable
Capability must be valuable in the sense that it enables an organisation to formulate and implement products or services that are of value to customers, stakeholders thus enhancing competitiveness in the market
Rare
Achieved when an organisation is able to develop and exploit valuable capabilities that are different and possessed by only a few competitors
Immutable
Difficulty to imitate and this is created by:
Unique historical conditions: competitors are unable to compete because these capabilities have been buolt and developed over time in ways that are difficult to accelerate
Causal ambiguity: competitors are unable to compete if they cannot disentagle possible causes or explanations of what the capability is and how it can be recreated
Social complexity: competitors are unable to compete as the dominating firm has strong relationships with suppliers and customers
Organisation support
Organisation structures, formal and informal management control systems need to support its exploitation
Example: Samsung with its marketing team which promotes their newest products or their HR Team that recruits the best engineers
VRIO framework
Resources vs Capabilities vs Core Competenecies
Capabilities are sources of an organisations core compentencies as resources need to be combined to create capabilities
Capabilities are what organisations do
Resources are what organisations have
Strategy
Relates to keywords such as long-term, direction, planning and organisation
Organisations consider two levels of strategy, business level and corporate strategy
SAFe Framework
Used to analyse and evaluate the “appropriateness of business level strategic recommendations
SAFe:
Suitable, assesses whether proposed strategic recommendations address the key opportunities and threats identified from external environment analyses. When making this assessment, management needs to assess whether strategic recommendations exploit the key opportunities and neutralise the key threats identified in the SWOT analysis.
Acceptable, assesses the potential impact of each strategy on various stakeholders in terms of their expectations or interests. Start by identifying the main stakeholders expectations For example, what are the main expectations or interests of suppliers? One expectation is that suppliers like to be paid on time. Another expectation is that suppliers would like to establish a long-term business relationship with an organisation. What about employees? Do the strategic recommendations address main stakeholders’ concerns?
Feasible, assesses whether the strategic recommendations could work in practice given an organisation’s strengths and weaknesses. Does the organisation have the strengths to execute the strategy? Do the strategic recommendations exploit the organisation’s strengths, especially its core competencies? How does the organisation’s weaknesses affect its ability to execute strategies?
Corporate level strategies
relate to where the organisation’s business units compete in or their industries
generally there are 3 generic corporate level strategic options:
Undiversified: Organisation competes in a single business/industry that focuses on an existing market (KFC)
Related diversification: Organisation has several lines of business that are distinct but related based on existing markets or products (Johnson & Johnson)
Unrelated diversification: Organisation has several businesses that are not closely related (Westfarmers)
Business level strategies
relate to how an organisation will compete in a chosen industry or business
an organisation when choosing a business level strategy has to decide:
Who will be served
An organisation can divide its customers into groups based on customer needs (market segmentation) through demographics, geographic, consumption,etc.
What needs of the target customers will be satisfied
An organisation must determine its custokmers needs and decides what needs it chooses to satisfy
How will these needs be satisfied
An organisation must be able to deploy its core competencies and capabilities to meet customers needs
Generic strategy framework
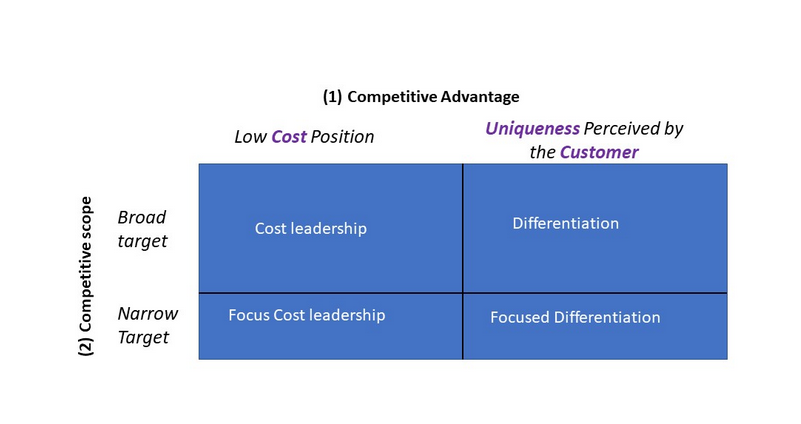
First decision relates that an organisation competes in order to achieve a competitive advantage, an orgasnisation can achieve a competitive advantage by either producing a product or providing a service at a lower cost than its competitors. This can also be done through providing superior and different products/services to its competitors charging higher prices than the cost of production.
Second decision relates to the competitive scope (type of target market), the organisation can either choose a broad target where it can meet the needs of all the customers or a narrow focus where it meets more niche customers
Based on this framework, four generic business level strategies can be seen
Cost leadership
Differentiation
Focused cost leadership
Focused differentiation
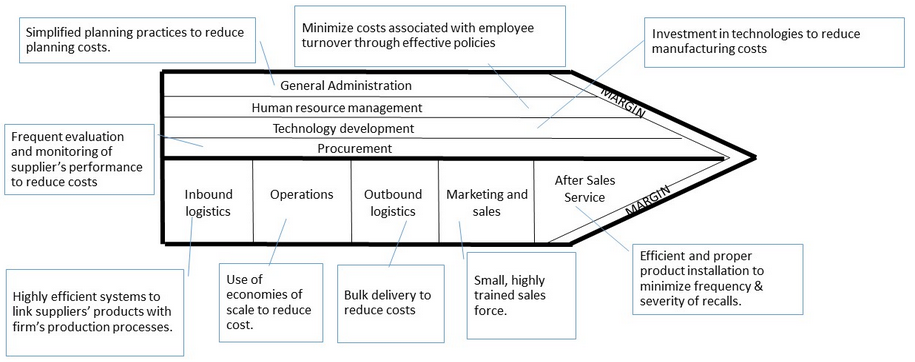
Cost leadership strategy
Integrated set of actions taken to produce goods / service at lower costs than rivals, they achieve above average returns by producing no frill goods / services at scale that customers consider to be acceptable and essential
Organisations using a cost leadership strategy need to lower their costs by performing value chain activities more cost effectively than their rivals
Cost leadership in relation to the 5 forces
Threat of new entrants
Cost leader needs to continously reduce costs to levels lower than competitors as it will be difficult for new entrants to compete without established economies of scale
Bargaining power of suppliers
Cost leaders can absorb price increases better than any organisations therefore they are in a better competitive position furthermore they are often large customers which reduces suppliers bargaining power.
Bargaining power of buyers
Buyers normally use standaridsed products / services, therefore low price often becomes the determining factor to purchase products from one organisation to another, buyers are more likely to be dependent on cost leaders due to their better prices, reducing buyers bargaining power to demand lower prices
Threats from substitutes
Cost leaders offer competitive price due to low cost of production neutralising the threats of any close substitute
Rivalry amongst existing competitors
A cost leader can neutralise existing competitors due to their ability to compete aggresively based on price, rivals will be reluctant to enter into a price war due to their cost disadvantage as without a price war there will also be greater profits for all parties
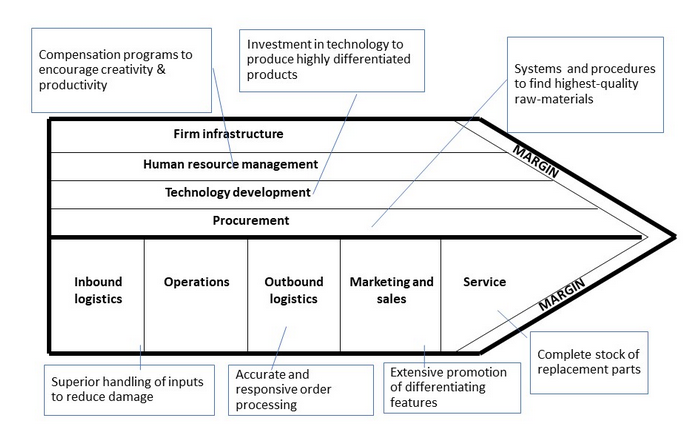
Differentiation strategy
integrated set of actions taken to produce goods/services that customers perceive to be unique in ways that are important to them (at an acceptable cost).
Utilised when customers needs and preferences are too diverrse to be fully satisfied by standardised products / services
Differentiators need to determine attributes that attracts customers but also ensure that they can charge a premium, this is done by producing at a lower scale but charging a price premium to attend above average returns
Differentiators need to consistently upgrade their differentiated features that customers value, emphasise quality, maintain quality, R&D and foster customer loyalty to build a moat against their competitors
Differentiation strategy in relation to the 5 forces
Threat of new entrants
Customer loyalty and the need to supercede the uniqueness of differentiated products can serve as a effective barrier, new entrants may also hesitate to enter an industry that requires higher quality products than existing organisations
Bargaining power of suppliers
differentiators’ ability to charge a price premium for their products/services and earn high margins allows them to absorb higher supplier costs, Further, differentiators can pass-on cost increases imposed by suppliers to their customers by increasing the price of their products/services due to their customers being less price sensitive
Bargaining power of buyers
differentiators offering of unique products / services reduces the bargaining power of customers because the perceived uniqueness reduces the likelihood of customers switching further they also reduce customers’ sensitivity to price, allowing differentiators to charge a price premium.
Threats from substitutes
threat of substitutes is high if the goods/services from the substitute industry are better in performance but a differentiator is able to offer products/services with unique features, thus neutralising the threat of substitutes.
Rivalry amongst existing competitors
Differentiators are able to neutralise the threat of competitive rivalry because their customers tend to be loyal and are unlikely to switch to competitors
Focused cost leadership strategy
integrated set of actions taken to produce goods/services at a lower cost than rivals to a targeted market segment
tends to target its products/services offering to a particular customer segment of a market instead of to the whole market.
targeted market segments can be a particular demographic group, segments of a product line or different geographic markets
Similar to a cost leadership strategy, a focused cost leadership strategy can be achieved by having a cost advantage over rivals which also serve the targeted market – by structuring value chain activities to keep costs as a bare minimum
Focused differentiation strategy
involve offering unique products/services to a targeted market segment.
success of this strategy depends on the existence of a market segment with unique product/service features and an organisation’s ability to make itself distinct from its competitors in the targeted market segment
Similar to the focused cost leadership strategy, these targeted market segments can be a particular demographic group or segments of a product line, or different geographic markets
Strategic performance measurement system (SPMS)
set of causally linked non financial and financial objectives, performance measures and goals designed to align mangers actions with an organisations strategy
Why not use conventional measures
conventional financial measures such as Return on Equity (ROE) and net profit are not sufficient for several reasons:
financial measures only capture financial performance
financial measures by themselves provide limited guidance for future actions, they capture outcomes regarding past behaviours but they do not provide sufficient information to employees on how to improve outcomes
Balanced scorecard (BSC)
business philosophy that articulates how sets of interrelated performance measures may support an organisation’s strategy with a view to achieving long term financial success
Lots of firms use this method to suit their organisation’s needs
It measures 4 different perspectives that are derived from an organisation’s vision and strategy
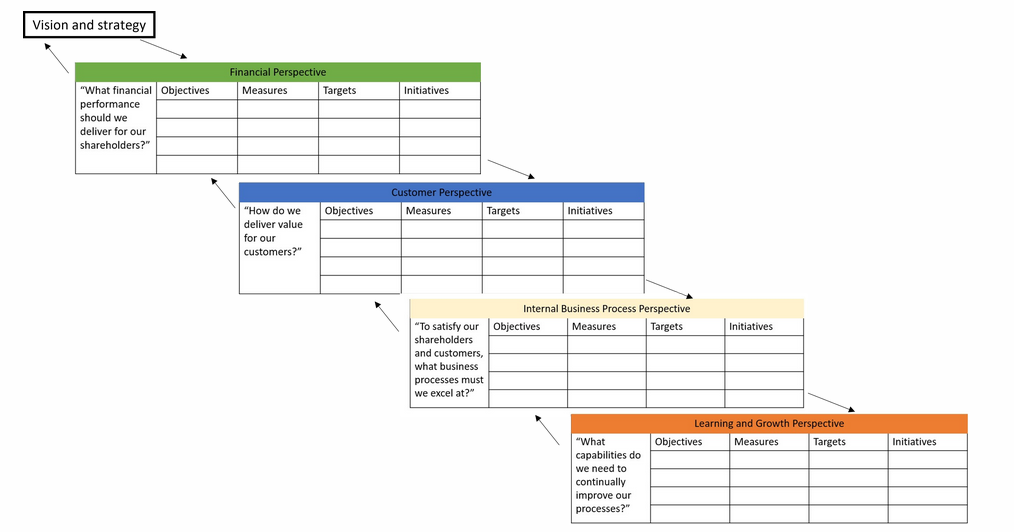
Steps to building a balanced scorecard
Step 1: Conduct SWOT analysis to provide strategic recommendations:
Step 2: Based on strategic recommendations/themes build a strategy map that links together objectives from all four perspectives
Step 3: Choose appropriate performance measures and targets to include under each perspective
Step 4: Choose initiatives to carry out strategic recommendations
Example:
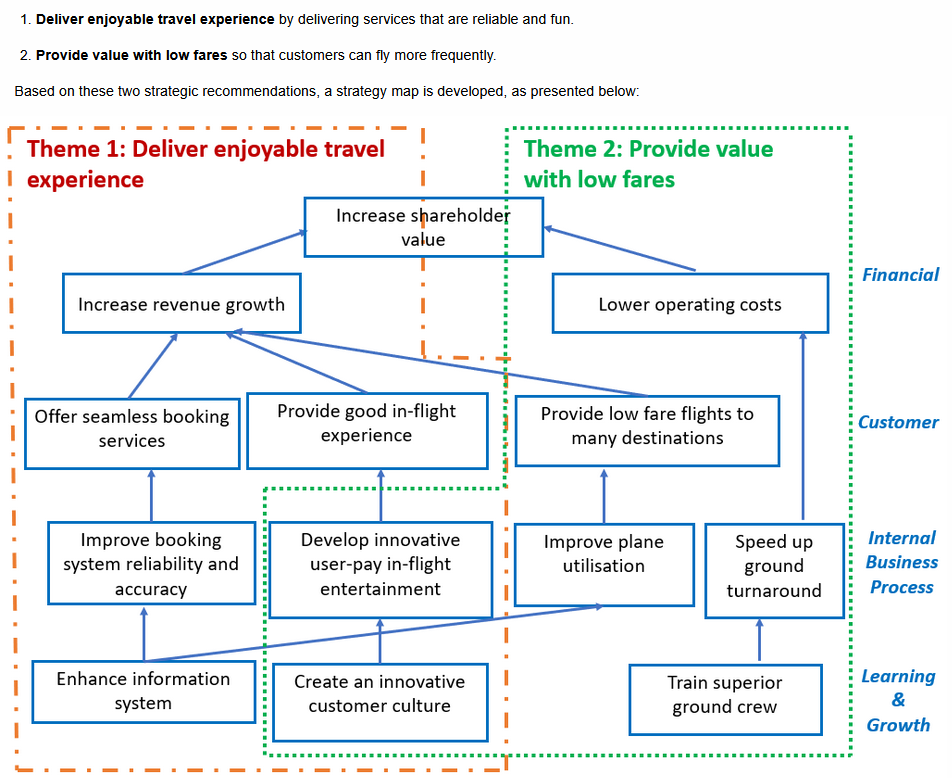
Each box in the strategy map represents an objective, e.g., doing or achieving. Strongly recommended objectives are framed by using a verb
The strategy map tells the story of each strategic theme by linking objectives in each perspective
To achieve theme 1 Jetstar will:
need to deliver value to customers by (1) offering seamless booking services and (2) providing a good in-flight experience.
To satisfy customers’ needs, Jetstar excels at (1) improving the reliability and accuracy of its booking system and (2) developing innovative in-flight entertainment
Therefore it’s important for Jetstar to (1) enhance its information system and (2) create an innovative culture among its workforce.
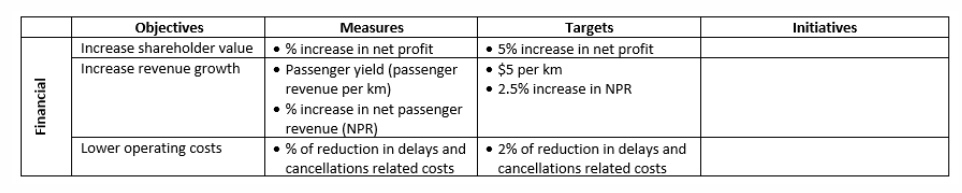
Strategy Map to Balanced Score Card
Use objectives from the strategy map to determine measures, targets and initiatives for each objective
A good balanced scorecard needs to have measures that are specific to its organisation and industry, it also has targets that match its corresponding measures
Customer perspectives
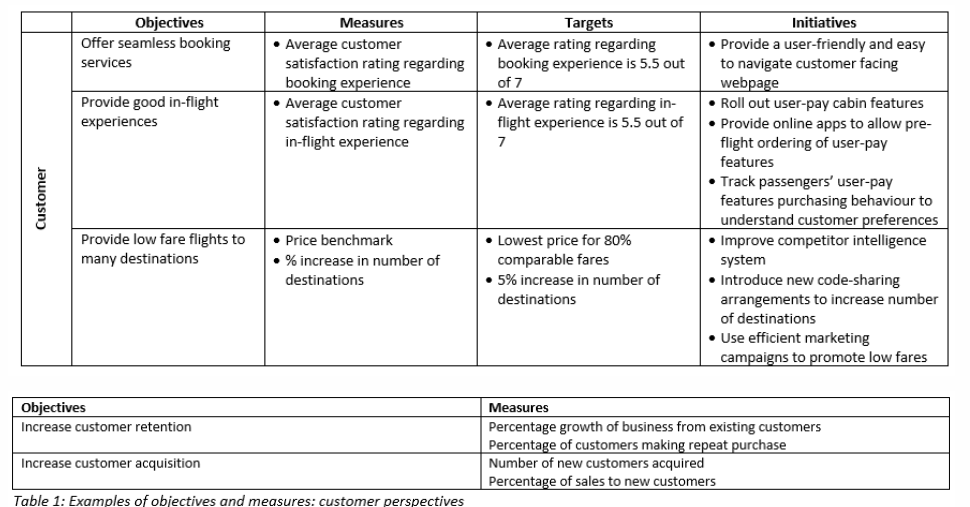
first two objectives focus on customers’ experiences, ratings from customer surveys can be suitable measures. We use two measures to capture two aspects of the third objective: low fares and the number of destinations
identify initiatives for each objective. Initiatives are actions which organisations take in order to achieve their objectives and which can often be traced back to specific value chain activities
one initiative or action Jetstar can take is to use efficient marketing campaigns, a sales and marketing activity, so that target customers are aware of the low fares.
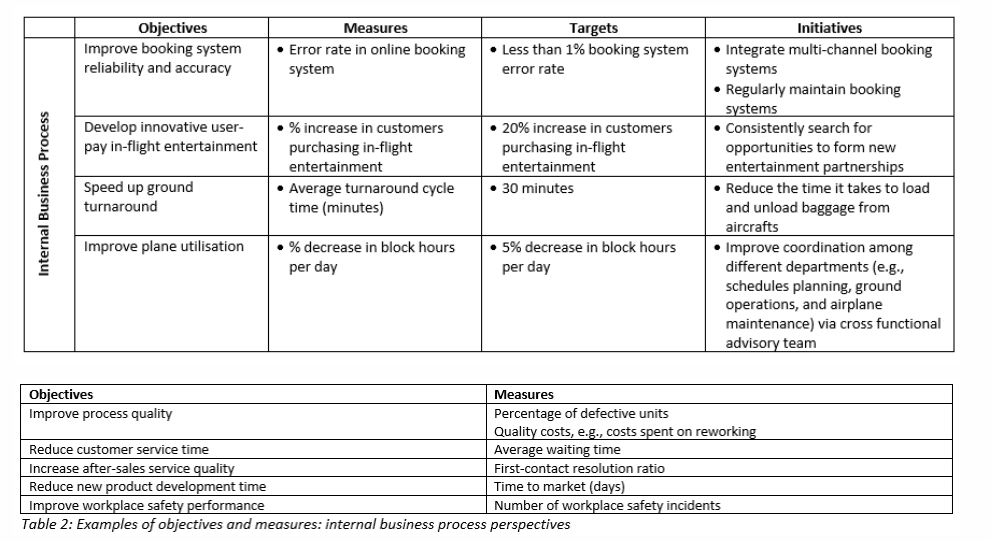
Internal Business Perspective (IBP)
Typically focuses on identifying an organisation’s core business processes, which are needed for creating customer/shareholder value and thus for achieving customer and financial objectives
Organisations can focus on one or several of the processes, such as:
Operations management processes are the basic day to day procesess that produce and deliver existing products and services to customers. The objectives for these are: to increase process quality, increase process efficiency and reduce process time
Customer management processes provide critical and responsive services to customers. Price, quality, availability, and functionality are criteria considered under these processes to ensure the desired outcomes of retention and acquisition of customers, as well as sales growth
Innovation processes allow management to anticipate emerging and potential customer needs and develop new products and services to satisfy them.
Regulatory and social processes enable organisations to meet the expectations of different stakeholders. As a minimum, organisations need to comply with regulations governing the environment, employee health and safety, and employment practices to avoid litigation and shutdown. Many organisations seek to go beyond mere compliance and enhance their reputations via community investment.
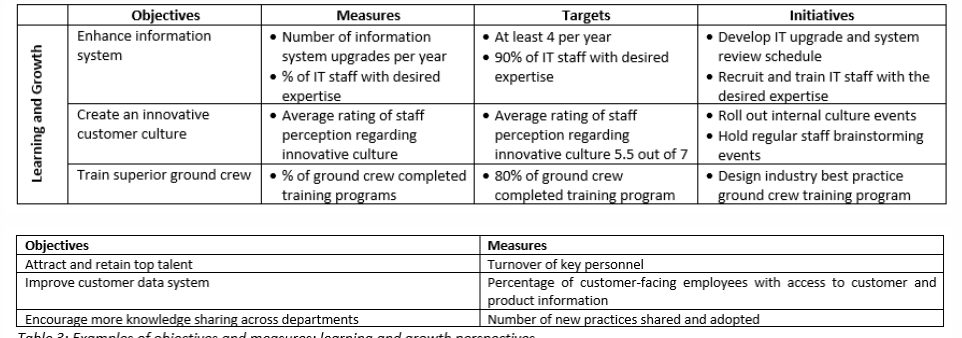
Learning and Growth Perspective
identifies capabilities that enable an organisation to accomplish objectives in the other 3 perspectives.
3 Components within the learning and growth perspective
Human capital (skills, knowledge of employees)
International capital (Information systems, databases and networks)
Organisational capital (org culture, goal alignment between employees and orgs, teamwork)
Example of a good scorecard
good Balanced Scorecard should have a balance (1) between lead and lag measures, (2) between objective and subjective measures, and (3) across the four perspectives. Additionally it has to include measures specific to an industry
in Jetstar’s Balanced Scorecard, there is a reasonable balance across four perspectives in terms of the number of measures for each perspective. Ex:

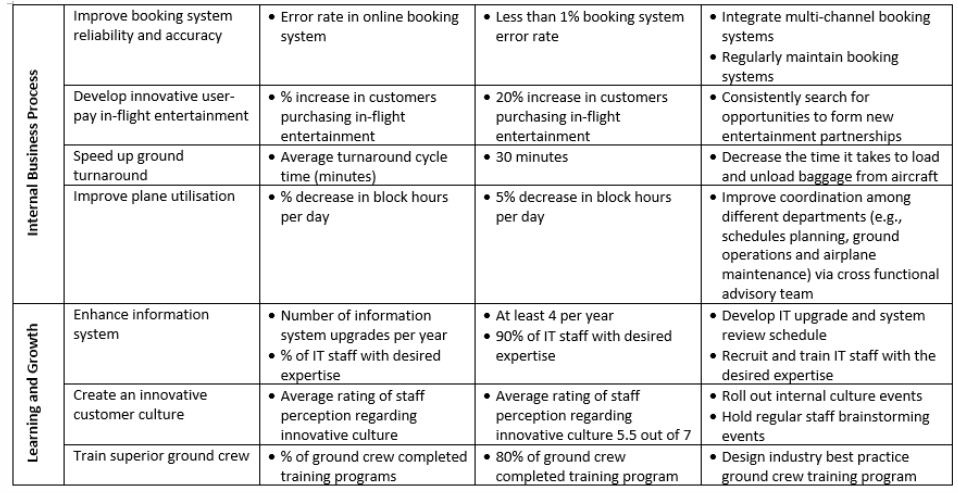
A good Balanced Scorecard should communicate an organisation’s strategy. Objectives should be linked between the four perspectives to show a cause-and-effect on how an organisation can create value, starting from learning and growth perspectives and ending with the financial perspective
Lag and Lead measures
lead measures are indicators of performance that might predict future success
For example, the number of information system upgrades per year is a performance indicator of information system quality. If we consider it as a lead measure, the corresponding lag measure will be the error rate in the online booking system, because more frequent system upgrades will result in reduced error rate, which is captured by the lag measure.
Shareholder Value
Organisations need shareholder value to evaluate whether strategies are successful, support better strategic decisions, motivate managers to focus on long-term value creation, and help investors assess the organisation’s ability to create value.
Traditional accounting measures of shareholder value
Traditionally the most common measure is focused on the organisation’s share price and sought to determine the increase in shareholder wealth from one period to the next based on appreciation of shares or dividends
Common examples include ROI, ROE, EPS
However these measures are:
subject to manipulation as managers can choose between alternative accounting methods to maximise profit
reflect past performance and do not capture future performance.
ignore the time value of money and cost of capital (not deducted)
do not consider business (nature of operations) and financial risk (proportions of debt to equity)
alternative measure that is based on accounting information but addresses one of the shortcomings of traditional accounting measures, is the residual income measure (net income minus an imputed interest charge)
imputed interest rate is the rate of return expected from investments, and it may be based on the organisation’s weighted average cost of capital.
Value based management performance measures of shareholder value
Contemporary value-based management performance measures have been introduced to address several of the limitations of traditional accounting measures.
these measures use some form of discounted cash-flow technique to assess how strategy impacts on shareholder value
Examples are: EVA (economic valuie added), CVA (cash value added), CFROI (cash flow return on investments), SVA (share value added) and MVA (market value added)
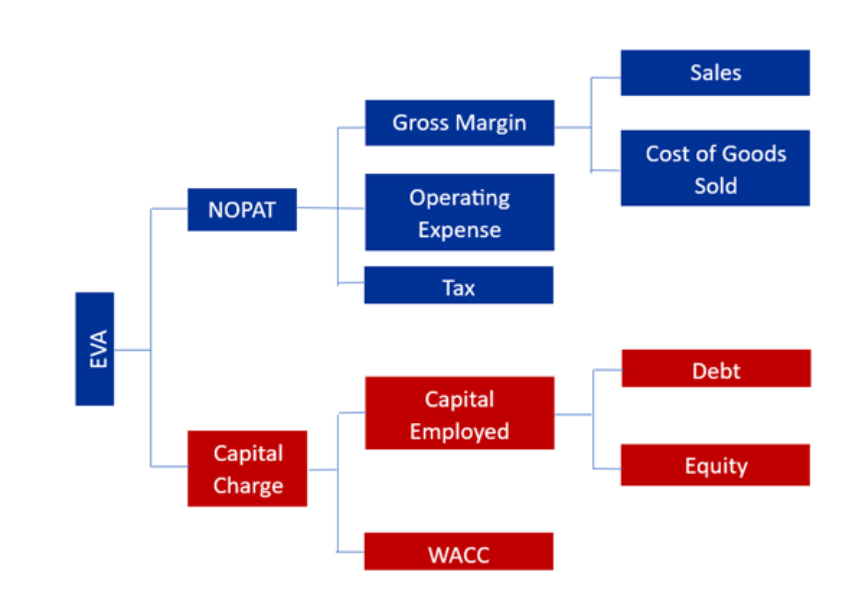
Economic Value Added
measures whether a firm creates shareholder value by comparing profit to cost of capital, value is created when profit exceeds cost of capital and destroyed when profit is below the cost of capital
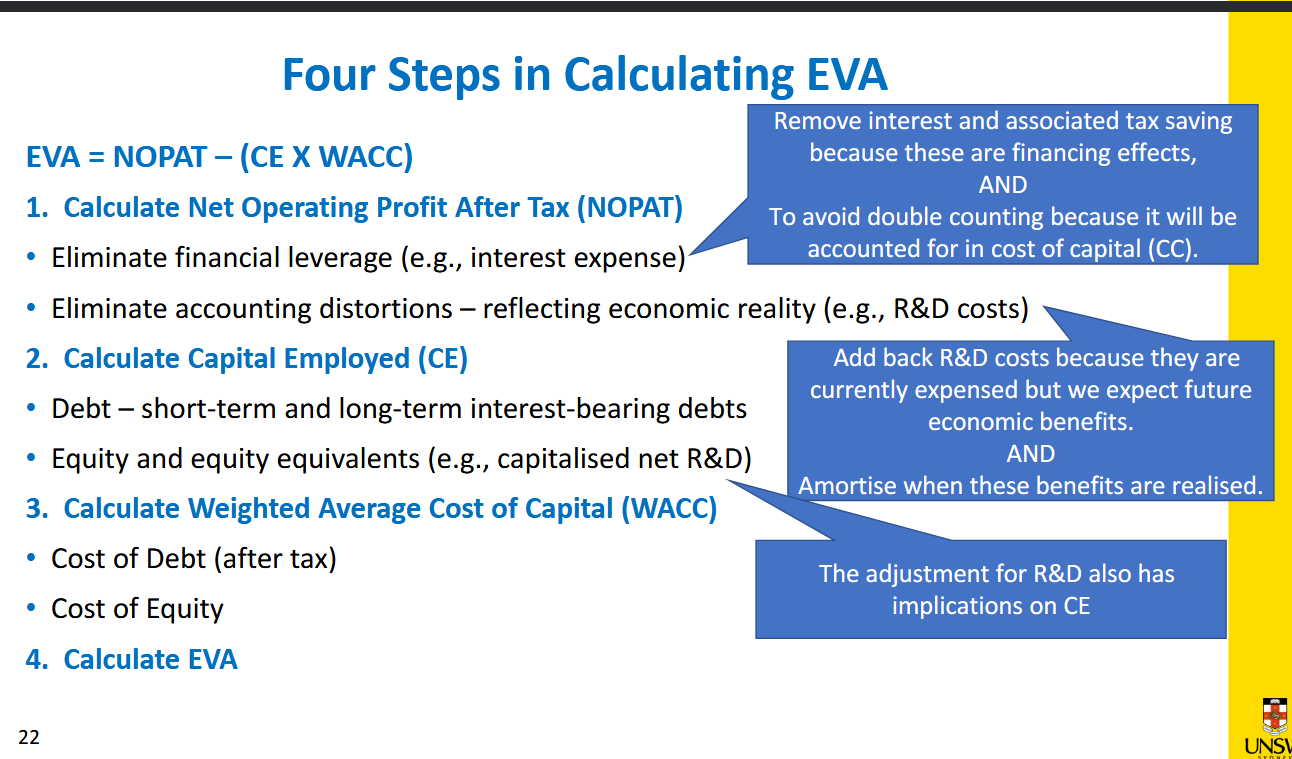
EVA is calculated by:
EVA = NOPAT - Capital Change / NOPAT - (Capital Employed * WACC)
where:
NOPAT: total profits available to provide a return to those who provided capital to the firm, after taxes but before financing and non cash bookkeeping entries
Capital Charge = (Capital Employed X Cost of Capital): fee charged to a firm to compensate investors for the riskiness of the business, given the amount of capital invested.
Capital Employed (also Invested Capital): Economic capital invested in a firm which is calculated: (i) sum of interest-bearing debt and total equity, and (ii) the sum of net assets less noninterest-bearing current liabilities
WACC: minimum rate of return on capital required to compensate debt and equity investors for bearing risk. Usually measured as the weighted average of cost of equity (i.e., the opportunity return from an investment with the same risk as the firm) and the cost of debt (which includes the tax shield due to the tax deductibility of interest).
Given the large number of possible adjustments, Stern Stewart recommends making an adjustment only when four criteria are met as follows:
The amounts are significant.
Managers can influence the outcome of the item being adjusted.
The required information is readily available.
Non-financial professionals, especially operations staff, can understand them
Financing approach in calculating EVA
Calculate NOPAT
Calculate Capital Employed (CE)
Calculate Weighted Average Cost of Capital (WACC)
Calculate EVA
Calculating NOPAT
calculation of EVA involves adjustments to accounting profit in order to obtain NOPAT, as well as corresponding adjustments to capital employed
NOPAT adjustments are generally made to (i) remove the effects of financing decisions from operating results, and (ii) eliminate potential distortions introduced by accounting rules (avoids double counting)
Eliminating financial leverage
aims to eliminate the effect of taking on debt to finance its operations. This involves removing interest expense from net profit after tax (NPAT), resulting in the profit that would have been reported had a firm’s operations been solely financed by equity.
Eliminating accounting distortions
Adjustments remove accounting distortions so profits and capital reflect economic reality (cash-based measures). (See Next Flashcard)
This better reflects the true economic value of R&D investment.
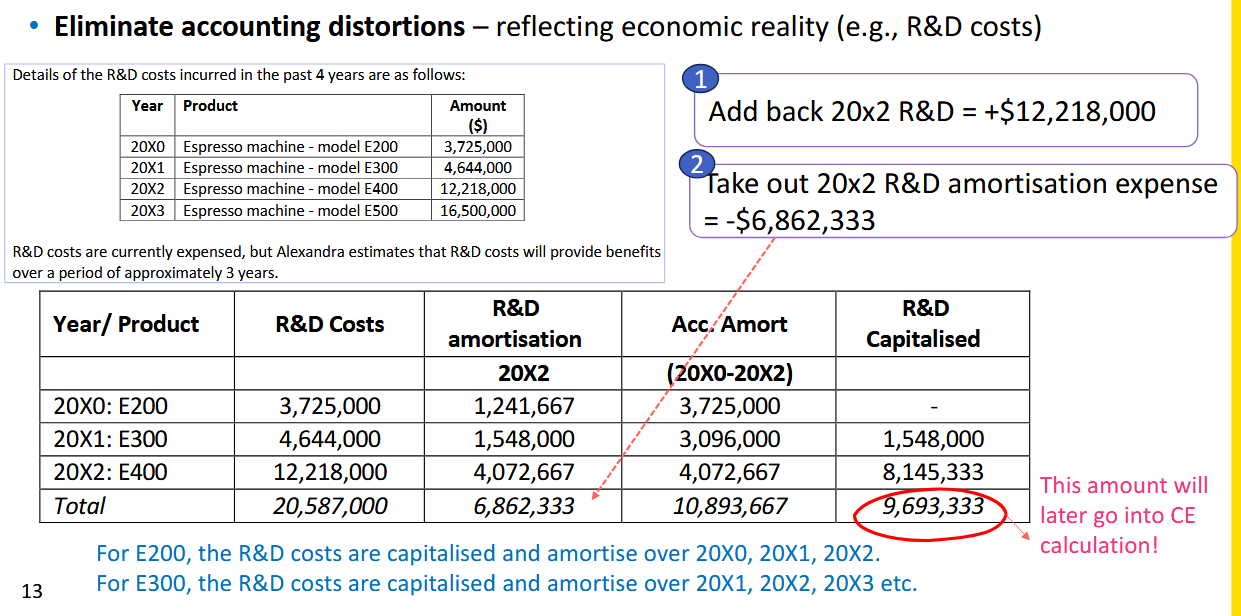
NOPAT = NPAT + Interest expense (after tax) + R&D expense − R&D amortisation
EVA: Eliminating accounting distortions, R&D Adjustment
Why adjust R&D? R&D provides benefits over multiple years, so expensing it immediately distorts profit. We capitalise it instead to reflect economic reality.
Adjustments remove accounting distortions so profits and capital reflect economic reality (cash-based measures)
Step 1 — Annual Amortisation per project
R&D Cost ÷ Useful life (years) = amortisation per year
Step 2 — Accumulated Amortisation
Annual amortisation × years elapsed so far
Step 3 — Net Capitalised R&D
Original R&D cost − Accumulated amortisation
Calculating total capital employed
Total capital employed is the sum of a firm’s sources of capital which are committed by debt and equity investors
Debt includes interest bearing short term and long term debts along with capitalised lease obligations (we are only concered with interest bearing debt)
Equity comprises (i) owner’s equity as reported , which includes share capital and retained profits, and (ii) equity equivalent adjustments (R&D costs, benefits that are yet to be consumed)
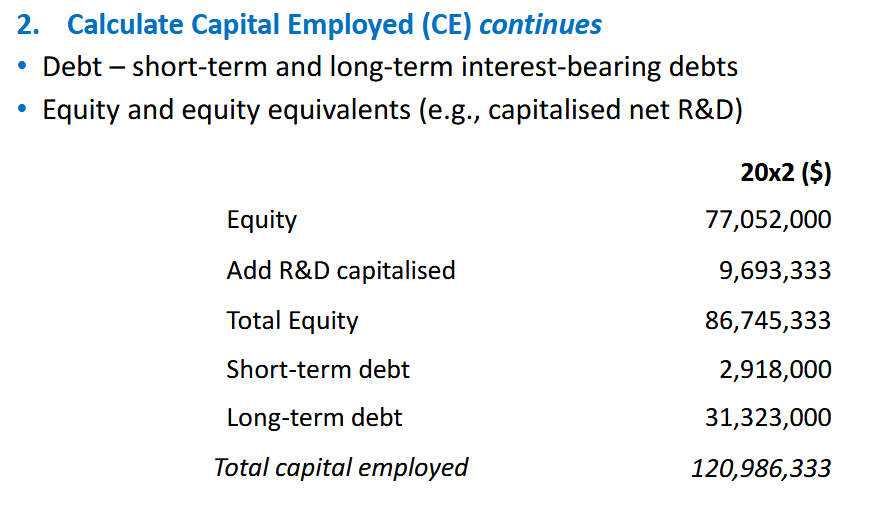
CE = Equity + R&D Capitalised + Short-term debt + Long-term debt
Calculating WACC
The weighted average cost of capital (WACC) is the cost of capital – the minimum acceptable return on investment, it is measuring the composite returns expected by the firm’s investors, and is calculated by taking the weighted average of debt and equity.
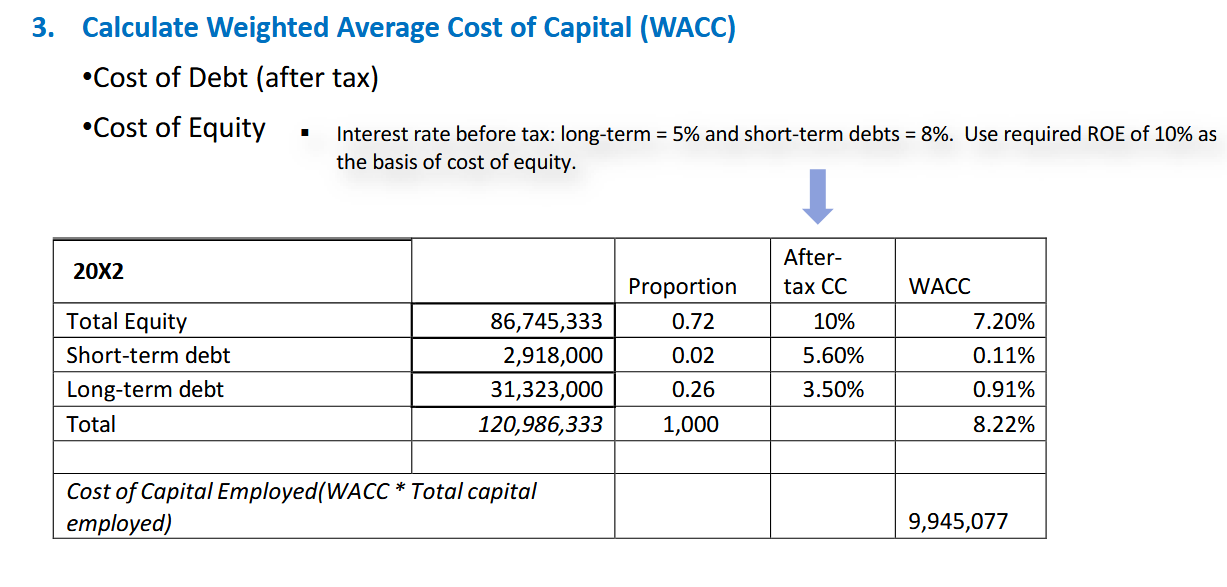
Workings for WACC using long-term debt as an example:
1) Calculation of proportion of long-term debt = long-term debt /CE (from Step 2) = 2918000/120986333 = 0.0241
2) Calculation of cost of long-term debt, net of tax (because interest expenses are tax-deductible) = 5% * (1- Tax Rate) = 3.5%
3) Calculation of the component of WACC relating to long-term debt = 3.5% * 0.26 = 0.91%
Summary and EVA Calculation
EVA Calculation:
EVA = NOPAT – (CE X WACC)
Advantages of EVA
EVA offers a method of seeing and understanding what is really happening to the performance of a business
Creates one financial statement that includes all the costs of being in business, including the carrying cost of capital, allowing a complete picture between capital, margin and EVA
EVA directs managers’ attention to creating shareholder value by focusing on how capital is used, and the cash flows generated.
As adjustments eliminate accounting distortions to reflect cash flows from operations, managers spend their time increasing shareholder value rather than engaging in earnings management.
EVA is very versatile as it is not just another number, but rather a philosophy that can be applied to decision-making and performance evaluation at all levels.
can be used to assess the true profitability resulting from many different types of decisions (e.g., capital budgeting, strategic, and tactical) for an entire firm / business units
can be used to evaluate performance, and the compensation plans of managers and employees.
Limitations of EVA
EVA is criticized to be a short-term performance measure.
EVA only informs about current performance but not about future performance. it underestimates returns in early stages of a long-term investment and it ignores returns at the end of the life of the investment. EVA is unsuitable for growing firms (in contrast to mature firms) that have invested heavily today and expect positive cash flow only in the distant future.
EVA does not account for growth opportunities and thus encourages underinvestment.
Unlike the market value of a firm’s securities that reflect the market’s perception of the value of growth opportunities, EVA does not account for real options (i.e., growth opportunities) inherent in investment decisions.
To calculate EVA, a large amount of work and expertise is required to translate accounting data into economic information.
many EVA adjustments vary in complexity. Accountants need to know appropriate adjustments for specific firms and industries and apply them correctly. Otherwise, the accuracy of final EVA will be negatively affected.
An inaccurate opportunity cost of capital or WACC may be used in calculating EVA
EVA cannot be applied accurately in some situations (inflation varies widely, large amount of long-term investments, constant changes in reserves such as in energy). Moreover, some critics of EVA claim it should not completely replace accounting profit measures
Market Value Added (MVA)
MVA is a multiple period measure, it is a cumulative measure of corporate performance that captures the welath that a firm has created for it’s shareholders since incorporation
MVA is the difference between market value of a firm and the economic value of capital it employs, showing the difference between the cash that debt and equity investors provide to the firm and the cash they can take out if they exit today at market price
MVA = [(shares outstanding X stock price) + (market value of preferred stock + market value of debt)] – total capital\
MVA is based on the market value of a firm’s securities,reflecting the market’s expectations of future opportunities for the firm. In theory, a firm’s MVA at a given point in time is equal to the discounted present value of the yearly EVA it is expected to generate. The change in MVA from one financial year to the next is equivalent to the EVA for that period. If EVA is positive for the period, MVA will increase. If EVA is negative for the period, MVA will decrease.
Shareholder Value Added (SVA)
the difference between the corporate value of a firm and the market value of debt
Shareholder value = Corporate value – Market value of debt
Corporate value of a firm: Present value of net cash flows from operations during the forecast period (e.g., 5 years) + Residual value of the business at the end of the forecast period.
EVA as a framework
EVA provides a framework to enable decision makers to assess the impact of different types of decisions at various levels (e.g., firm and business unit) on shareholder value
By way of example, there are strategic decisions, including acquisitions, mergers and day-to-day operational type decisions involving trade-offs.
To enable decision makers to identify and select strategies that will create the highest shareholder value, the impact of a strategy on shareholder value can be assessed from the earliest stages of strategy formulation
Increasing EVA can come in the form of
Improve profitability without employing additional capital
Invest in additional capital that can generate profits which are in excess of the cost of employing the additional capital
Withdraw capital from businesses by selling assets as long as any resulting loss in profits is less than the savings on the capital charge
Using EVA to estimate shareholder value created by a specific strategy or decision involves looking at how the strategy or decision will affect the drivers of EVA. Such EVA value drivers are obtained through the components of the EVA formula
Improving profitability without employing additional capital
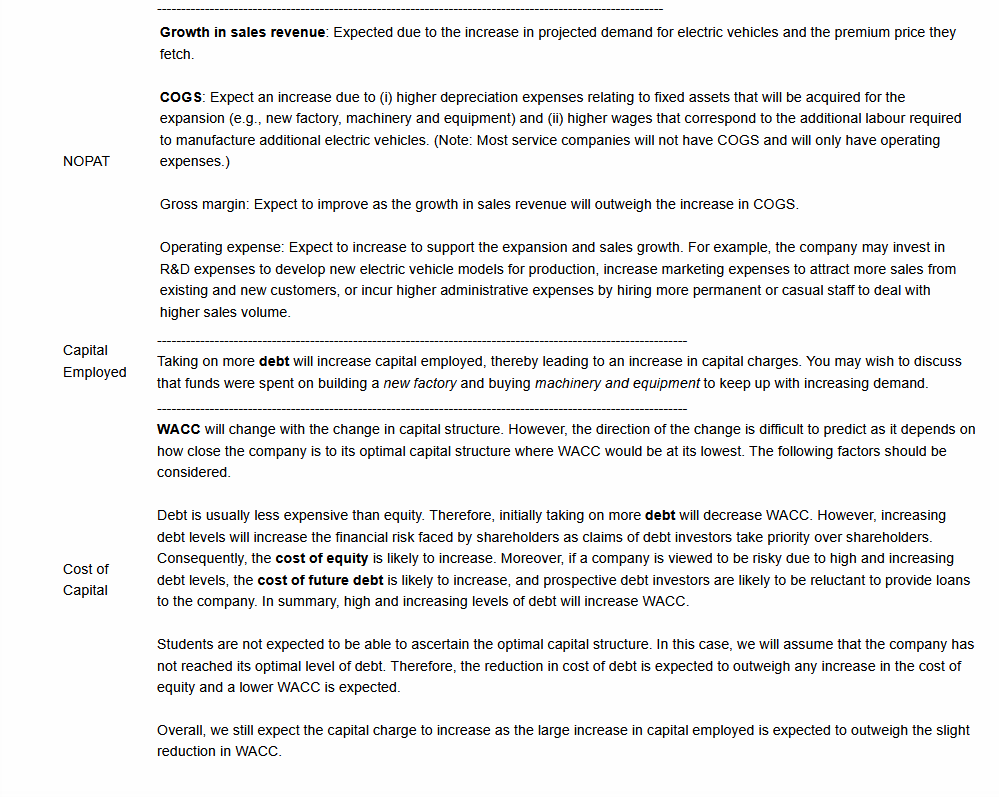
Profitability can be improved by management decisions or strategies that affect the value drivers (Sales, COGS, Operating Ex) relating to NOPAT, reflecting a more effective use of exsisting capital
Invest in additional capital that can generate profits which are in excess of the cost of employing the additional capital
usually increase profit through investing in additional assets, which are financed by taking on additional debt or issuing additional shares. Each improvement initiative, therefore, affects several value drivers simultaneously across various components of EVA.
For example, a car manufacturer may decide to expand its operations by building a new factory to ramp up the production of electric vehicles by 40% to meet a projected increase in demand. Customers are willing to pay a premium for these electric vehicles. The CEO plans to fund the new factory and the purchase of required machinery and equipment by taking on more debt
Withdraw capital from businesses by selling assets
usually involve a company divesting businesses or product lines which are loss-making or generating returns that are lower than the company’s required cost of capital. This involves selling off fixed assets (e.g., factory, machinery or equipment) and using the cash obtained to pay off debt or buy-back shares.
For example, a car manufacturer could streamline its operations by stopping the production of loss-making motorcycles, sell off the machinery and equipment relating to motorcycles, and use cash received to pay off debt. The decision to stop producing loss-making motorcycles would improve NOPAT as losses are no longer generated from selling motorcycles. In addition, paying off debt will reduce capital employed. Although the reduction in the proportion of debt may result in a slight increase in WACC as debt is cheaper than equity, we expect an overall reduction in the capital charge as the reduction in capital employed is more than expected to outweigh the slight increase in WACC.
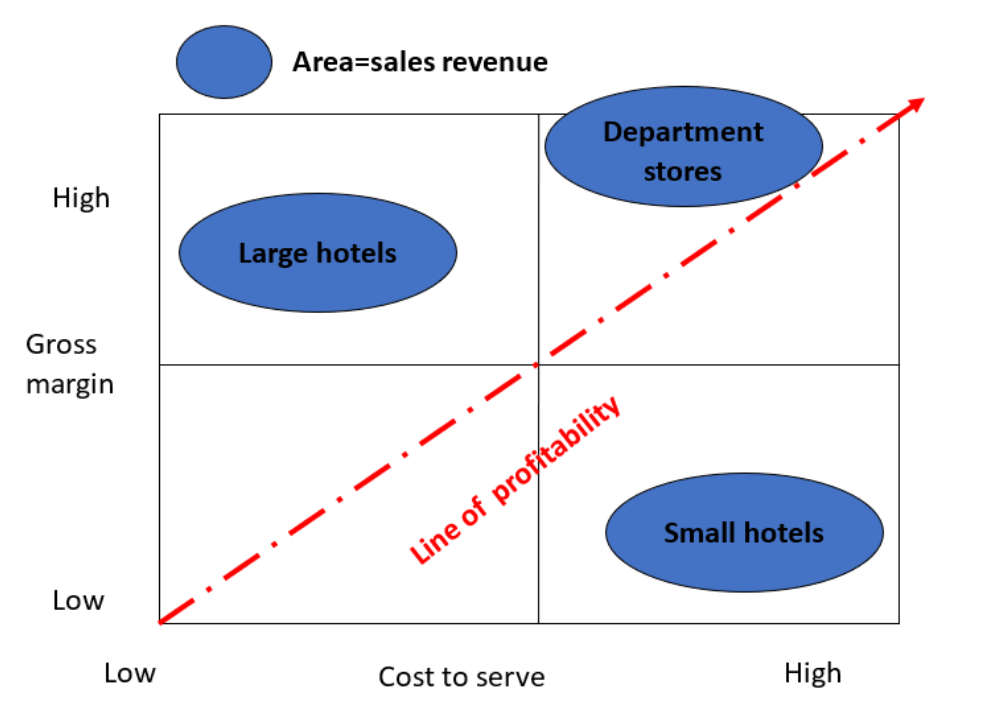
Customer Profitability Analysis (CPA) Framework
uses historical accounting information to measure an individual customer’s, or a customer group’s, profitability
helps organisations to classify customers based on
how much gross margin is generated by an individual customer / customer group
the costs incurred to serve an individual customer or customer group.
provides insights into how to manage different types of customers to derive greater value from customers
Customer Lifetime Value (CLV) Framework
more long-term focused framework using the discounted future cash flow method to assess a customer’s profitability during its entire relationship with an organisation (i.e., its life-cycle).
Gross Margin for customer group
First, in order to claculate customer profitability for each customer group, calculate the gross margin for each customer group, this is done by:
Gross Margin = (Selling Price - Discounts or Allowances) - Manufacturing Costs
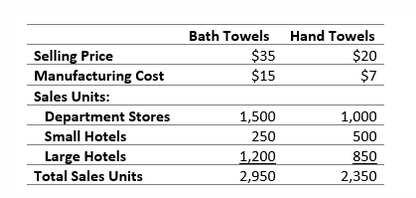
General Formula: (Selling Price - Manufacturing Costs) x Sales Units
Department Stores: $20 x 1,500 + $13 x 1,000 = $43,000
Small Hotels: $20 x 250 + $13 x 500 = $11,500
Large Hotels: $20 x 1,200 + $13 x 850 = $35,050
Approaches for allocating SG&A to different customer groups
Net revenue approach
a “volume based” approach which allocated SG&A costs based on some measures of sales volume, e.g: no of nits sold to each customer group / sales revenue
Allocate SG&A expenses based on net revenue, the assumption is that SG&A will vary proportionally with sales and therefore vary by type and volume of products bought by customers
Activity-based costing approach (ABC Approach)
Net Revenue Approach for SG&A
First calculate the sales revenue each customer group generates as a percentage of the total sales revenue.
For example, department stores generate 48.25% ($72,500 / $150,250) of total sales revenue. Therefore, allocate 48.25% of SG&A costs or $22,939 to department stores as a customer group
The last step is to calculate net profit by subtracting allocated SG&A costs from gross margin: $43,000 - $22,939 = $20,061
Results based on the net revenue approach are only reliable if customers consume SG&A activities in proportion to sales revenue
ABC Approach
Calculate the cost per activity driver
Total activity cost / the total number of activity drivers
For instance, the cost per activity driver for processing sales order is $50 per sales order ($10,000/200 = $50)
Next allocate the costs of processing sales orders to each customer group based on the number of activity drivers (i.e., number of sales orders) that they consumed
E.G: Department stores $50 * 48 = $2,400
Small hotels $50 * 100 = $5,000
Large hotels $50 * 52 = $2,600
ABC approach is more accurate as customers do not consume activities in proportion to sales revenue, violating the key assumption of the net revenue approach
Classifying customers
First step to manage customer profitability
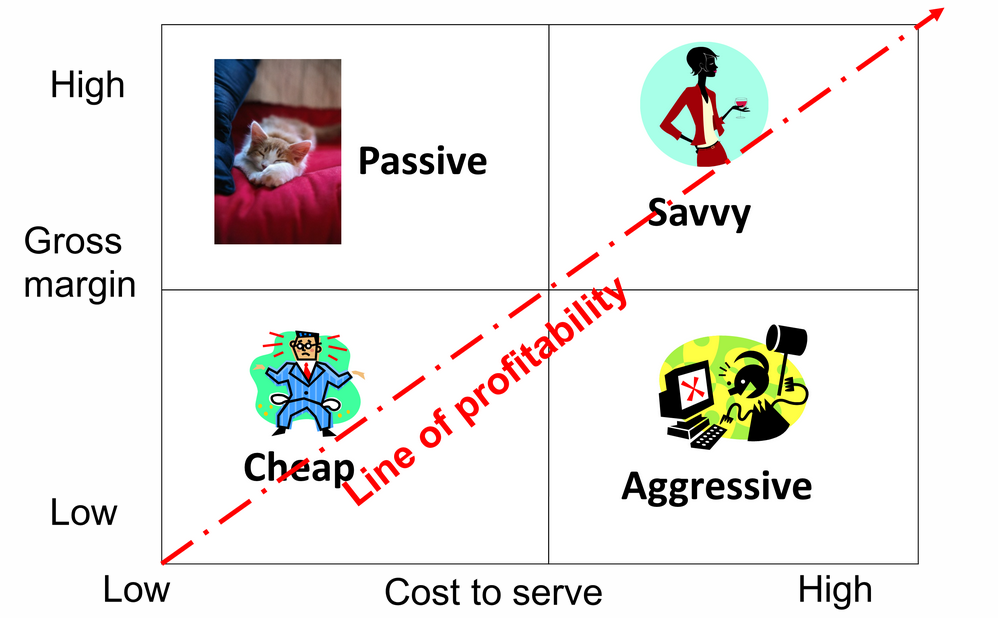
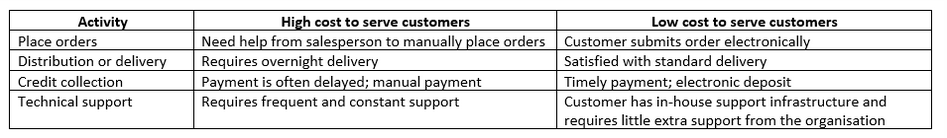
Passive customers: generate high gross margin and have low cost to serve
Savvy customers: generate high gross margin and have high cost to serve.
Cheap customers: generate low gross margin and have low cost to serve.
Aggressive customers: generate low gross margin and have high cost to serve
Positioning of each customer group in the matrix requires a degree of judgment and it is often helpful to refer to the relative position of one customer group to the other. To classify the three customer groups of D-Adam Towels, we calculate their relative gross margins and the cost to serve
Passive customers
ideal type of customers as they purchase high gross margin products, and they have low cost to serve. Therefore, organisations must exert efforts to retain passive customers.
initiatives to enhance customer loyalty – offering some discounts or special services might be viable options
Importantly, although these customers consume relatively few resources, there may still be opportunities to reduce the cost of serving these customers
Examining each type of SG&A activity to determine whether a passive customer consumes a higher proportion of a given activity than other customers.
Savvy customers
Buy high-margin products AND have low service requirements — the ideal customer type.
Strategy — retain and optimise:
Prioritise retention through loyalty initiatives (discounts, special services)
Don't assume cost to serve is already minimised — review each SG&A activity individually
If a passive customer consumes a disproportionately high share of any specific activity, investigate the root cause and reduce it further
Key point: Just because they are already profitable doesn't mean there's no room for improvement.
Aggressive customers
Buy low-margin products AND have high service requirements — by definition unprofitable (sit below the profitability line).
Strategy:
Encourage purchase of higher-margin products to increase gross margin
Reduce cost to serve by cutting unnecessary SG&A activity consumption
If unsuccessful → follow the 4-step unprofitable customer management process
Managing unprofitable customers 4 Steps
1. Reassess the relationship Understand why the customer is unprofitable — have their needs changed, or are they just unaware of what you offer?
2. Educate the customer Fill knowledge gaps so customers can use your products/services more efficiently, reducing the resources they consume.
3. Renegotiate Adjust pricing, discounts, or introduce menu-based pricing so the relationship becomes profitable for both sides.
4. Terminate (last resort) End the relationship only if all else fails — beware of consequences:
Fixed costs shift to remaining customers
Loss of feedback/innovation sources
"Sacked" customers may go to competitors
Limitations of CPA
CPA has key limitations that reduce its usefulness as a standalone tool:
Static — only captures a single period snapshot of profitability
Historical — based on past data, not forward-looking
Ignores change over time — does not account for how customer profitability may evolve in the future
Solution: Use the Customer Lifetime Value (CLV) framework alongside CPA to account for how customer profitability changes over time
Customer Lifetime Value (CLV) Framework
The present value of all cash flows gained from a customer for the entire duration of the relationship.
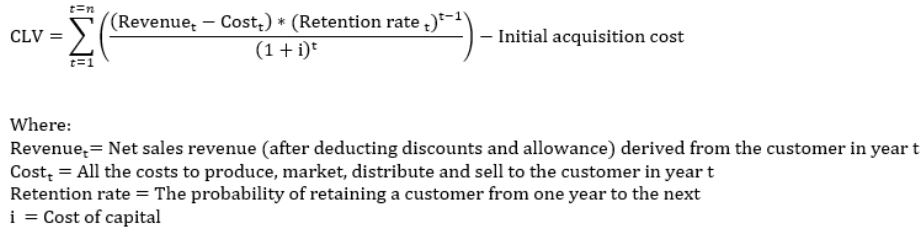
Key ideas:
New customers often appear unprofitable early on due to high acquisition costs — CLV accounts for this
The formula compares discounted future net cash flows against the initial acquisition cost
Organisations must forecast how customer demand changes over time, not just across products (as CPA does)
Why it matters: Some organisations (e.g. banks) deliberately accept early losses on new customers, betting on long-term profitability as the relationship matures — CLV helps justify and evaluate these decisions.
Limitations of CLV Framework
CLV is forward-looking (based on projected future cash flows) which introduces key limitations:
Estimation errors — all future-oriented frameworks rely on projections, which are inherently uncertain and subject to error
Hard to measure components — some inputs (e.g. initial acquisition cost) are difficult to measure precisely in practice. For example, advertising spend reaches both new and existing customers, making it hard to isolate how much was spent on acquiring vs retaining customers
Key contrast with CPA:
CPA is limited because it is too historical
CLV is limited because it is too forward-looking