Ecology Exam 1
4.7(6)Studied by 160 people
Card Sorting
1/111
Earn XP
Description and Tags
Last updated 3:55 AM on 1/27/23
Name | Mastery | Learn | Test | Matching | Spaced | Call with Kai |
|---|
No analytics yet
Send a link to your students to track their progress
112 Terms
1
New cards
Ecology
The study of the interactions of organisms with one another and with their environment
The study of the distribution and abundance of organsism
The study of the distribution and abundance of organsism
2
New cards
Evolution
Change in population’s gene pool over time
\
science of the origins of biological diversity and its distribution
\
science of the origins of biological diversity and its distribution
3
New cards
Ecological systems
1) individual
2) population
3) community
4) ecosystem
5) biosphere
2) population
3) community
4) ecosystem
5) biosphere
4
New cards
Individual
most fundamental unit of ecology
5
New cards
species
individuals that are capable of interbreeding or share genetic similarity
6
New cards
Population
individuals of the same species living in a particular area and interbreeding.
7
New cards
characteristics of populations (not individuals)
*Geographic range (distribution)*
*Abundance*
*Density*
*Change in size*
*Composition (demography)*
*Abundance*
*Density*
*Change in size*
*Composition (demography)*
8
New cards
Community
Populations of species living together in a particular area.
9
New cards
Ecosystem
one or more communities of living organisms interacting with their nonliving physical and chemical environments. ( community+ physical and chemical environment= ecosystem)
10
New cards
Biosphere
all ecosystems on earth
11
New cards
Individual approach
Understands how **adaptations**, or characteristics of an individual’s morphology, physiology, and behavior enable it to survive in an environment.
12
New cards
Populations approach
Examines variation in the number, density, and composition of individuals over time and space.
13
New cards
community approach
Understands the diversity and interactions of organisms living together in the same place.
14
New cards
ecosystem approach
Describes the storage and transfer of energy and matter.
15
New cards
Biosphere approach
Examines movements of energy and chemicals over the Earth’s surface.
16
New cards
Darwin’s 4 postulates
1. Individuals vary in their traits.
2. Traits are heritable.
(More offspring are born than survive)
3\. Variation in traits causes some individuals to experience higher *fitness* (survival and reproduction).
17
New cards
Producers
or autotrophs—convert
chemical energy into resources.
chemical energy into resources.
18
New cards
consumers
or heterotrophs—obtain their energy from other organisms.
19
New cards
Mixotrophs
can switch between being producers and consumers.
20
New cards
Scavengers
consume dead animals
21
New cards
Detritivores
break down dead organic matter (i.e., detritus) into smaller particles.
22
New cards
Decomposers
break down detritus into simpler elements that can be recycled.
23
New cards
types of species interactions
* predation
* parasitism
* herbivory
* competition
* mutualism
* commensalism
* parasitism
* herbivory
* competition
* mutualism
* commensalism
24
New cards
predation
when an organism kills or consumes an individual
25
New cards
parasitism
when one organisms lives in or on another organism.
26
New cards
competition
when two organisms that depend on the same resource have a negative effect on each other.
27
New cards
mutualism
when two species benefit from each other
28
New cards
commensalism
when two species live in close association and one receives a benefit, whereas the other is unaffected.
29
New cards
Habitat
the place, or physical setting, where an organism lives.
Distinguished by physical features, such as dominant plant type.
Distinguished by physical features, such as dominant plant type.
30
New cards
Niche
the range of abiotic and biotic conditions an organism can tolerate.
31
New cards
Hypothesis
ideas that potentially explain a repeated observation.
32
New cards
predictions
statements that arise logically from hypothesis
33
New cards
Nemoria experiment and results
butterfly experiment where different conditions were used to determine what causes different phenotypes.
Results: diet changes development
Results: diet changes development
34
New cards
Population approach
Examines variation in number, density, and composition of individuals over time and space
35
New cards
Spatial Structure
the pattern of density and spacing of individuals in a population.
36
New cards
Fundamental Niche
the range of abiotic conditions (e.g., temperature, humidity, salinity) under which a species can persist.(all possible options)
37
New cards
realized niche
the range of abiotic and biotic conditions under which a species does persist. (reality)
38
New cards
Geographic range
a measure of the total area covered by a population (e.g., temperature and drought define the range of sugar maple).
39
New cards
endemic
geographic range where species live in a single often isolated location
40
New cards
cosmopolitan
a measure of the total area covered by a population (e.g., temperature and drought define the range of sugar maple).
41
New cards
abundance
the total number of individuals in a population that exist within a defined area (e.g., total number of lizards on a mountain).
42
New cards
Density
in a population, the number of individuals per unit area or volume; calculated by dividing abundance by area.
43
New cards
Dispersion
the spacing of individuals with respect to one another within the geographic range of a population.
44
New cards
Clustered dispersion
when individuals are aggregated in discrete groups (e.g., social groups or clustering around resources).
45
New cards
Evenly spaced dispersion
when each individual maintains a uniform distance between itself and its neighbors (e.g., defended territories, croplands).
46
New cards
Random dispersion
when the position of each individual is independent of other individuals; not common due to non-random environmental heterogeneity.
47
New cards
Dispersal
the movement of individuals from one area to another.(verb of dispersion, actual movement)
48
New cards
Population abundance and range
Populations with high abundance also have large geographic ranges. (example: birds)
49
New cards
Population density and body size
The density of a population is negatively correlated to the body size of the species.
50
New cards
Dispersal limitation
the absence of a population from suitable habitat because of barriers to dispersal.
51
New cards
Habitat corridor
a strip of favorable habitat located between two large patches of habitat that facilitates dispersal (e.g., a narrow band of trees that connects forests).
52
New cards
Ideal free distribution
when individuals distribute themselves among different habitats in a way that allows them to have the same per capita benefit. (pizza example)
53
New cards
subpopulations
when a large population is broken up into smaller groups that live in isolated patches.
54
New cards
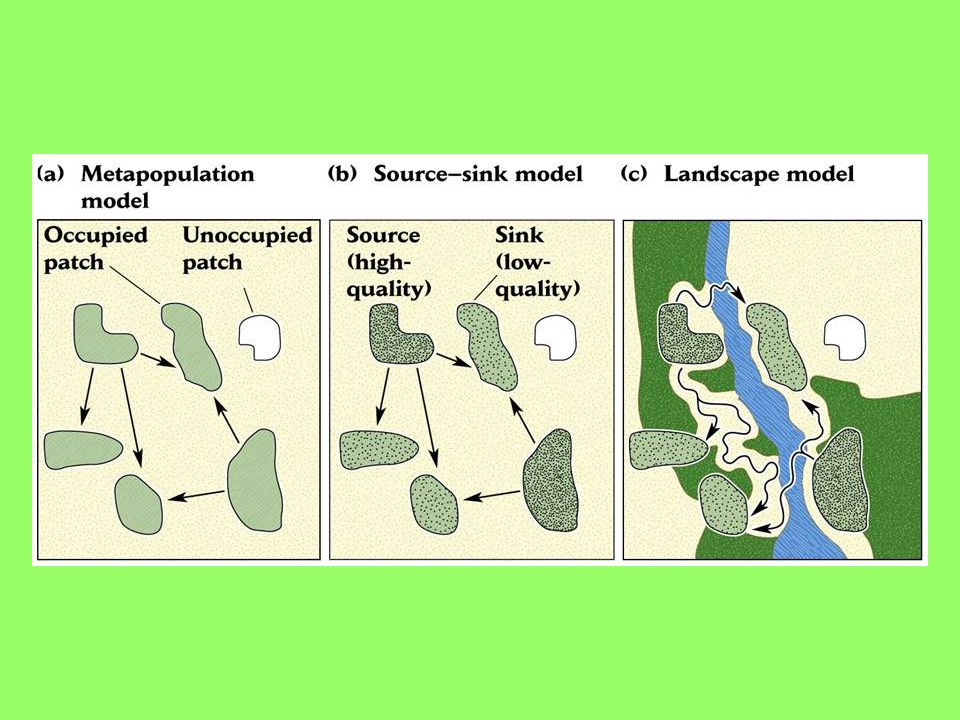
**Basic metapopulation model**
a model that describes a scenario in which there are patches of suitable habitat embedded within a matrix of unsuitable habitat; all suitable patches are assumed to be of equal quality.
55
New cards
Spatial structure models
* Metapopulation
* Source-Sink
* Landscape
* Source-Sink
* Landscape
56
New cards
metapopulation
a set of local populations linked by dispersal : least complex
57
New cards
patches
suitable habitat
58
New cards
Matrix
barrier to dispersal
59
New cards
Source sink model
recognizes differences in quality of suitable habitat patches: intermediate complexity
Source patches : more food reproduce more
Sink patches: less resources less reproduction
Source patches : more food reproduce more
Sink patches: less resources less reproduction
60
New cards
Landscape model
* most complex
* considers effects of differences in the habitat matrix:
* the quality of a habitat patch can be affected by the nature of the surrounding matrix
* some matrix habitats are more easily traversed than others
* considers effects of differences in the habitat matrix:
* the quality of a habitat patch can be affected by the nature of the surrounding matrix
* some matrix habitats are more easily traversed than others
61
New cards
demography
The study of (the structure and growth of) populations
62
New cards
What causes population increase?
birth and immigration
63
New cards
What causes population decrease
deaths and emigration
64
New cards
geometric growth
discrete time intervals (choppy points and lines)
65
New cards
exponential growth
time is treated as continuous (one smooth line no points). Continuous growth -- overlapping generations with year round reproduction
66
New cards
Geometric (discrete) growth
*N*(*t* + 1) = *N*(*t*)
where:*N*(*t* + 1) = number of individuals after 1 time unit
*N*(*t*) = population size at time *t*
where:*N*(*t* + 1) = number of individuals after 1 time unit
*N*(*t*) = population size at time *t*
67
New cards
N(t+1)
number of individuals after 1 time unit
68
New cards
N(t)
population size at time t
69
New cards
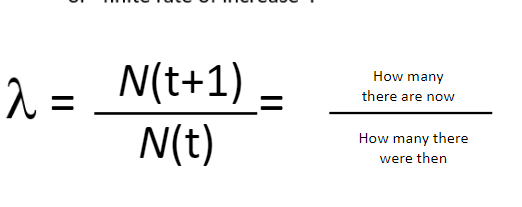
Geometric Population growth
**** = ratio of population size at any time to the population size 1 time unit earlier
**** is the “per capita growth rate” \n or “finite rate of increase”:
**** is the “per capita growth rate” \n or “finite rate of increase”:
70
New cards
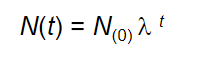
Geometric Population Growth for Multiple time intervals
\
71
New cards
Exponential population growth equation
Pe^rt
72
New cards
when a population is decreasing
λ
73
New cards
when population is constant
λ=1 and r=0
74
New cards
when a population is increasing
λ>1 and r>0
75
New cards
Density independent limitations
factors that limit population size regardless of the population’s density. Common factors include climatic events (e.g., tornadoes, floods, extreme temperatures, and droughts).
76
New cards
Density dependent limitations
factors that affect population size in relation to the population’s density.
77
New cards
negative density dependence
when the rate of population growth decreases as population density increases. The most common factors that cause negative density dependence are limiting resources (e.g., food, nesting sites, physical space). (think about splitting the pie, the more people the less pie each person gets)
78
New cards
Shelf-thinning curve
a graphical relationship that shows how decreases in population density over time lead to increases in the size of each individual in the population; often has a slope of -3/2
79
New cards
positive density dependence
when the rate of population growth increases as population density increases (also known as **inverse density dependence**, or **Allee effect**). (typically happens when pop is so small that it makes it hard to find mates and reproduce)
80
New cards
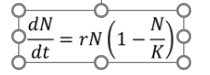
Logistic growth model
a growth model that describes slowing growth of populations at high densities; it is represented by:
81
New cards
Carrying capacity (k)
the maximum population size that can be supported by the environment.
82
New cards
S- shaped curve
The shape of the curve when a population is graphed over time using the logistic growth model.
83
New cards
Inflection point
the point on a sigmoidal growth curve at which the population has its highest growth rate.
84
New cards
logistic growth model low in population size
N is small so the slope is higher rising in growth
85
New cards
logistic growth model with higher population size
N is closer to one so slope is smaller slowing growth
86
New cards
Age structure pyramids with broad base and narrow top (arrow shaped)
indicates population is growing because more babies are being born than in previous generations
87
New cards
Age structure pyramids with narrow base (v shaped)
Indicates that population is declining because less babies are being born than previous generations
88
New cards
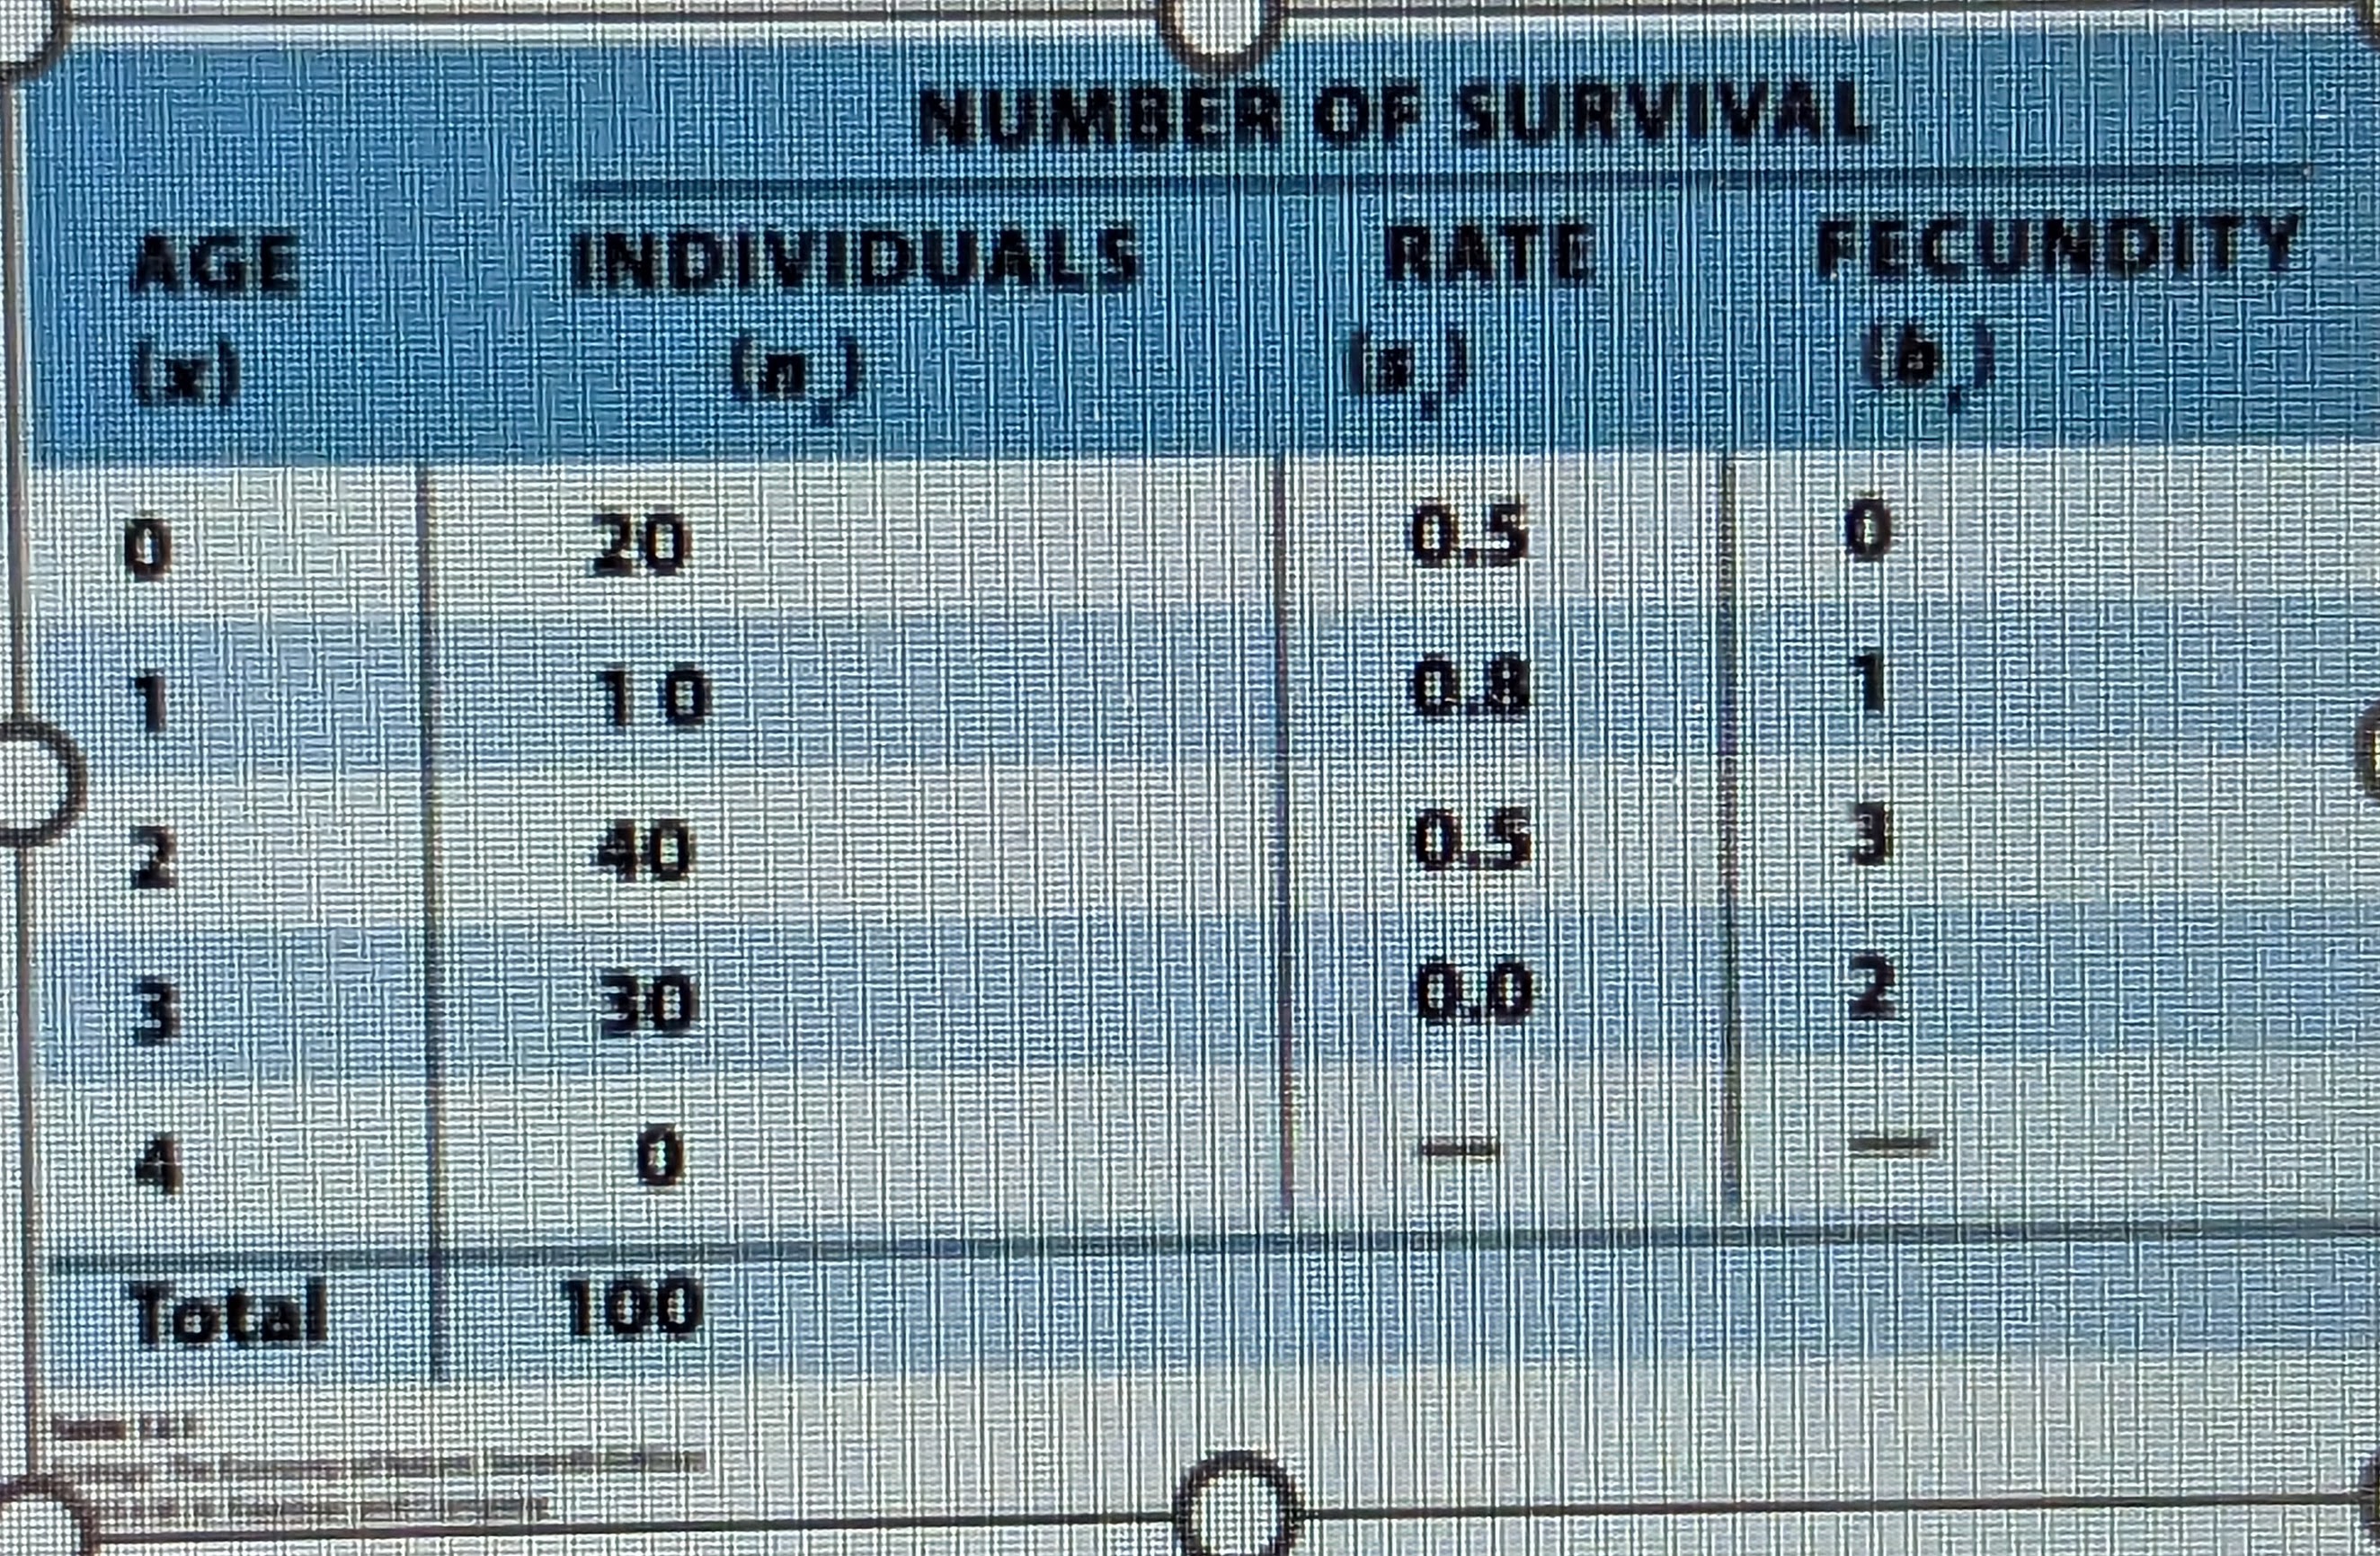
Life tables
tables that contain class-specific survival and fecundity data.
89
New cards
life table parts
*x* = age class
*nx =* the number of individuals in each age class immediately after the population has produced offspring.
*sx* = the survival rate from one age class to the next age class
*bx* = the fecundity of each age class
*nx =* the number of individuals in each age class immediately after the population has produced offspring.
*sx* = the survival rate from one age class to the next age class
*bx* = the fecundity of each age class
90
New cards
Number surviving to next age class
(*nx*) x (*sx*)
91
New cards
number of new offspring produced
(*nx*) x (*sx*) x (*bx*)
92
New cards
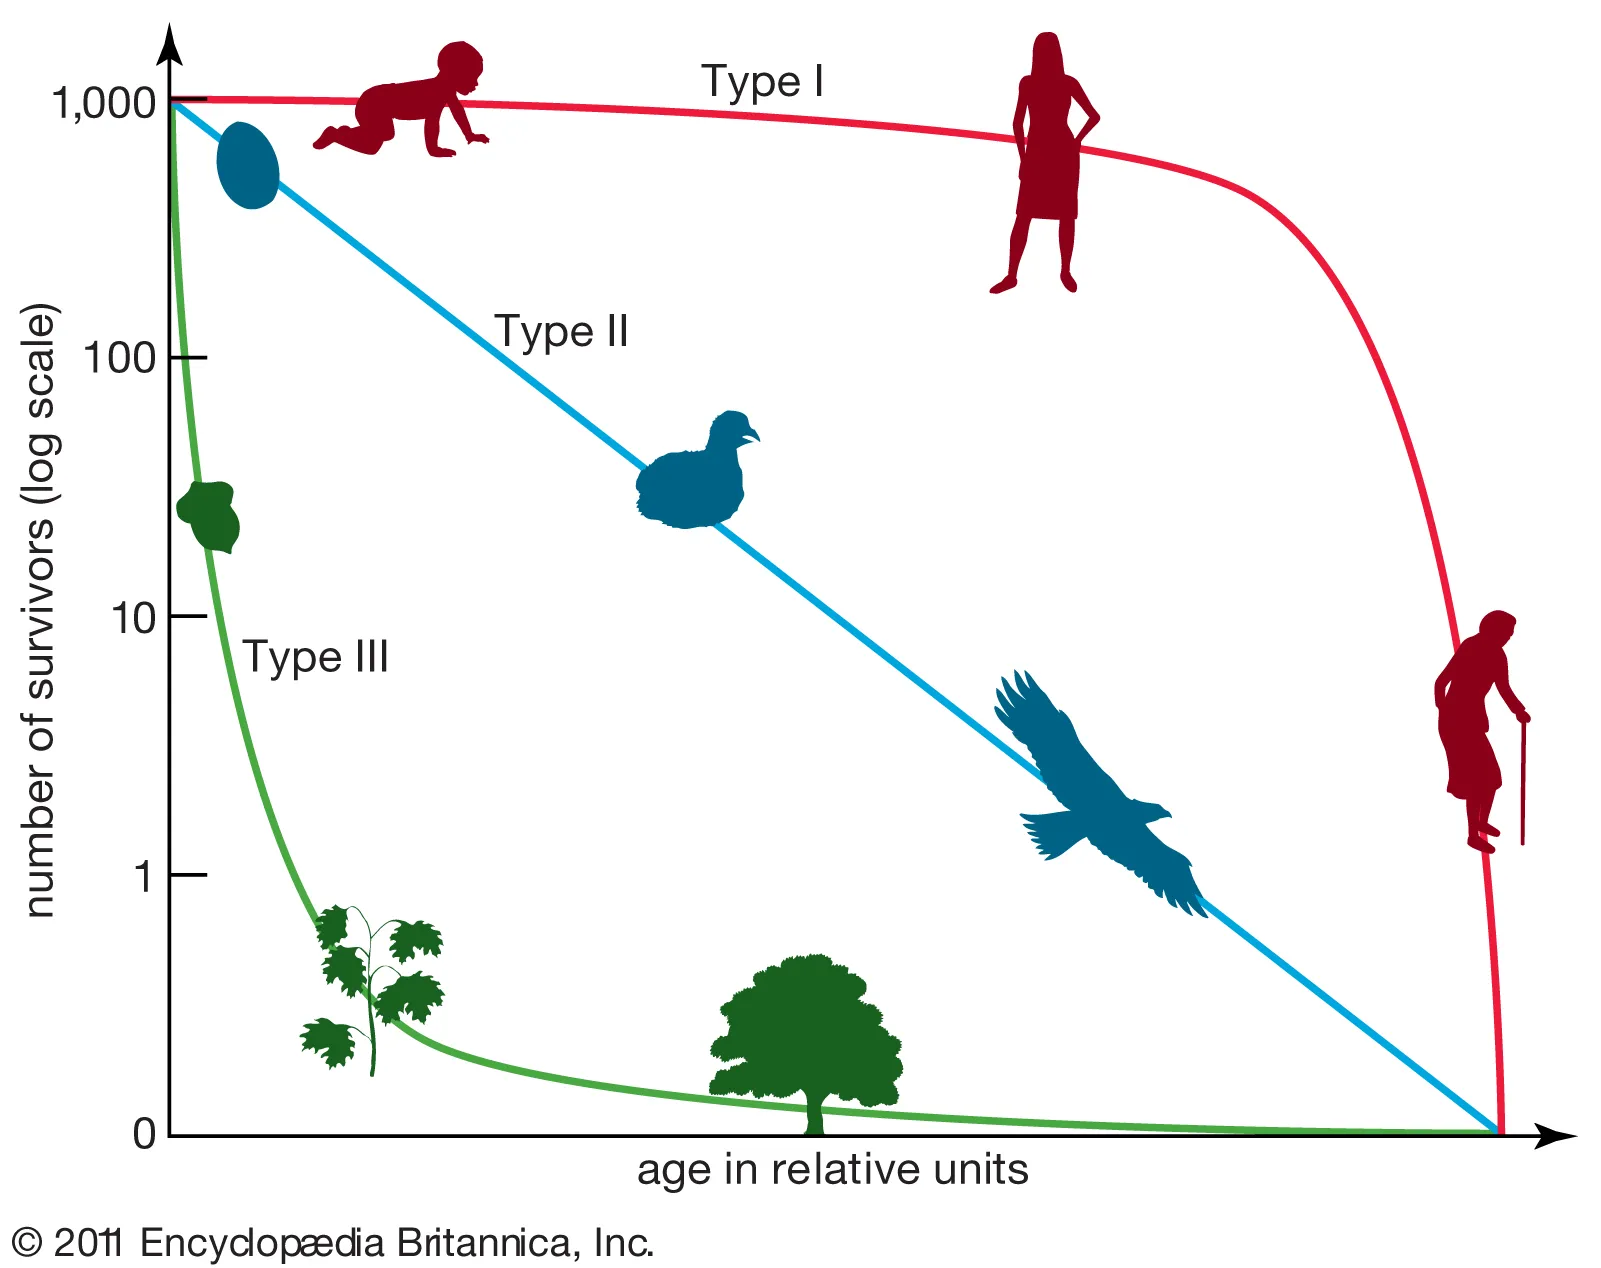
Type one curve
survivorship curve depicts a population that experiences low mortality early in life and high mortality later in life (e.g. bears, humans, elephants, whales).
93
New cards

type 2 curve
curve depicts a population that experiences constant mortality throughout its life span (e.g., squirrels, corals).
94
New cards

type 3 curve
depicts a population with high mortality early in life and high survival later in life (e.g., weeds, fish, alligators).
95
New cards
Cohort life table
a life table that follows a group of individuals born at the same time from birth to the death of the last individual.
96
New cards
Static life table
a life table that quantifies the survival and fecundity of all individuals in a population during a single time interval.
Does not take into account the effect of time
Works well with organisms with long lifespans
Does not take into account the effect of time
Works well with organisms with long lifespans
97
New cards
overshoot
when a population grows beyond its carrying capacity; often occurs when the carrying capacity of a habitat decreases from one year to next (e.g., because less resources are produced).
98
New cards
Die- offs
a substantial decline in density that typically goes well below the carrying capacity. Die-offs often occur when a population overshoots its carrying capacity.
99
New cards
population cycles
regular oscillation of a population over a longer period of time.
100
New cards
delayed density dependence
when density dependence occurs based on a population density at some time in the past.
Explore top notes
Biology 120 Notes (Part 2) Continuing the Discussion of Atoms and Other Molecules
Updated 1320d ago0.0(0)
Biology 120 Notes (Part 2) Continuing the Discussion of Atoms and Other Molecules
Updated 1320d ago0.0(0)