Chapter 19
Different types of traits (2)?
Continuous traits show a range of variation without distinct categories (ex. human height, social behaviours, pheromone concentrations),
Discontinuous traits have clearly defined/binary categories (ex. Mendel’s pea traits).
How does the number of genes influence phenotype distribution?
More genes contributing to a trait lead to a smoother, more continuous phenotype distribution.
What are threshold traits?
Traits that appear in discrete categories but are influenced by continuous genetic and environmental variation.
What is the equation for decomposing phenotypic variation?
VP=VG+VE, where VP is total phenotypic variation, VG is genetic variation, and VE is environmental variation.
How can phenotypic variance (VP) be estimated using genetic crosses?
By measuring total trait variation in populations with different genetic and environmental backgrounds.
What is a multifactorial trait?
A trait influenced by both genetic and environmental factors (e.g., human height).
Why don’t parents always pass down an exact height to their children?
Parents pass down genetic potential, but environmental factors (e.g., nutrition) influence final height.
What are polygenic traits?
Traits controlled by multiple genes, where each gene may contribute differently to the phenotype.
What is an example of a polygenic trait?
Human eye color, influenced by multiple genes such as OCA2 and HERC2 (major genes).
What are major genes and modifier genes?
Major genes have a strong effect on phenotype, while modifier genes have smaller influences.
What is an additive gene effect?
When multiple genes contribute small, cumulative effects to the phenotype. Alleles of each additive gene can be assigned a value of contribution.
Idea comes from multiple-gene hypothesis
What are the five main goals of quantitative genetics?
Determine how much phenotypic variation is due to genetics.
Identify how many genes influence a trait.
Measure each gene’s contribution.
Understand gene-gene interactions.
Study gene-environment interactions.
What is the multiple-gene hypothesis?
The idea that multiple genes assort independently and have additive effects on phenotype.
Who first applied the multiple-gene hypothesis?
Hermann Nilsson-Ehle, using kernel color in wheat plants.
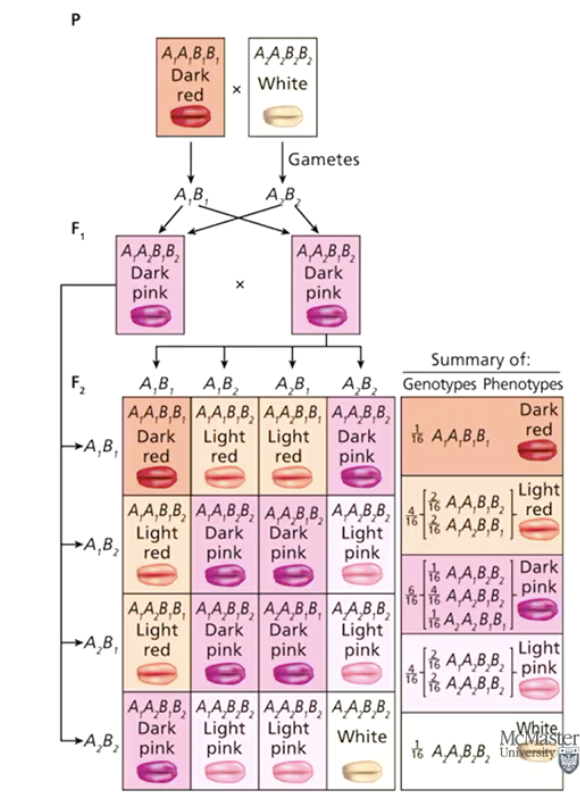
How does the additive gene model work?
Each contributing allele adds a unit of effect, influencing the final phenotype (e.g., darker vs. lighter kernel color).
Diagram displays additive gene model where two genes (A,B) and two alleles (1,2) are present
A1 and B1 each add one unit of colour to phenotype
A2 and B2 add no colour to phenotype
A1A1B1B1 is the darkest colour
A2A2B2B2 is the lightest colour
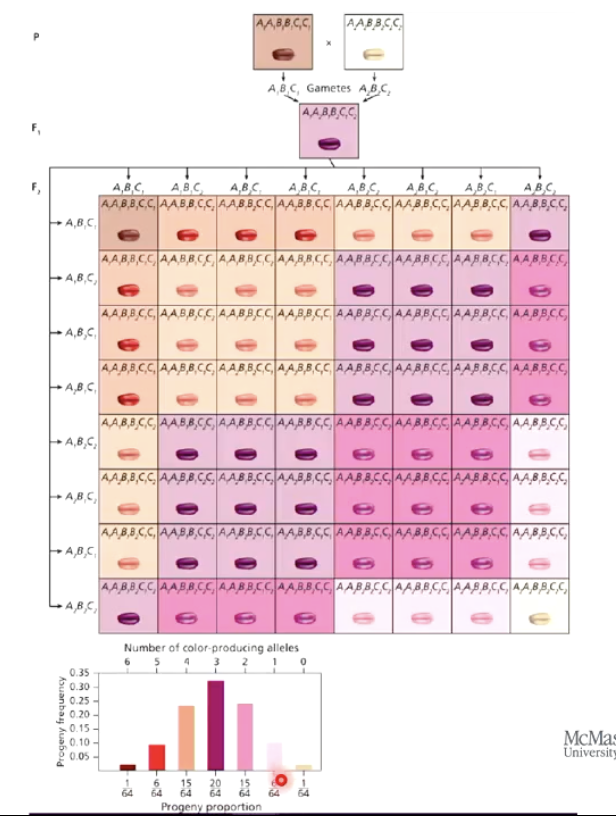
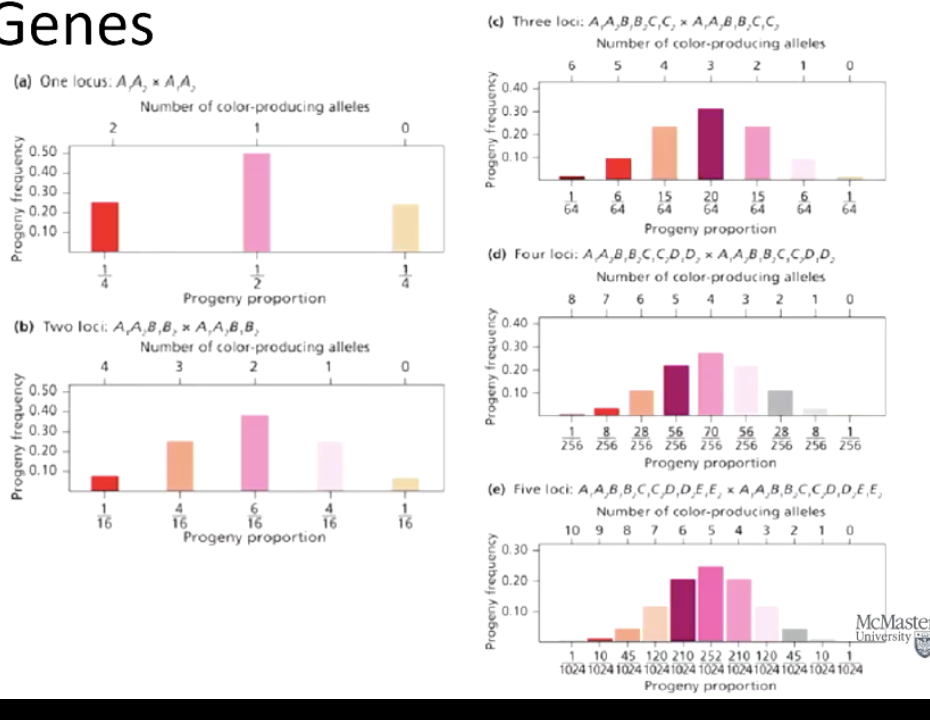
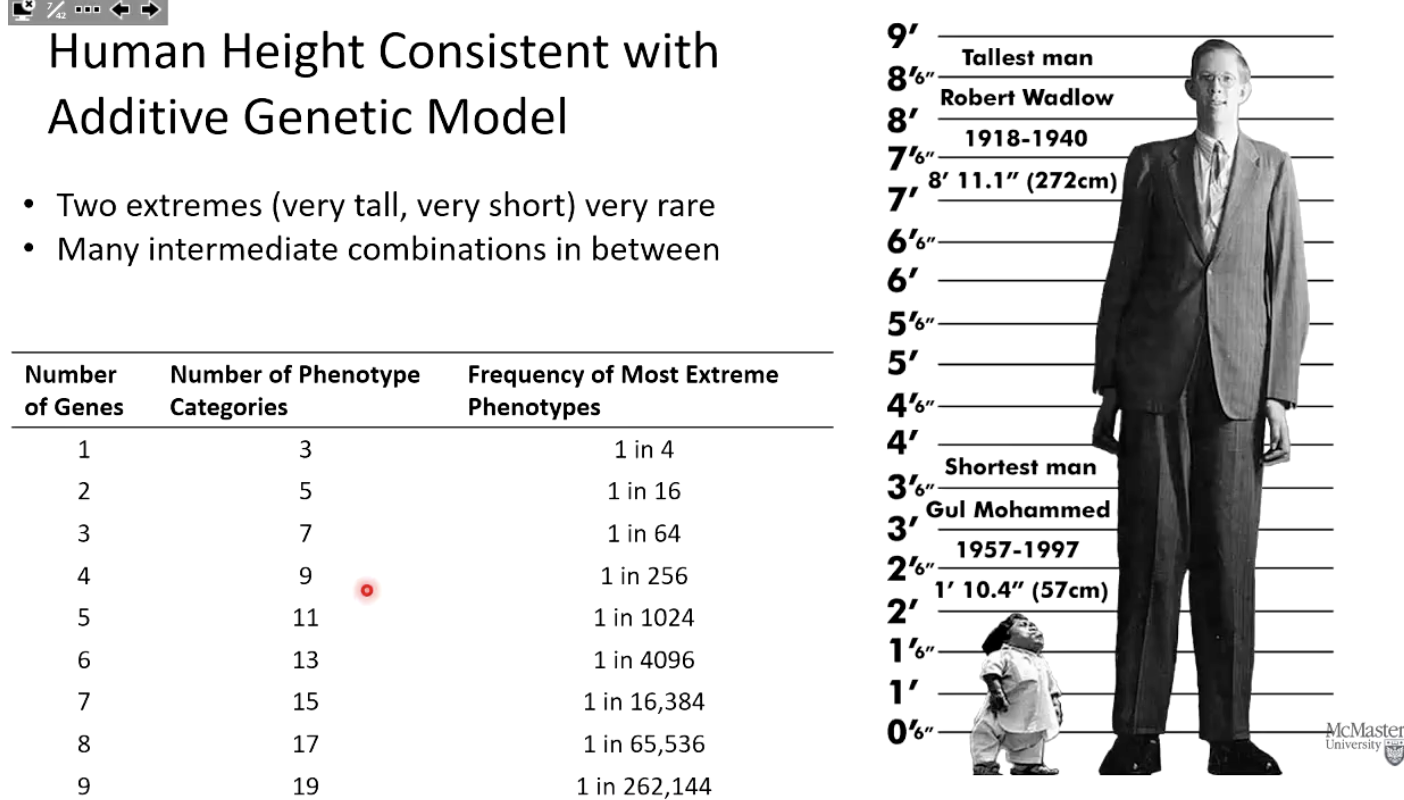
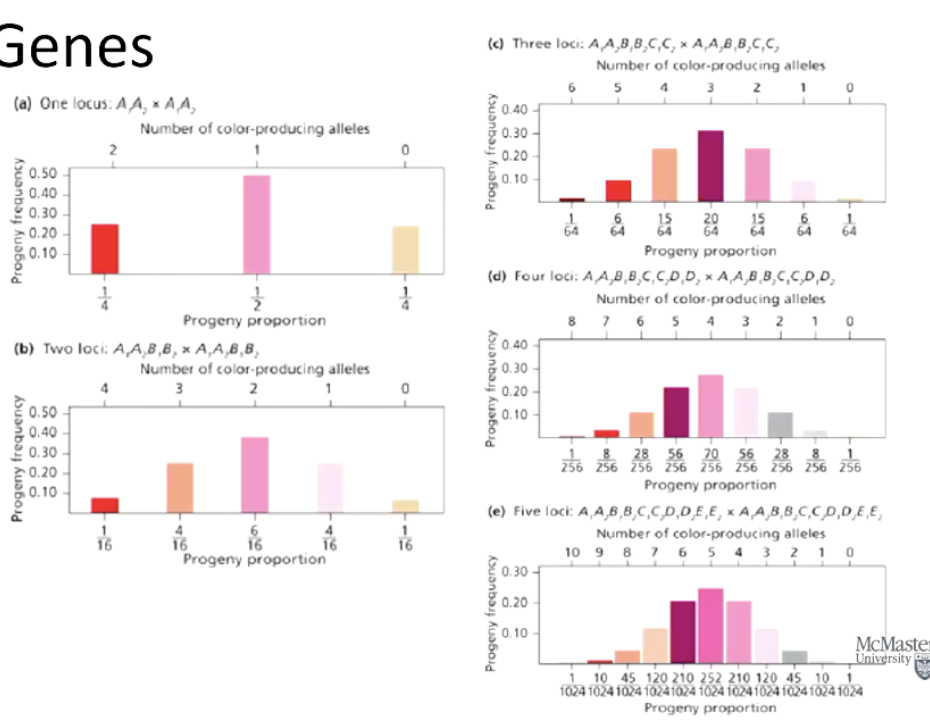
How many phenotypic classes are produced with increasing numbers of genes?
2n+1, where n is the number of genes.
3 genes = 7 phenotypic classes
4 genes = 9 phenotypic classes
What is the formula for the frequency of most extreme phenotypes?
1/4n, where n is the number of genes.
What happens to phenotype distribution as more genes are involved?
More phenotypic classes appear, making the distribution smoother.
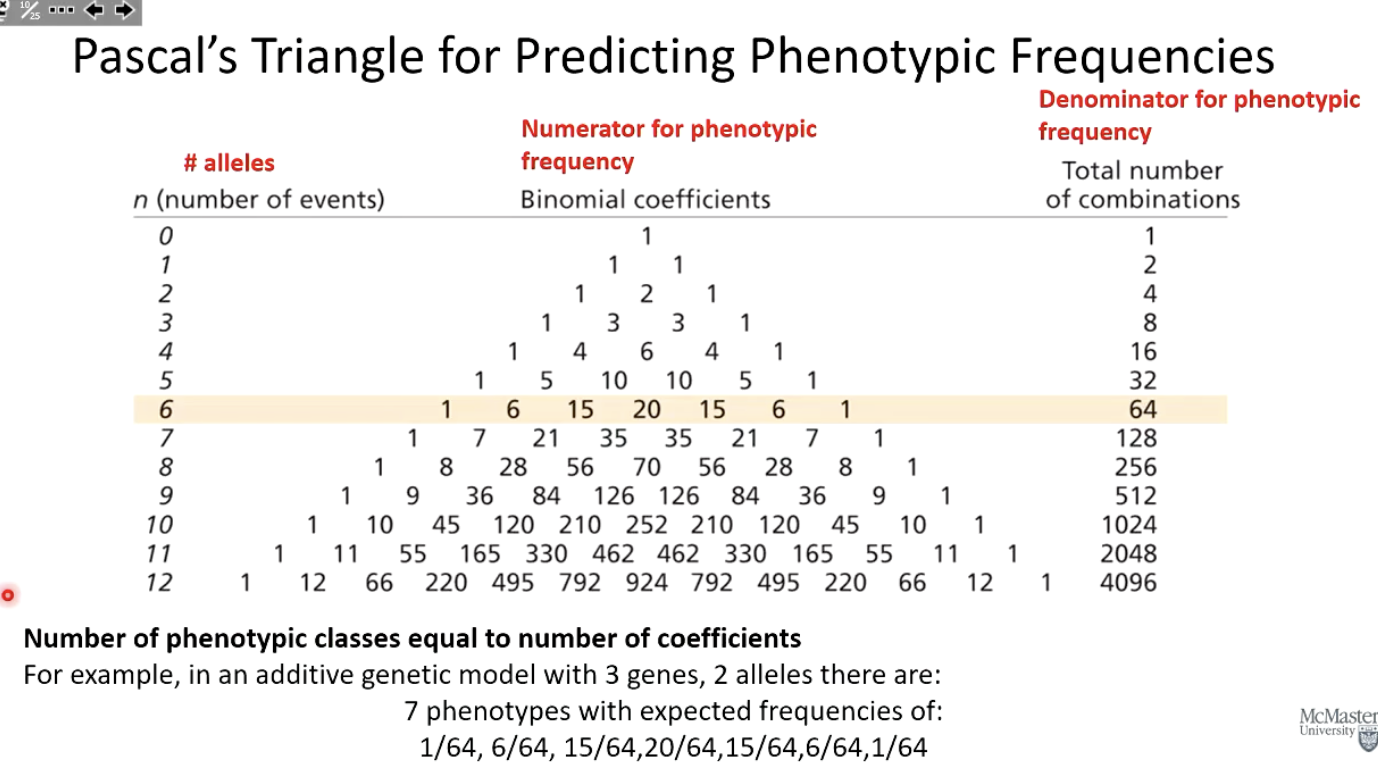
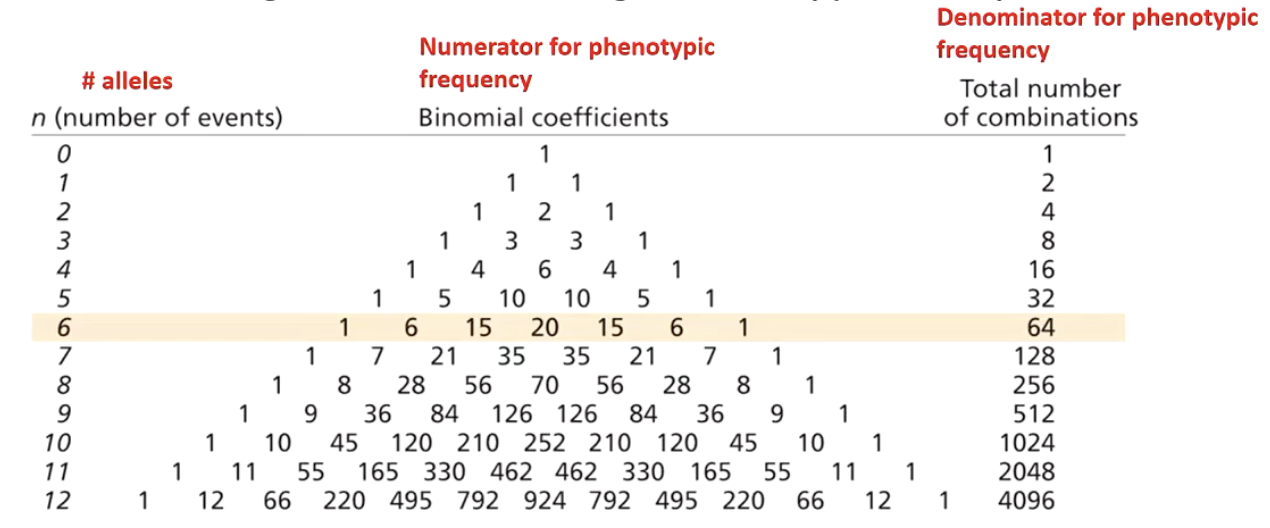
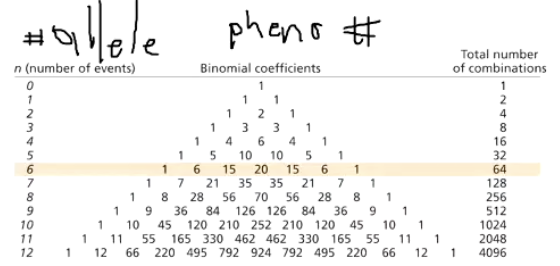
How can Pascal’s Triangle be used in quantitative genetics?
It predicts phenotypic frequencies based on the number of genes and alleles involved.
What are the number of phenotypic classes and expected phenotypic frequencies in a 3-gene additive model using Pascal’s triangle?
2(3)+1 = 7 phenotypes with expected frequencies of: 1/64, 6/64, 15/64, 20/64, 15/64, 6/64, 1/64.
Pop Quiz: In an additive genetic model with 8 genes, how many phenotypic classes are possible?
2(8)+1=17 phenotypic classes.
Pop Quiz: What is the expected frequency of an extreme phenotype in an 8-gene additive model?
Expected frequency of one extreme trait: 1/4n = 1/65536
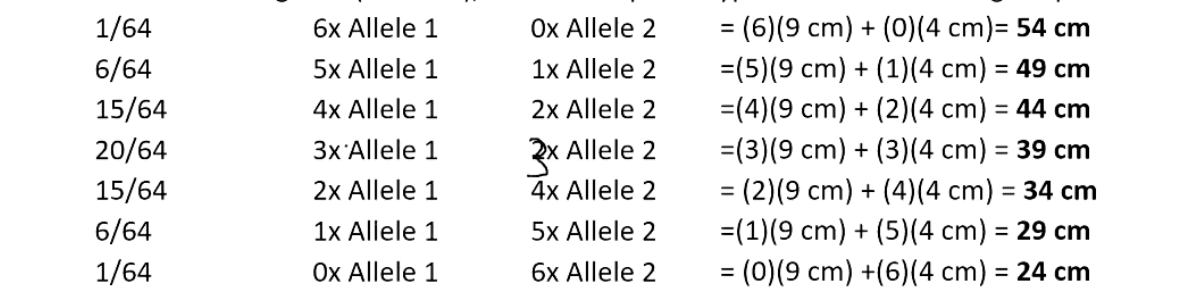
If pure-breeding daffodil lines A (54 cm) and B (24 cm) are crossed, what is the height of the F1 hybrids?
Line A has genotype A1A1B1B1C1C1 = 54 cm
Line B has the genotype A2A2B2B2C2C2 = 24 cm
Alleles for Line A each contribute: 54 cm/6 = 9 cm
Alleles for Line B each contribute: 24 cm/6 = 4 cm
F1 hybrids = A1A2B1B2C1C2 = (4 cm x 3)+(9 cm x 3) = 39 cm
(This is also the average of the heights of the parent plants)
What plant heights are expected in the F2 generation, and at what frequencies?
Line A has genotype A1A1B1B1C1C1 = 54 cm
Line B has the genotype A2A2B2B2C2C2 = 24 cm
Use Pascal’s triangle to help formulate the phenotypic frequencies (pascal’s triangle chart would be provided on test/exam)
Let allele 1 = A1B1C1 (contributes 9 cm)
Let allele 2 = A2B2C2 (contributes 4 cm)
Number of phenotypic classes for 3 genes: 2n+1=2(3)+1=7 phenotypes
Frequencies: 1/64, 6/64, 15/64, 20/64, 15/64, 6/64, 1/64
Why does human height follow an additive genetic model?
Extreme heights are rare, while most people have intermediate heights due to the combined effect of multiple genes and environmental factors.
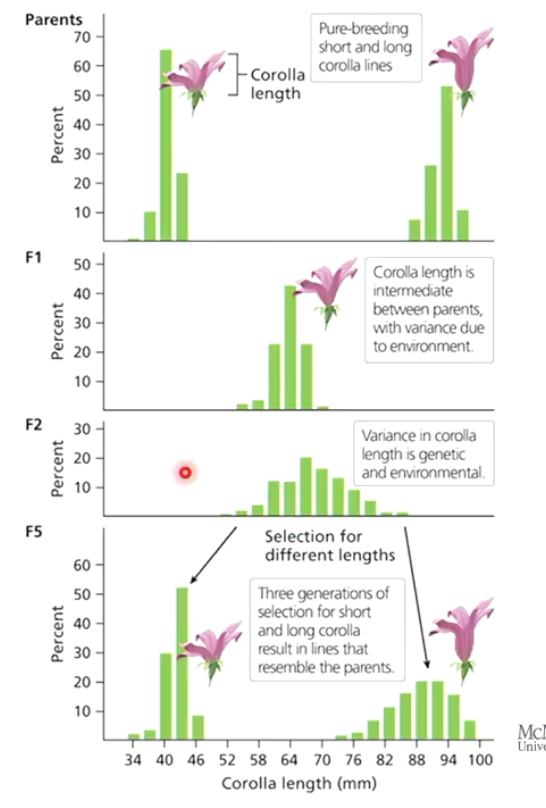
What did Edward East’s (1916) study of corolla length in tobacco plants demonstrate when he crossed 2 pure breeding lines (short plant and long plant)?
F1 hybrids were intermediate in length.
F2 generation showed high variance.
Selective breeding could re-establish short and long plants.
Conclusion: Trait is determined by segregation of alleles from multiple genes and phenotypic variance seen in each generation due to environmental factors.
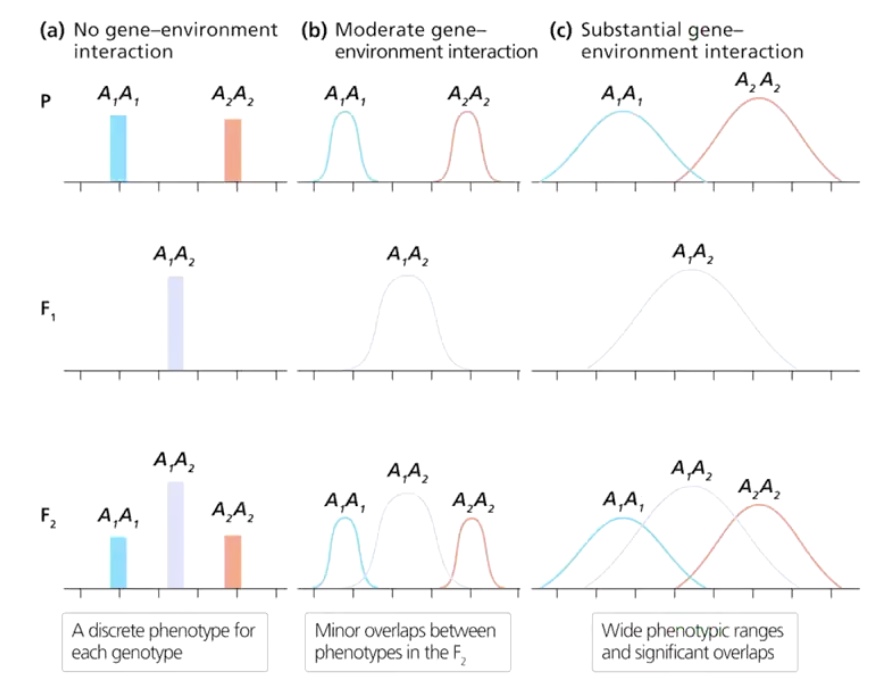
How does the environment affect traits?
Environment can affect width of quantitative distribution of phenotypes
No interaction – Each genotype has a distinct phenotype.
Moderate interaction – Some phenotypic overlap due to environmental effects.
Strong interaction – Wide phenotypic variation with significant overlap.
Stronger gene-environment interactions make traits more variable and less predictable.
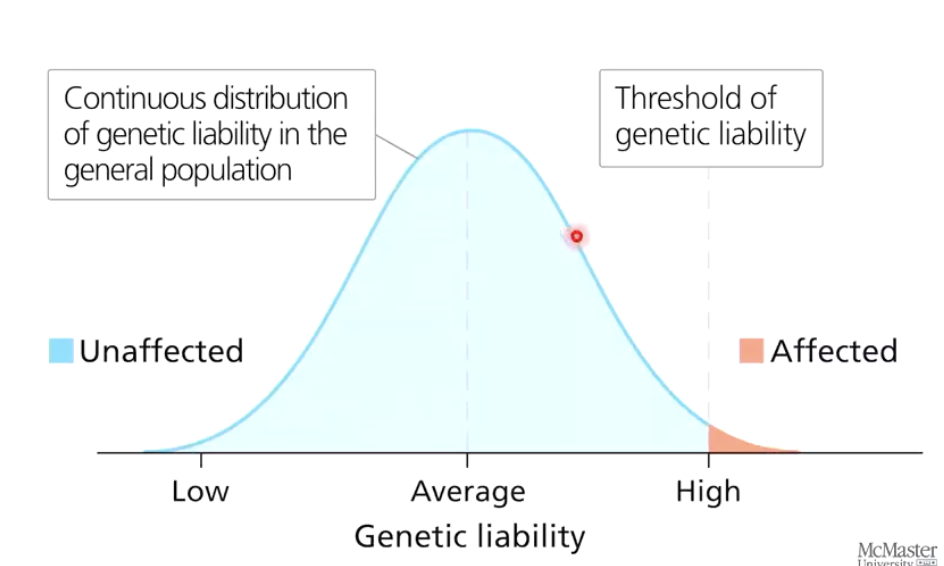
What are threshold traits?
Traits that appear in distinct categories but are influenced by continuous genetic and environmental variation (e.g., rare diseases).
Individuals can be unaffected (blue curve) or affected (red curve)
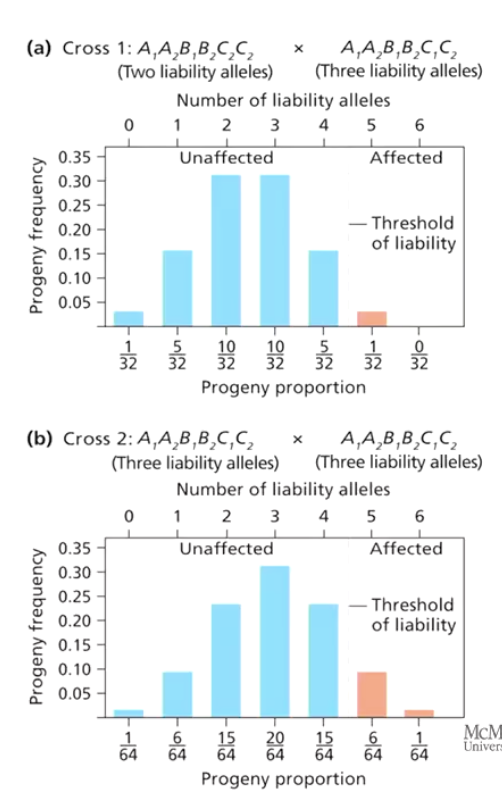
How does genetic liability contribute to threshold traits?
Some alleles (liability alleles) push phenotypes closer to the threshold, increasing the likelihood of expressing the trait.
Consider 3 loci: A, B, C; 2 alleles each
Allele 1: liability, additive
Allele 2: no liability
What factors contribute to threshold traits?
Genetic liability (number of additive alleles).
Environmental factors pushing individuals over the threshold.
What statistical tools are used to analyze continuous traits?
Continuous traits usually follow normal distributions
Use basic stats to categorize:
Mean (x bar), mode, median, standard deviation (σ), and variance (s²).
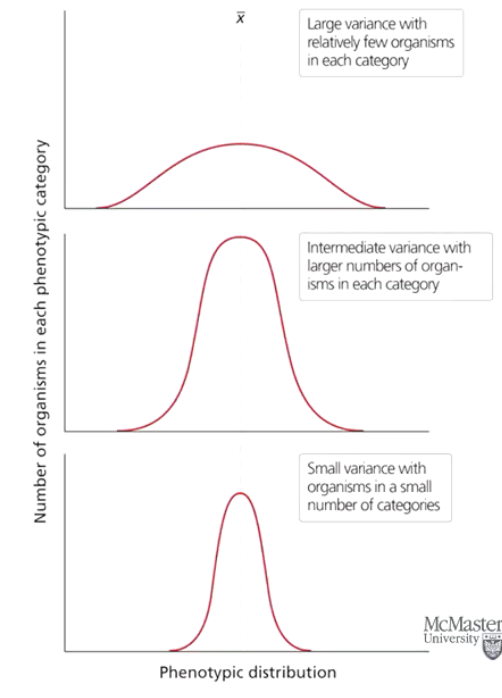
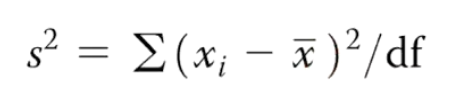
What does variance (s²) measure?
The spread of a distribution around the mean.
High variance = wide distribution
Small variance = narrow distribution
How is variance calculated?
By summing the squared differences between each value and the mean, then dividing by the degrees of freedom (number of independent variables).
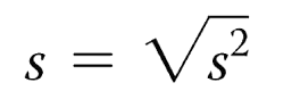
What is standard deviation?
Proportional to variance
Calculation: Square root of variance
Gives unit in same measure as mean so it’s usually a margin of error
What is the equation for phenotypic variance (VP)?
VP=VG+VE (genetic variance + environmental variance).
Genetic variance: genotype contribution to phenotype
Environmental variance: environmental contribution to phenotype
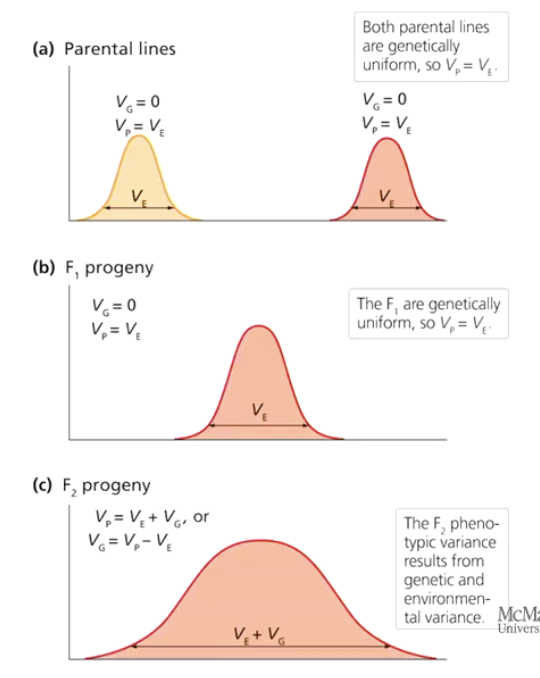
How does phenotypic variance differ in different generations?
Pure-breeding lines: VP = VE (no genetic variance: VG=0).
Genetically uniform F1 hybrids: VP = VE (no genetic variance: VG=0).
Genetically diverse F2 progeny: VP = VG + VE or VG = VP - VE (genetic and environmental contributions).
How does environmental variability affect phenotypic variance?
Stronger environmental effects = wider variance of phenotypic values
More diverse population = wider variance of phenotypic values
How can researchers control genetic variability in experiments?
By using model organisms:
Use of inbred populations, where VG=0 (all individuals are genetically identical)
Control environment in experiments: VE approaches 0
Therefore, phenotypic differences between populations (strains) are genetic
What are the three components of genetic variance (VG)?
Additive variance (VA) – sum of allelic effects.
Dominance variance (VD) – effects of heterozygous individuals not having intermediate phenotype between two homozygous alleles.
Interactive variance (VI) – epistatic interactions between alleles of different genes.
What is the full equation for genetic variance?
VG=VA+VD+VI
What is heritability?
Measures the proportion of phenotypic variation due to genetic variation.
What are the two types of heritability?
Broad-sense heritability (H²) = VG/VP (genetic variance over total variance).
Narrow-sense heritability (h²) = VA/VP (additive genetic variance over total variance).
What do heritability values indicate?
1 (or close to 1): Phenotypic variance is mostly genetic.
0 (or close to 0): Phenotypic variance is mostly environmental (little to no genetic variance)
What are the caveats of heritability?
It measures genetic influence but not how genes control a trait.
It is specific to the population and environment measured.
It can change over time.
High heritability does not mean the environment has no effect.
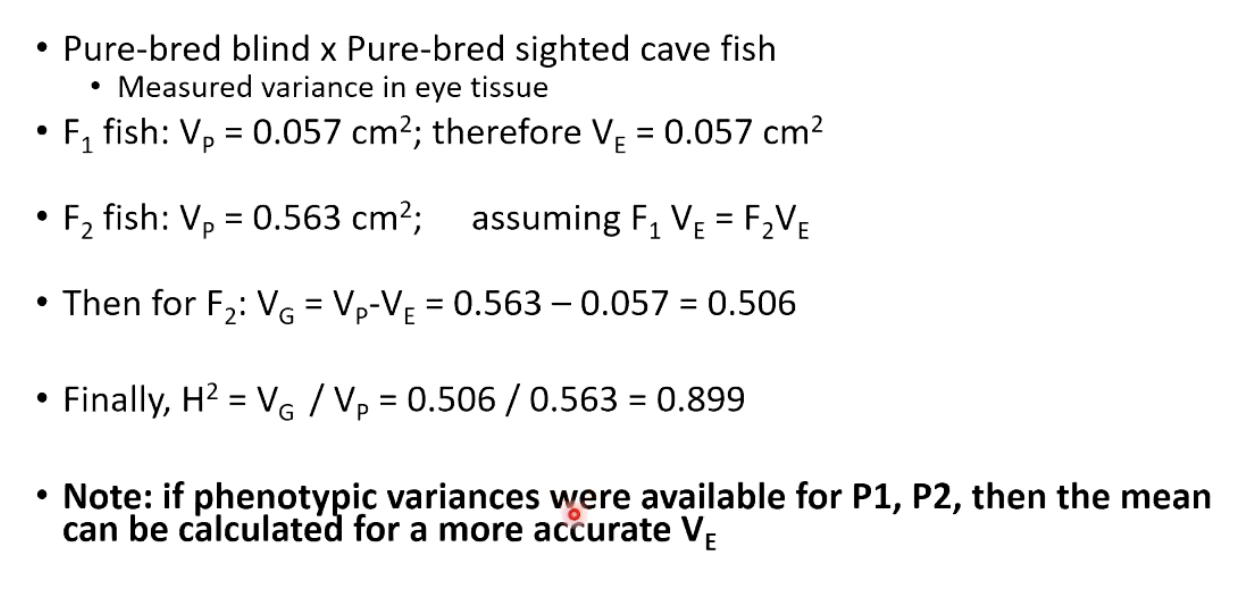
How was broad-sense heritability (H²) measured in cave fish?
By crossing blind and sighted fish, measured eye tissue mean and variance in F1, then produced F2, and measured their eye tissue
Since F1 are genetically uniform, all variance observed was due to environmental factors
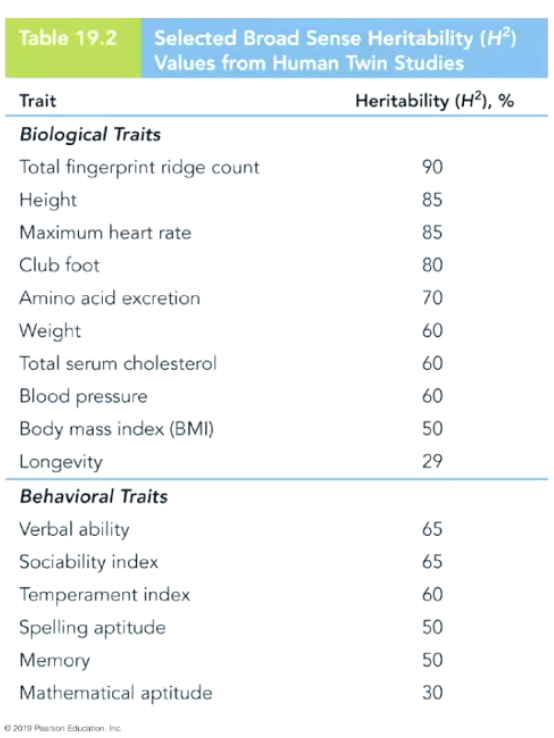
How do twin studies help measure heritability?
Identical twins (MZ): Share all genes → VP = VE.
Fraternal twins (DZ): Share ~50% of genes → VP = VE + ½VG.
Selected Broad Sense Heritability (H²) Values from Human Twin Studies and Caveats
Caveats:
MZ twins may have stronger shared maternal effects than DZ twins.
MZ twins often receive more similar parental treatment than DZ twins.
MZ twins may experience greater similarity of gene-environment interactions than DZ twins.
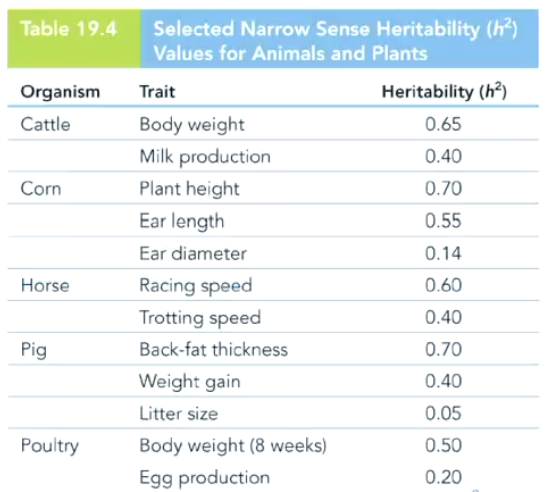
What is narrow-sense heritability (h²)?
The proportion of phenotypic variation due to additive genetic effects (h²=VA/VP).
Why is narrow-sense heritability important?
High h² means traits respond strongly to selection, allowing effective breeding.
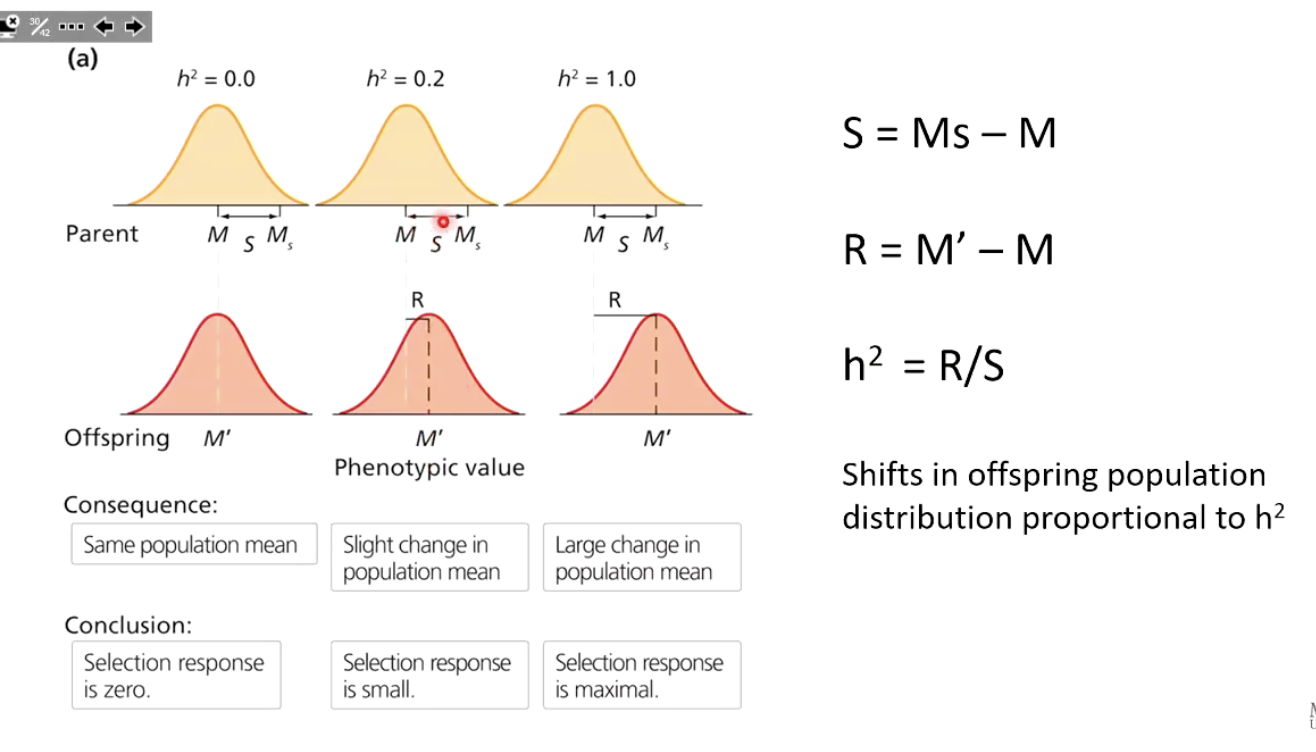
How is selection strength measured?
Using Selection Differential (S):
S=Ms-M
Ms = mean of selected parents (breeding population)
M = mean of original population
How is response to selection (R) calculated?
R depends on the extent to which the difference between the population mean and mean of mating individuals can be passed on to progeny
R = S(h²); h²=R/S
Selection is strongest when h²=1
R=M′−M
M′ = mean of offspring
M = mean of original population
How is narrow-sense heritability estimated from selection?
h2=R/S
A higher h² means a stronger shift in the offspring population.
What are QTLs and how are they mapped?
Genes that contribute to phenotypic variation in quantitative traits
By identifying chromosomal regions where genetic markers (e.g., SNPs) co-occur with phenotypes
What are the steps in QTL mapping?
Construct genetic crosses between parental strains with different phenotypes.
Cross parental strains to generate an F1 generation.
Cross F1 together or backcross to parental strains to produce F2.
Develop DNA markers (e.g., SNPs) that differentiate between parental strains.
Obtain genotype and phenotype data for all progeny.
Identify associations between genotype and phenotype at individual loci.
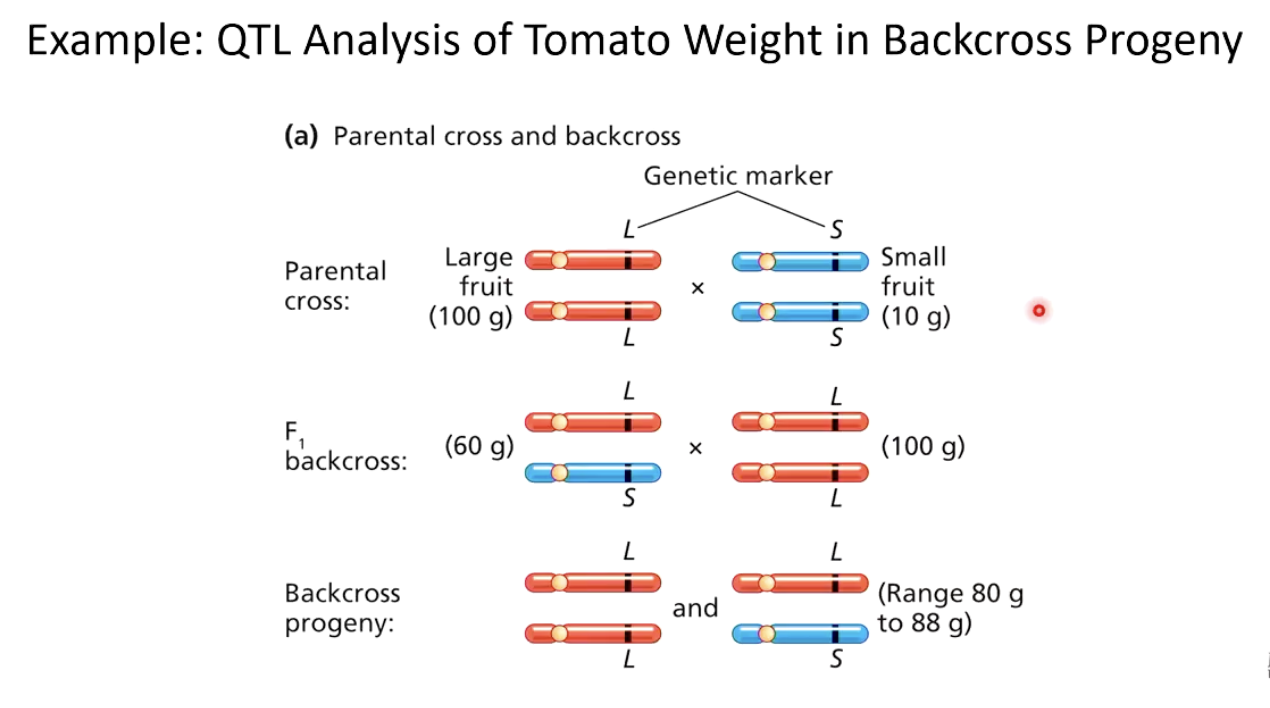
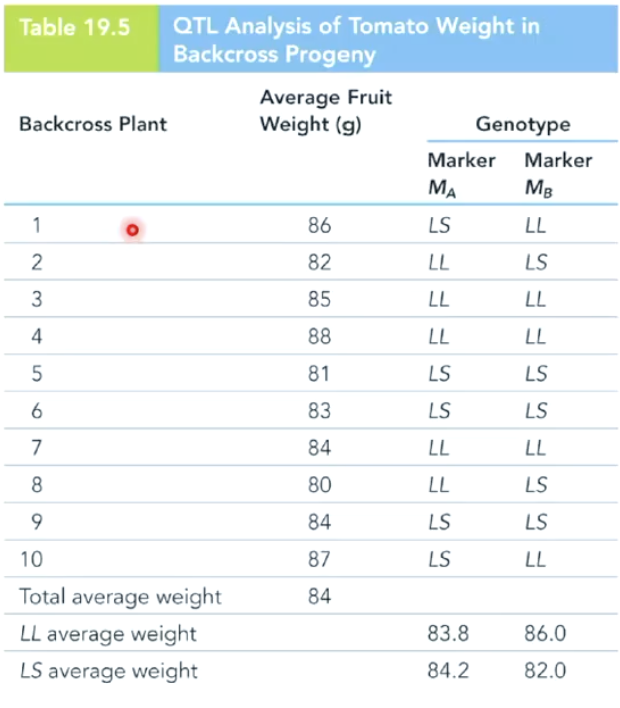
How was QTL mapping used to study tomato fruit weight?
Researchers crossed pure-bred large-fruited (100g) and small-fruited (10g) tomato strains.
F1 hybrid fruit weighed 60g (intermediate size).
F1 was backcrossed to P1, producing F2 fruit ranging from 80g to 88g.
F2 plants were genotyped at two loci (MA and MB) to determine which locus affected fruit size variation.
What are introgression lines (ILs)?
AKA near-isogenic lines (NILs), ILs are derived from backcross progeny through selective breeding to isolate specific genetic regions.
Why are ILs useful for QTL mapping?
Most of the genome is similar between ILs, except for key locations of interest.
ILs help pinpoint genetic regions associated with phenotypic traits.
Genetic markers (e.g., SNPs) are used to track recombination events and map genes.
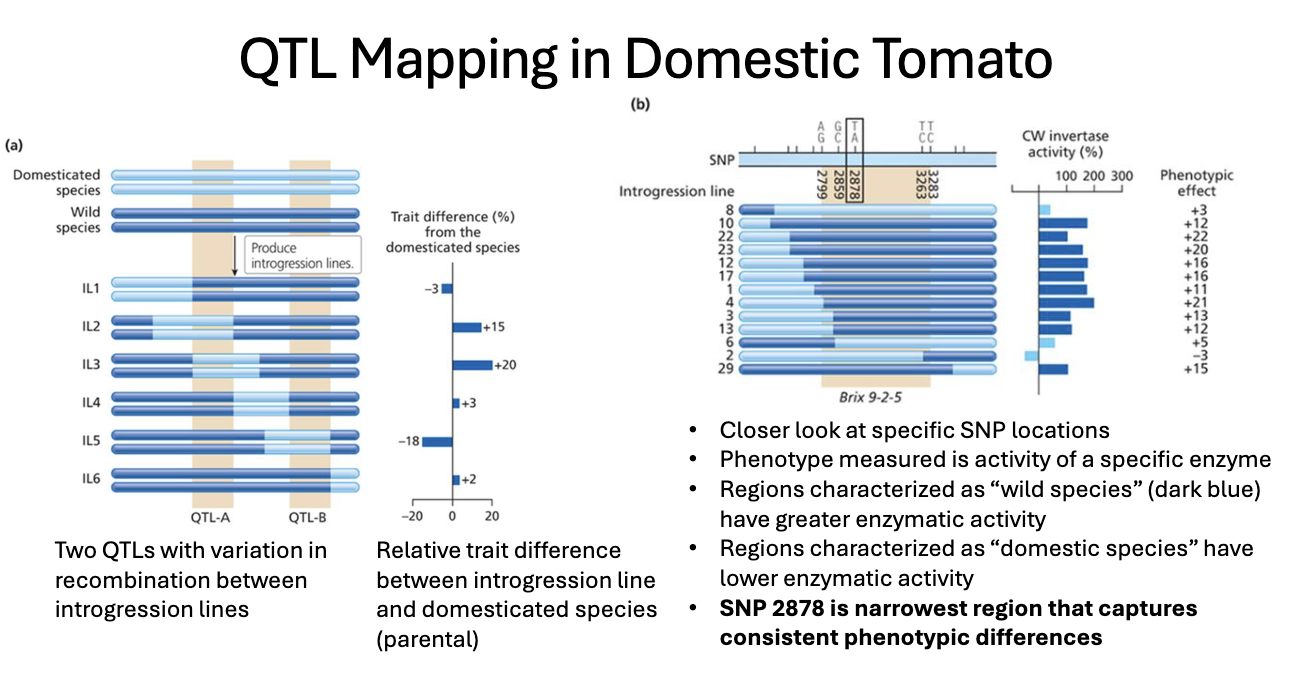
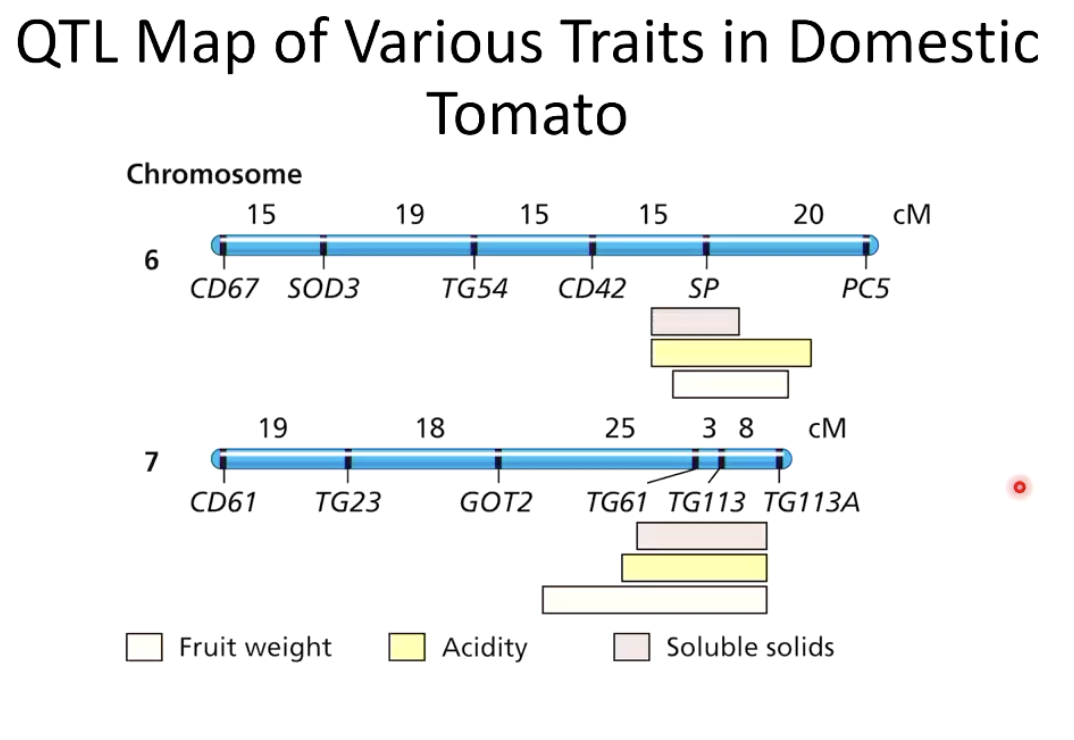
How was QTL mapping used in domestic tomato research?
Researchers analyzed SNP markers and phenotypic traits to locate genetic regions controlling enzyme activity.
What did the QTL mapping in domestic tomato reveal?
"Wild species" regions (dark blue) had higher enzymatic activity.
"Domestic species" regions had lower enzymatic activity.
SNP 2878 was identified as the narrowest region associated with consistent phenotypic differences.
What was the goal of the Drosophila QTL study?
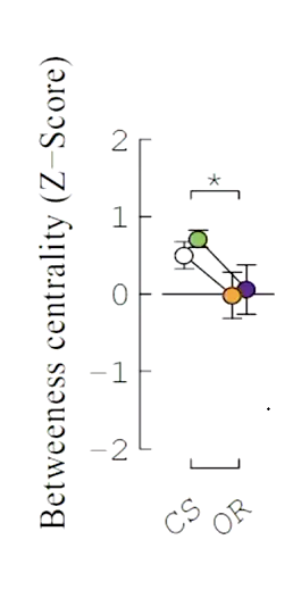
To understand genetic contributions to social network organization using betweenness centrality (BC) as a behavioral measure.
What is betweenness centrality (BC)?
A social network metric that identifies individuals acting as central hubs in a network
Higher BC = more individuals in the centre of network
How was BC linked to genetics?
Two Drosophila strains (Canton-S and Oregon-R) consistently showed differences in BC.
BC was found to be heritable across networks, including in humans.
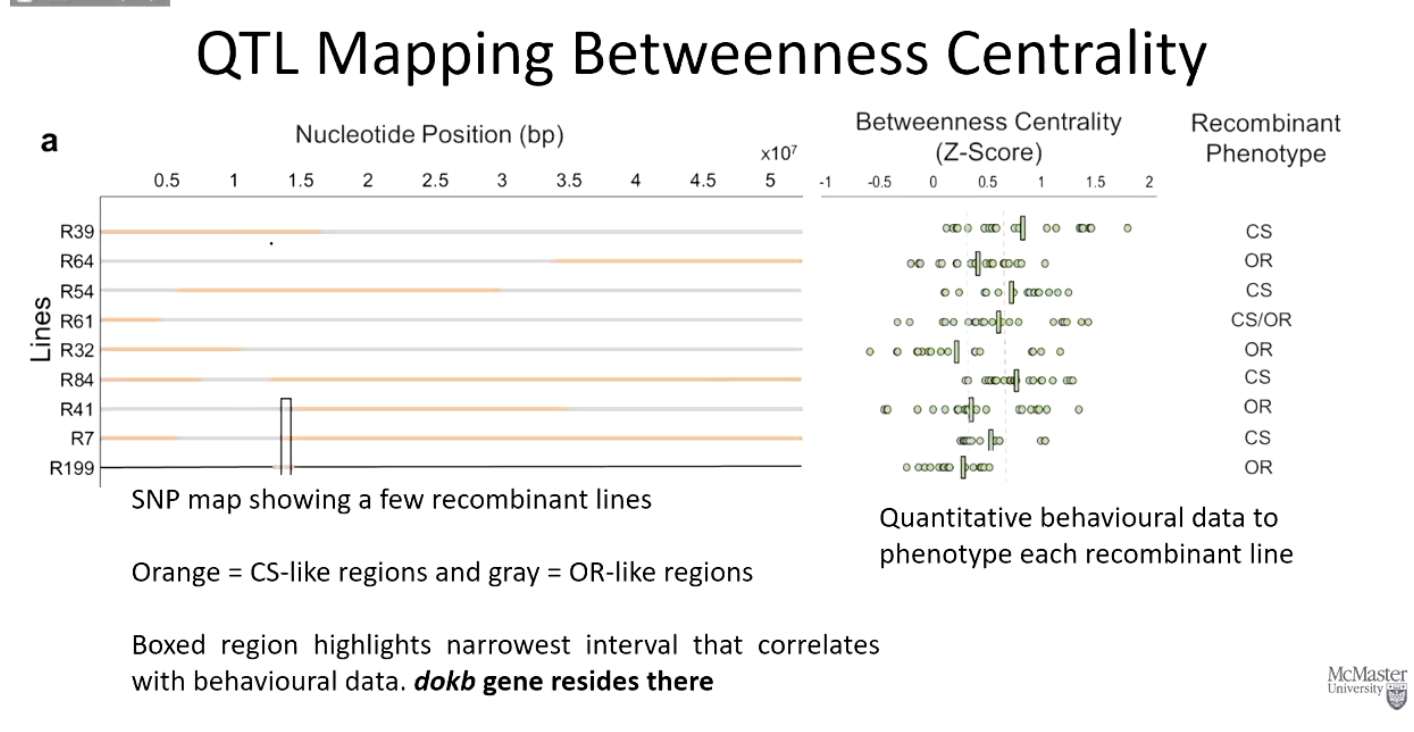
How was QTL mapping performed for BC?
Researchers spent years generating introgression lines between CS and OR strains.
SNP markers were used to track "CS-like" and "OR-like" genomic regions.
Social behaviour was measured in recombinant flies, compared to CS and OR flies in order to map the gene contributing to phenotypic differences.
What was the outcome of QTL mapping for BC?
A SNP map highlighted recombinant lines.
Orange regions = CS-like genes, Gray regions = OR-like genes.
A specific boxed region contained the dokb gene, which was linked to BC differences.
What are the main insights from QTL mapping studies?
QTL mapping helps link genetic markers to quantitative traits.
Introgression lines allow precise localization of genetic effects.
QTL analysis has been used in plant breeding (tomato weight) and behavioral genetics (Drosophila social behavior).
SNPs and genetic markers are essential for identifying key genetic contributors to phenotypic variation.