The Practice of Statistics Sixth Edition | Starnes and Tabor
What is the most common measure of center?
mean
How do you find the mean?
by adding all values in a set of observations and then dividing that sum by the number of observations
What is the median of a distribution?
the center
What does the symbol x̄ represent?
the mean of a sample
What does the symbol μ represent?
the mean of a population
What is a statistic?
a number that describes some characteristic of a sample
What is a parameter?
a number that describes some characteristic of a sample
When is a statistical measure resistant?
if it isn’t sensitive to extreme values
How do you find the median of a distrbution?
Arrange all observations from smallest to largest
If the number of observations n is odd, the median is the middle obesrvation in the ordered list
If the number of observations n is even, the median is the average of the two center observations in the ordered list
When are the mean and median of a distribution similar?
if the distribution is roughly symmetric and has no outliers
How does the skewedness of a distrbution’affects its mean and median?
if the distribution is strongly skewed, the mean will be pulled in the direction of skewedness but the median won’t
How do the mean and median react to outliers?
the median is resistant to outliers but the mean isn’t
What is the range of a distribution?
the distance between the minimum value and the maximum value
Is range a resistant measure of variability?
no
What does standard deviation measure?
the typical distance of the values in a distribution from the mean
How do you calculate standard deviation?
Find the mean of the distribution
Calculate the deviation of each value from the mean
Square each of the deviations
Add all the squared deviations, divide by n-1
This is the sample variance
Take the square root
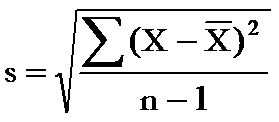
What is the formula for standard deviation?
What is the standard variance?
standard deviation before you square root it
What is standard deviation always greater than or equal to?
0
What do larger values of standard deviation indicate?
greater variation
Is standard deviation a resistant measure of variability?
no
What do the quartiles of a distribution do?
divide the ordered data set into four groups having roughly the same number of values
How do you find the quartiles of a distribution?
arrange the data values from smallest to greatest and find the median
What is the first quartile Q1 of a distribution?
the median of the data values that are to the left of the median in the ordered list
What is the third quartile Q3 of a distribution?
the median of the data values that are to the right of the median in the ordered list
What is the interquartile range (IQR)?
the distance between the first and third quartiles of a distribution
IQR = Q3 - Q1
What is the rule for outliers?
an observation is an outlier if it falls 1.5 x IQR above the third quartile or below the first quartile
low outliers < Q1 - 1.5 x IQR | high outliers < Q3 + 1.5 x IQR
Why do we look for outliers?
they might be inaccurate data values
they can indicate a remarkable occurrence
they can heavily influence the values of some summary statistics, like the mean, range, and standard deviation
What does the five-number summary of a distribution consist of?
the minimum, the first quartile Q1, the median, the third quartile Q3, and the maximum
What is a boxplot?
a visual representation of the five number summary
How do you make a boxplot?
Find the five-number summary
Identify the outliers using the 1.5 x IQR rule
Draw and label the horizontal axis
Scale the axis
Draw a box (from the first quartile to the third quartile)
Mark the median
Draw whiskers (to the minimum and the maximum)
Outliers are marked with a special symbol such as an asterisk