Chapter 6: Further Variance Analysis
1/18
There's no tags or description
Looks like no tags are added yet.
Name | Mastery | Learn | Test | Matching | Spaced |
|---|
No study sessions yet.
19 Terms
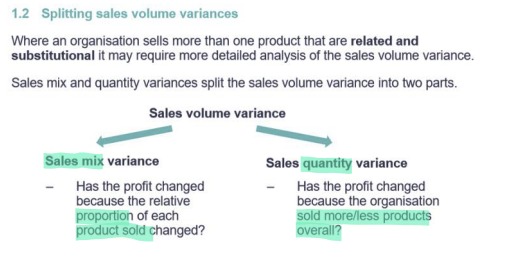
What is the aim of sales mix & quantity variances?
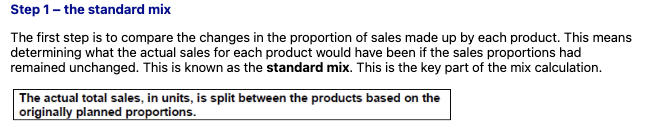
How is the standard mix calculated? (step 1)
What “standard mix” means
You actually sold/used some total quantity.
To isolate the mix effect, we redistribute that actual total into products/inputs in the original budgeted proportions.
That rebuilt bundle is the standard mix at actual volume.
Then we compare it with what we actually sold/used by item to get the mix variance.
Think: “If we had kept the planned proportions but at the actual total volume, what would the breakdown have been?”
A) Sales mix variance (using contribution per unit)
Budgeted (mix & Cm/unit):
A: 60% mix, contribution $8
B: 40% mix, contribution $5
Actual total units sold: 1,000
Actual units: A = 500, B = 500
Step 1: Build the standard mix at actual volume
A (std mix) = 1,000 × 60% = 600
B (std mix) = 1,000 × 40% = 400
Step 2: Sales mix variance (at standard contribution) Mix Var=∑(Actual units−Std-mix units)×Std contrib/unit\text{Mix Var}=\sum (\text{Actual units} - \text{Std-mix units}) \times \text{Std contrib/unit}Mix Var=∑(Actual units−Std-mix units)×Std contrib/unit
A: (500 − 600) × $8 = –$800
B: (500 − 400) × $5 = +$500
Net = –$300 adverse
Interpretation: we shifted towards the lower-margin product B.
(Sales quantity variance would then compare the standard mix at actual volume vs the original budget volume.)
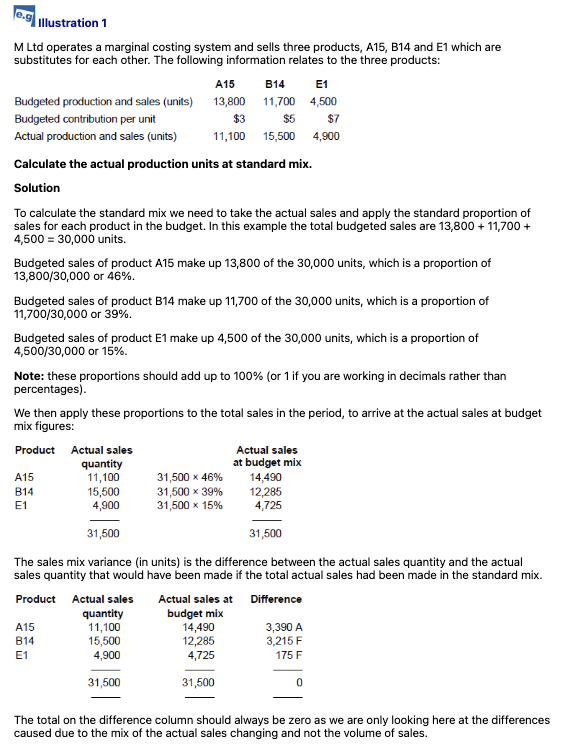
Standard mix example
What are the two ways to calculate sales mix and sales quantity variances?
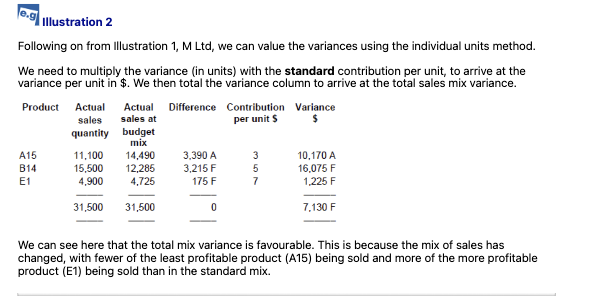
Individual units method example
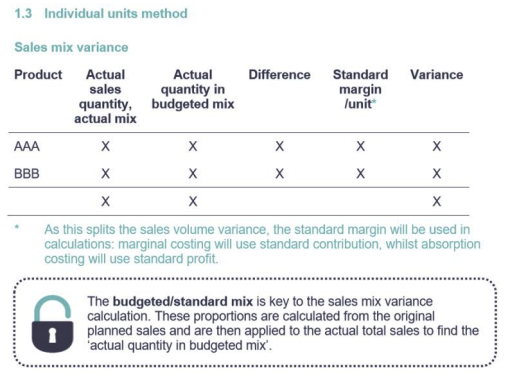
What is the table used to calculate sales mix variance under the individual units method? What is the standard margin under marginal costing & absorption costing?
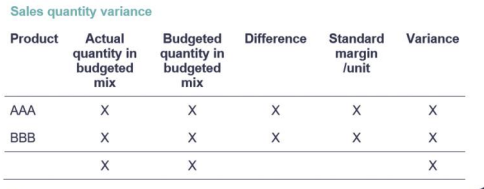
What is the table used to calculate sales quantity variance under the individual units method?
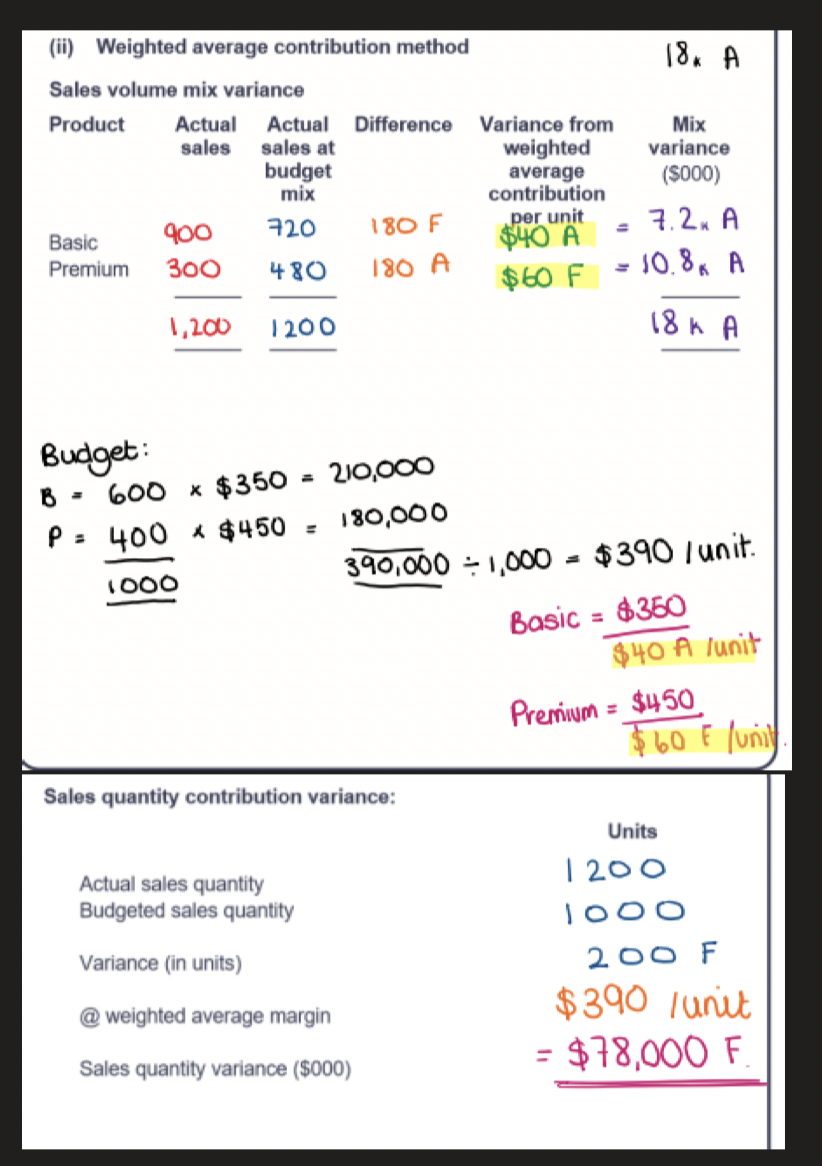
When calculating the sales mix variance, the weighted average method is seen as being superior, why?
How is weighted average margin calculated?
How is the weighted average margin used in the sales mix variance table?
How is the variance from weighted average contribution/unit calculated?
Variance form WAC/unit:
((Qₓ × Cₓ) + (Qᵧ × Cᵧ)) ÷ (Qₓ + Qᵧ)
Where:
Qₓ = Budgeted sales units of Product X
Qᵧ = Budgeted sales units of Product Y
Cₓ = Contribution per unit of Product X
Cᵧ = Contribution per unit of Product Y
The variance arises from comparing the standard contribution to this value.
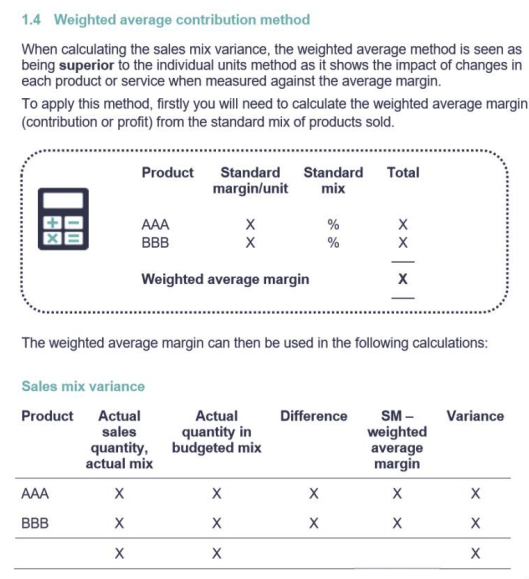
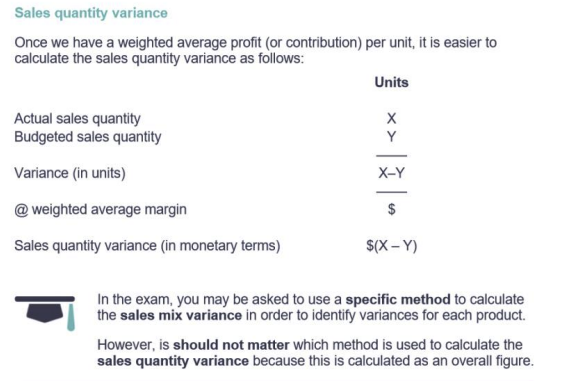
How is the sales quantity variance calculated once we have a weighted average margin per unit?
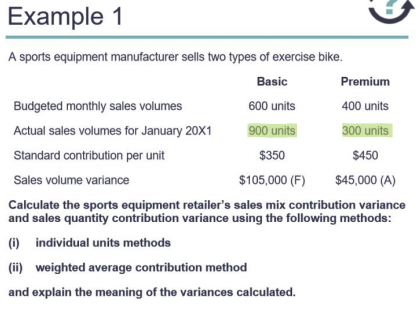
Example
Individual units method
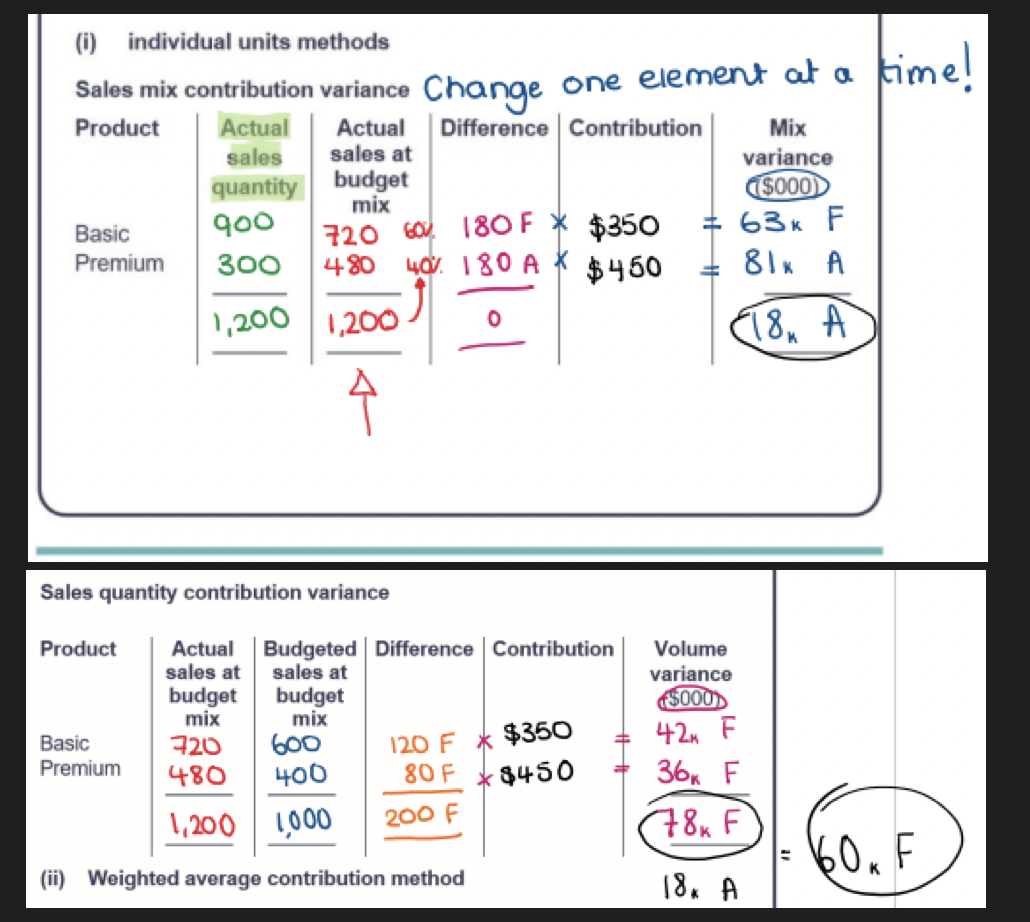
Example
Weighted average contribution method
The weighted average contribution is the total budgeted contribution divided by the total budgeted sales.
To value the sales mix variance, the weighted average contribution is deducted from the standard contribution per unit for each product. This shows the difference between the contribution being generated by each product and the average contribution.
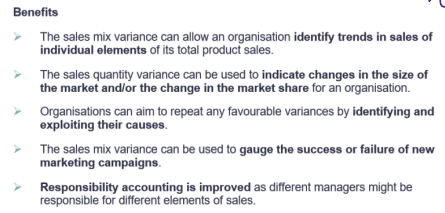
What are some of the benefits of splitting the sales volume variance?
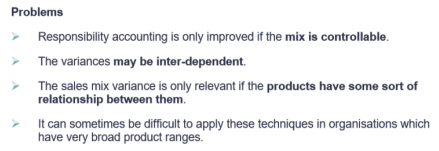
What are some of the problems of splitting the sales volume variance?
1) “Responsibility accounting is only improved if the mix is controllable.”
You can only judge a manager on mix if they can actually influence which products sell.
OK: Category manager chooses shelf space and promo for A vs B → mix is partly under their control.
Not OK: Mix is driven by customer prescriptions or government mandates → don’t blame the manager for an “adverse mix”.
2) “The variances may be inter-dependent.”
Changing one thing can change another; you can’t always isolate causes.
Example: A discount on Product A increases its volume and also shifts mix toward A. Is the gain due to price (price variance), quantity, or mix? They interact.
3) “Sales mix variance is only relevant if the products have a relationship.”
Mix matters when customers choose between your products (substitutes or a bundle).
Relevant: Regular coffee vs decaf (customers switch between them).
Not very relevant: Laptops vs bottled water—unrelated lines; a “mix” shift tells you little.
4) “Hard to apply with very broad product ranges.”
If you sell hundreds/thousands of SKUs, calculating standard mix, margins, and variances for each becomes complex and noisy.
You may need to group products (families/segments) or the results become unmanageable and harder to interpret.
Practical takeaways
Use mix/quantity variances where managers can influence the levers and products compete for the same customer choice.
Expect overlap with price and promotion effects—use supporting analysis (promo logs, elasticity, experiments).
For wide ranges, aggregate to sensible categories to keep the signal > noise.
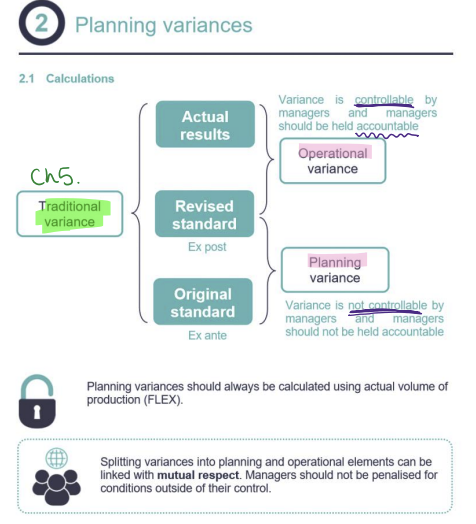
What are operational and planning variances the difference between, how do they relate to manager accountability? How should planning variances always be calculated?
How do you approach calculations where there is only a change to one standard, such as standard material cost or standard material usage?
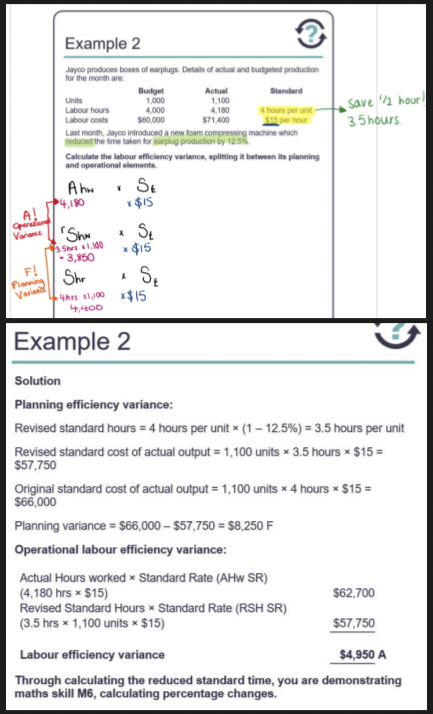
operational and planning variance example
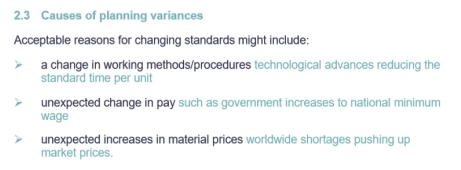
In terms of planning variances, what are some acceptable reasons for changing standards?
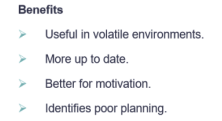
What are some benefits of determining planning variances?
What are some limitations of determining planning variances?