IBDP Physics - Mathematics and Measurements
Orders of Magnitude and Significant Figures:
In physics, we use a range of magnitudes, from very, very big to very, very small. To easily express these we write them to the power of ten (for example 10000 would be written as ).
10 =
100 =
1000 =
10000 =
100000 =
Uncertainties:
The uncertainty is an estimate of the difference between the measurement reading and the true value. The two types of measurement errors that can lead to uncertainties are random and systemic errors.
random error: unpredictable fluctuations in measurement readings due to uncontrolled factors.
systematic error: due to the use of faulty systems or flaws in the experimental method
There are three different types of uncertainties:
absolute uncertainty: when uncertainty is given as a fixed quantity
fractional uncertainty: when uncertainty is given as a fraction of the total measurement
percentage uncertainty: when uncertainty is given as a percentage of the total measurement
There are different uncertainties in different situations:
in a reading: ± half the smallest division
in a measurement: ± the smallest division
in repeated data: half the range (i.e. +-1/2(largest-smallest value)
in a digital reading: ± the last significant digit unless otherwise quoted
in the natural log of a value: uncertainty in x divided by x
Combining uncertainties:
addition and subtraction: y=a+b or y=a-b
Δy = Δa + Δb (the sum of the absolute uncertainties)
multiplication and division: y=ab or y=a/b
Δy/y = Δa/a + Δb/b (the sum of the fractional uncertainties)
power: y=
Δy/y = n(Δa/a) (the magnitude of n times the fractional uncertainty)
Scalars and Vectors:
A scalar is a quantity that has magnitude and a vector is a quantity that has both magnitude and direction. Distance is a scalar quantity and displacement is a vector quantity as only displacement accounts for the direction that the movement is in.
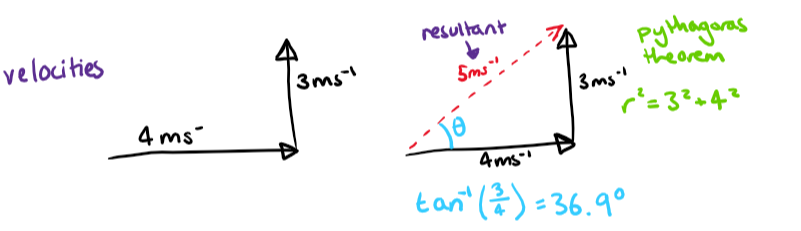
Vectors are represented by arrows. The arrowhead indicates the direction of the vector and the length of the arrow indicates its magnitude. To combine vectors, link the vectors head to tail and use Pythagoras’ Theorem (or other trigonometric methods) to find its magnitude.
Graphs:
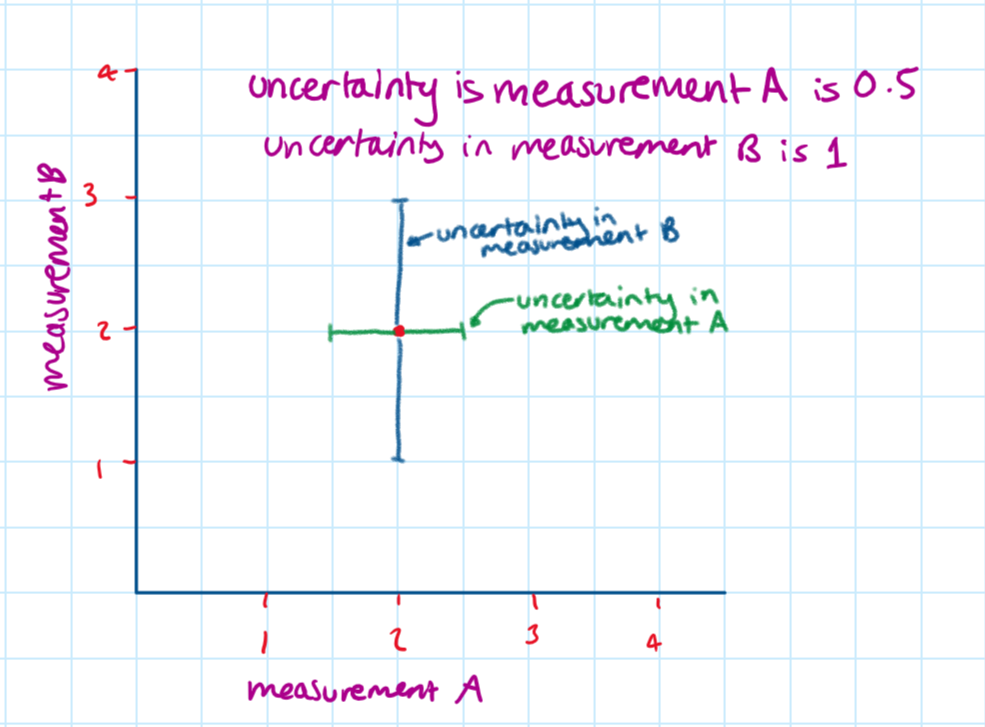
You can draw error bars by adding a vertical and horizontal bar to each point which is the length of the uncertainty in the measurement on that axis.
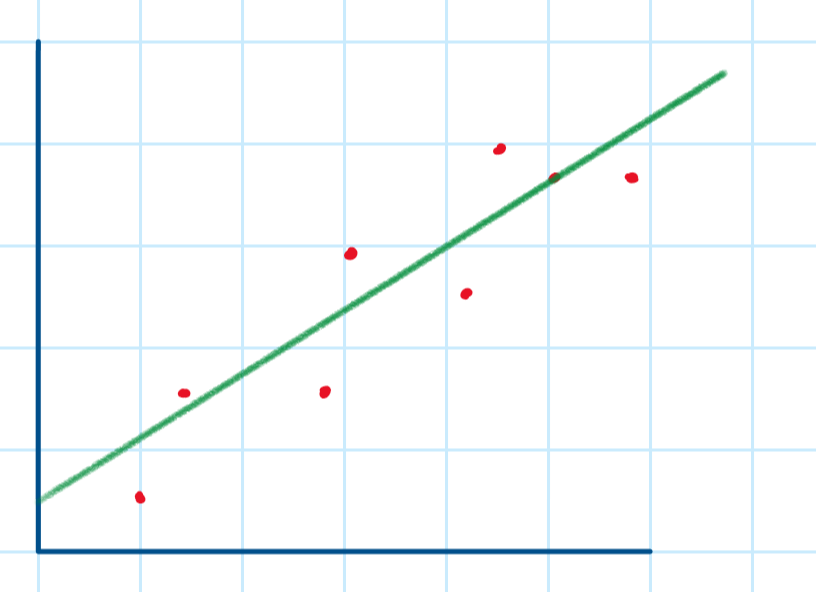
We draw lines of best-fit by drawing a straight line which attempts to minimise the distance between the points and the line - this means that some points are above and some points are under the best-fit line.
The lines of minimum and maximum gradient are drawn by connecting a point on the lowest point’s error bar to a point on the top point’s error bar.
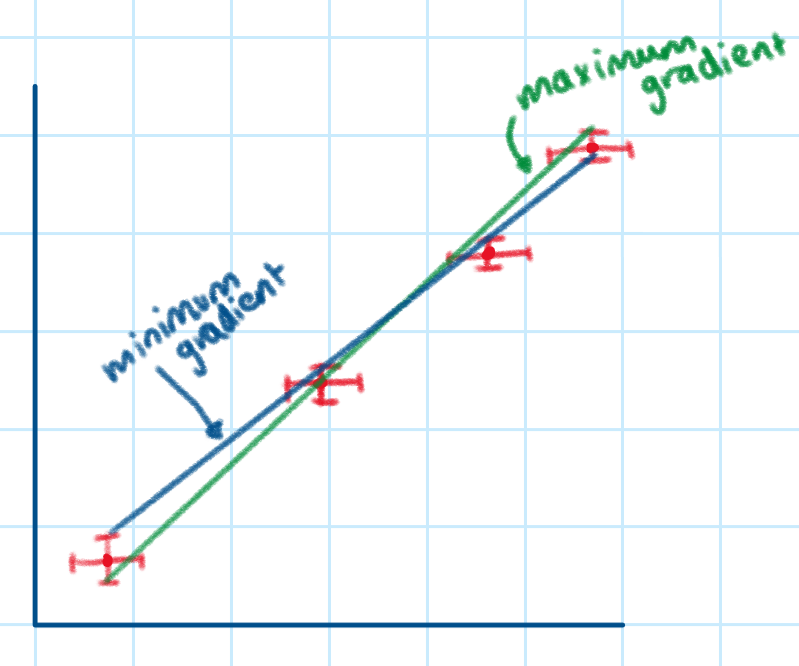 We can find the uncertainty in the gradient (line of best-fit) by using these values in the formula:
ΔK= (kmax - kmin)/2
where:
k = gradient
ΔK = uncertainty in the gradient