Experimental Design and Analysis Exam #2
1/45
Earn XP
Description and Tags
John Carroll University- Experiemental Design and Analysis with Dr. Yost. Exam #2 covers chapters 8-10. The cards are mostly based on Yost's chapter outlines using supplementary definition from the text.
Name | Mastery | Learn | Test | Matching | Spaced | Call with Kai |
|---|
No analytics yet
Send a link to your students to track their progress
46 Terms
confounding variable
component reasonably responsible for observed relationship not measured in the study
how to work around confounds in research
goal is to control for confounds through random assignment (creates equivalence in the IV groups)
confounds in relation to validity
controlling for confounds increases a study’s internal validity
Posttest only design
advantages of pretest-posttest design
determining if there is equivalence prior to manipulation
good if you need to identify a particular type of participant (ex. - maybe in a “quit-smoking” study, heavy smokers saw less progress with the treatment method than light smokers)
disadvantages of pretest-posttest design
time consuming and awkward
Can sensitize participants to the hypothesis that could lead to response bias
might effect generalizability as pretests do not really occur in the real world
Independent group/ between subject design
Ps only exposed to 1 level of the IV
Repeated Measure / within subject design
Ps exposed to both IVs/treatments
advantages of repeated measure design
fewer Ps needed
increased statistical significance because of deceased random error
disadvantages of repeated measure design
order effect
practice/learning effect
fatigue effect
carryover effect
order effect
order in which treatments are presented affects the DV; includes contrast effect
practice/learning effect
performance on task 2 only improves because of increased familiarity/practice gained in task 1 (could be tempered through counterbalancing)
fatigue effect
opposite of practice effect; performance on task 2 is low from boredom, tiredness, etc from task 1
carryover effect
effects from treatment 1 affects performance in treatment 2; often deals with the time between treatments
Factorials
Notated by a “!”; the number that precedes the “1” multiplied by all numbers that come before it numerically
2! = (2×1)= 2
3! = (3×2×1)= 6
4! = (4×3×2×1)= 24
matched pairs design
aims to match people based on a participant variable; goal is to achieve the same equivalence of groups as repeated measures without the need to put ps through both treatments
Analysis of Covariance (ANCOVA)
allows for statistical equivalence of differences (ex- if the goal is to measure who can jump higher, you would need to statistically make ps the same height to get a true jump height measurement)
selecting research participants
if goal is to describe the population, you must use probability sampling
if goal is to test for a relationship between variables, nonprobability sampling can be used
straightforward manipulations
presenting written, verbal, or visual material to ps (ex- for memory and recall studies)
staged manipulations
involved acting, fake scenarios, deception; used to properly manipulate the variable (ex- doing a study to measure the effectiveness of assertiveness training but the real test was whether or not the ps asked for the pay they were promised after being shortchanged)
Using strong manipulations
Generally researchers want to use the strongest possible manipulation, especially in early stages when they are trying to support the existence of a relationship between variables. HOWEVER using the strongest possible manipulation is tempered by ethics (i.e a strong manipulation of fear or anxiety) and a potential decrease in external validity (the stronger a manipulation, the less likely it is to occur irl, thus decreasing its ability to applied to larger populations or daily life)
types of DV measures
self reported measures
behavioral measures- direct observation of behaviors
physiological measures such as GSR (measures anxirty through sweating and skin electricity), EMG (measures muscle tension), and EEG (measures brain cell activity)
behavioroid measures- measures behavioral intent
sensitivity of the DV
ceiling effect and floor effect
ceiling effect
task is so easy everyone does well, leaving little room for improvement
floor effect
task is so difficult everyone performs poorly
controlling for participant expectations
placebo effect
demand characteristics
placebo effect
ps given a fake treatment to see if the power of mind effects results
demand characteristics
ps figuring out hypothesis and having biased answers
single blind study
ps do not know whether they are part of the treatment or placebo group
double blind study
neither ps nor researchers know which group ps are in
expectancy effect
experimenter bias leading to skewed results
manipulation checks
attempt to directly measure if the IV has the intended effect on the DV (does it actually measure what its supposed to?)
F value
F =between group variability (÷) within group variablility
Goal is to have F value as large as possible
within group variability can be reduced by
people’s individual differences
setting the stage step of the experiment
Increasing the # of levels of an IV allows…
…us to test for curvilinear relationships (you need at least 3 data points); the more levels you have, the more detailed your data will be
Effects of increasing # of IVs
increasing external validity
allows for economic use of participants
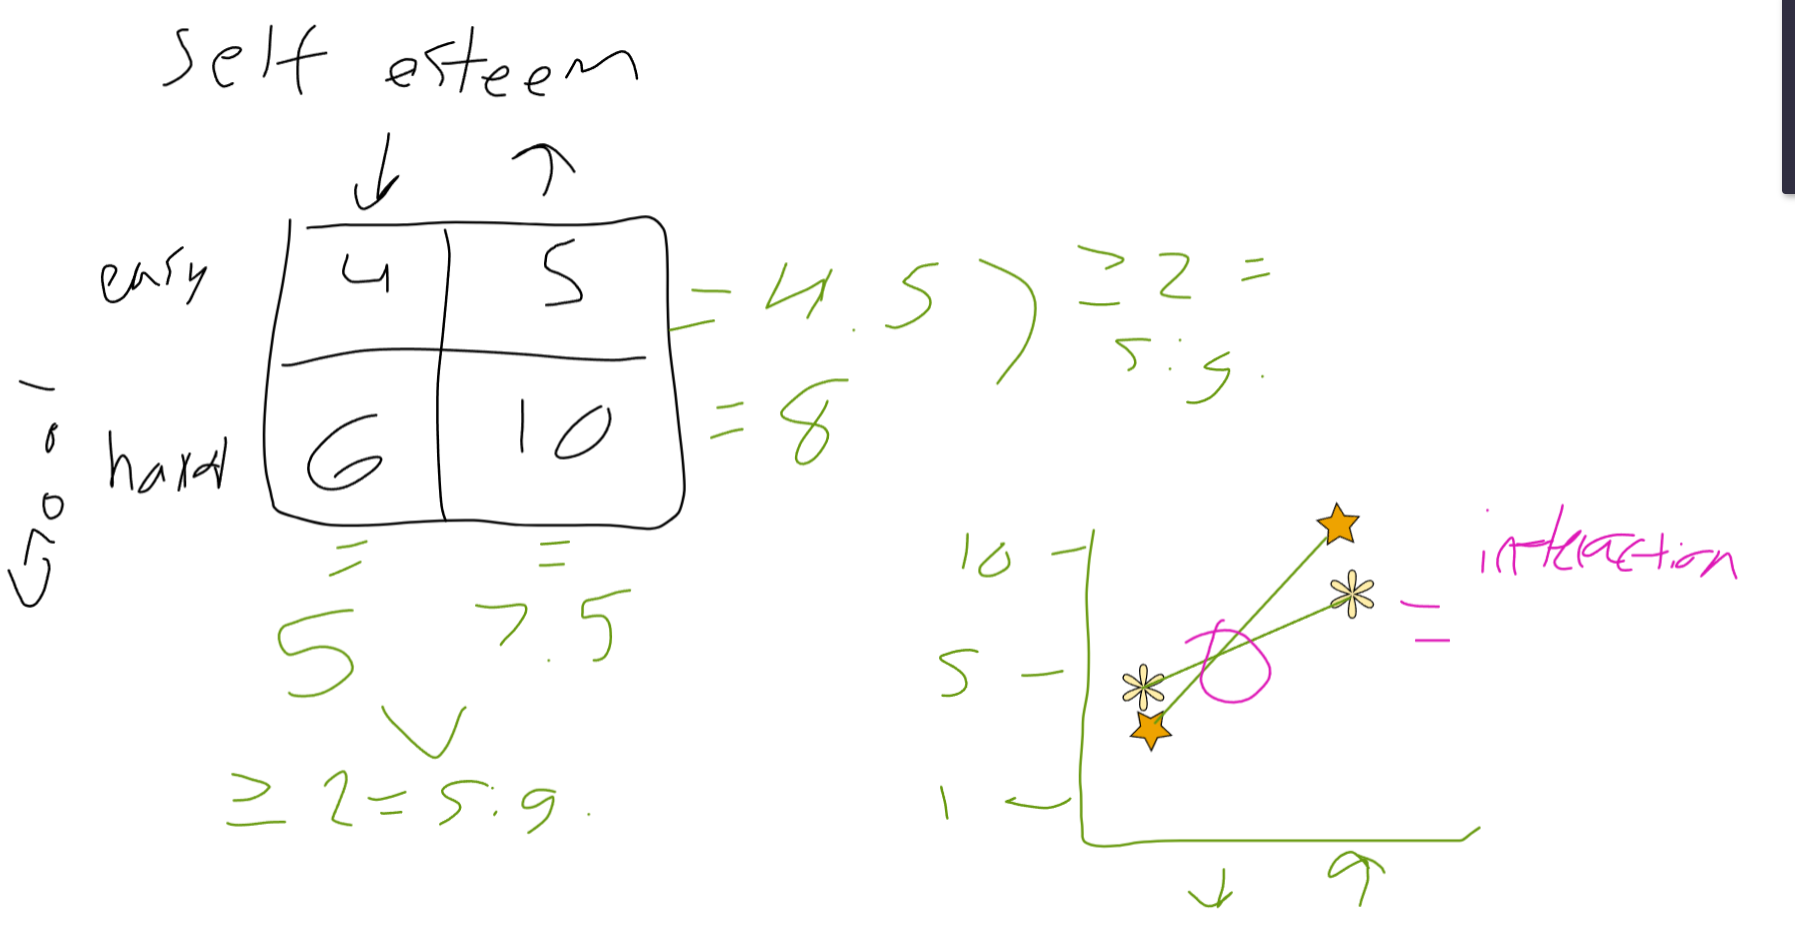
main effects
does the IV have an effect of the DV regardless of the other variable?
interaction
the effect of one IV on the DV depends on the other IV
simple main effects
compares the mean difference at each level of the variables
how to find # of conditions in an experiment
multiply numbers in format
When graphing data, how can you tell if variables interact with each other?
if when you graph the means of the main effects and connect the data points the lines/patterns are not parallel, there is an interaction
For purposes of this course/exam, what is the indicator of significant results?
If the difference between the two means is equal to or greater than 2
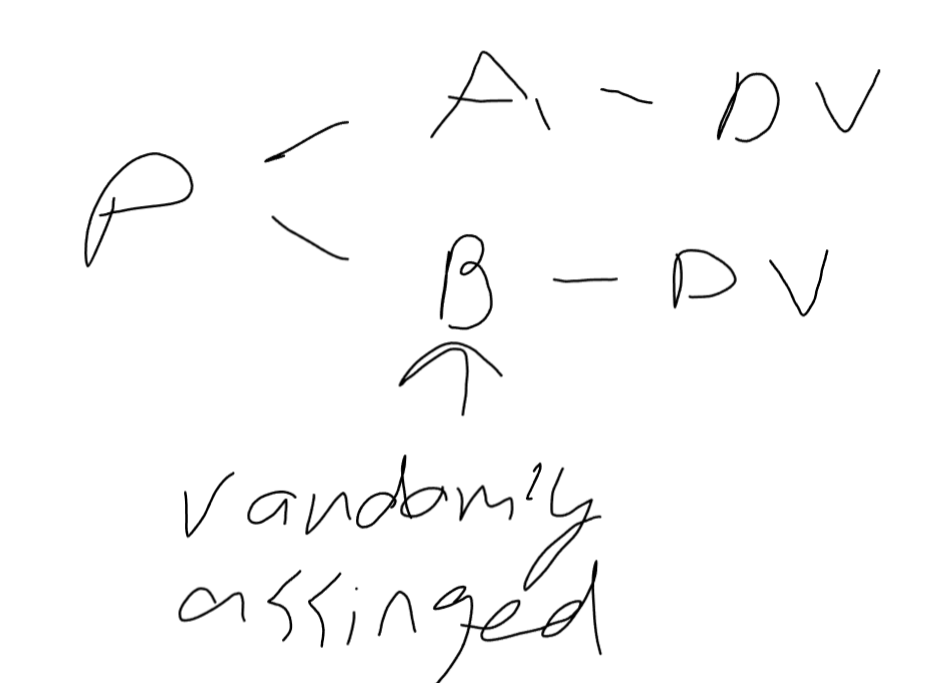
What is an IV x PV design?
any design where there is a manipulated variable (IV) and a participant variable (PV)
Participant variable (PV)
fixed; ps bring in this condition with them when the partake in the study.
Examples: self esteem (from class examples), sex/gender
Know how to solve and interpret basic data sets
Example