Biogeography and Wildlife Management
1/62
There's no tags or description
Looks like no tags are added yet.
Name | Mastery | Learn | Test | Matching | Spaced |
|---|
No study sessions yet.
63 Terms
Biogeography
study of the distribution of plants and animals over the surface of the earth in both a spatial and temporal context. There is more biodiversity near the equator and less towards the poles as well as with more altitude.
Central questions to biogeography
What species and populations are found where?
Why do they exist in the spatial patterns we observe?
Have they always existed in the distribution patterns we observe?
How are they adapted to the environmental conditions in which they live?
What environment or biological factors that restrict a species to its present range?
How will current and future environmental fluctuations affect these patterns? (ex: climate change)
How do human activities affect observed distribution patterns? How have they in the past? How will they in the future?
Hierarchy
Populations: large groups of individuals
Communities: assemblages of species of different populations
Ecosystems: interactions between biotic and abiotic elements within and between communities
Spatial Scale
An ecosystem could be as small as a rotting log or as big as a biome. It is how populations arrange themselves in space relative to environmental conditions and each other.
Temporal scale
Phenomena can be observed for minutes to millennia. What you learn about a population depends on when you gather data. (during breeding season migration, lifespan, over generations, throughout its evolution)
Human Impact
Humans have a profound impact on the spatial distribution of organisms on earth. We redirect energy pathways from the natural world unto our fabricated world. Some impacts include: more species around, altered habitat, changes to water chemistry, and endangered and extinct species.
Wildlife
We define what wildlife is based on use and significance to us. They are un-domesticated animals. There is consumptive wildlife (taking it out of nature) and non-consumptive wildlife (using it without taking it out of nature)
Wildlife Management
The use, protection, and control of wildlife, manipulate the populations and animals for human benefit. There is a goal set out and we use ecological principles to achieve the goal. There is preservation (not doing anything to the species) and conservation (sustainably using the species for a purpose). The management can be broken down into active (doing something, making an impact) and passive (observing but not doing anything), the combination of these is adaptive management (doing active or passive management depending on what the species needs with lots of monitoring)
Management Goals
Active management goals include making a population increase or decrease and harvesting the population for a continuing yield. Passive management goals include doing nothing but monitoring the population.
Classifying Wildlife
The classifications are not mutually exclusive, the more generalist a species is the more categories it will fit.
Farm species: non-domesticated animals taken in to farm (ex: pheasant)
Forest and range species: work along with human activities (ex: elk)
Wilderness species: affected by human activities and need pristine wilderness to survive (ex: puma)
Migratory species: they have 2 core ranges that depend on the time of year (ex: canadian goose)
Furbearers: animals in the wilderness that are hunted (ex: beavers)
Predators: animals that are higher on the trophic food chain (ex: wolf)
Rare and endangered species: animals at risk, in danger of extinction because of human activities (ex: burrowing owl)
Urban wildlife: wildlife that are in cities (ex: raccoons)
Park wildlife: require protected areas to survive well (ex: moose)
The process of wildlife management
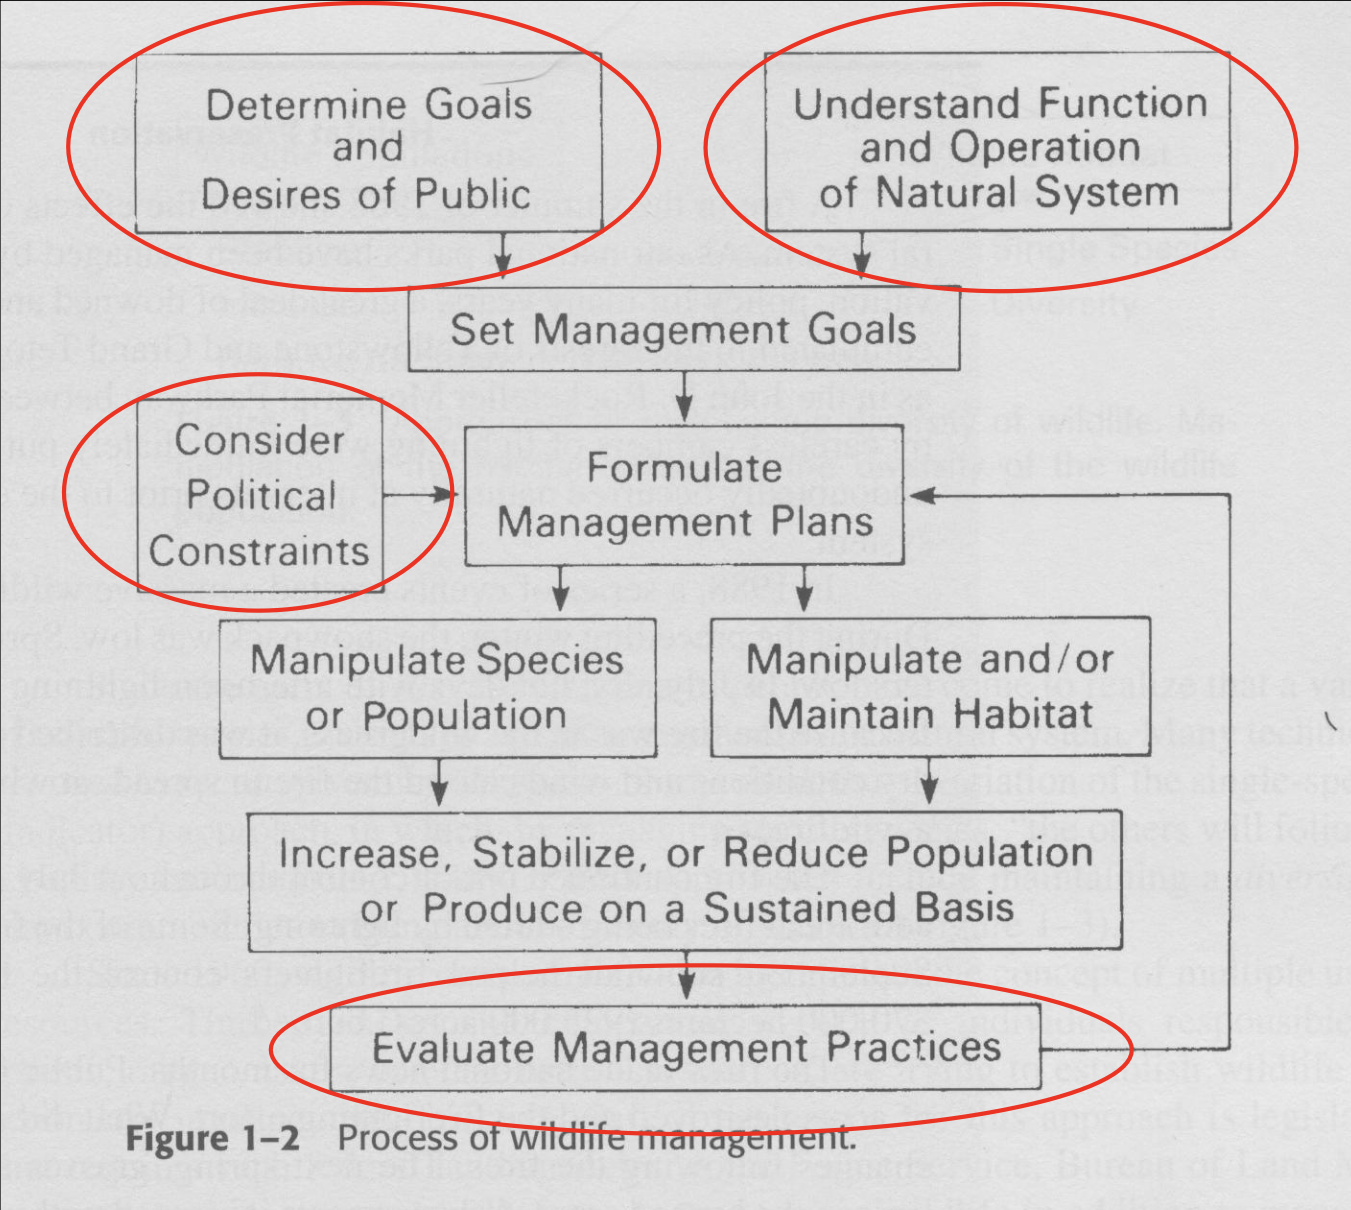
Wildlife Management Controversy
People often find the restrictions and legislations that come with management to be annoying or they disagree. An example is with Manatees who live in shallow waters, many get hit by bot propellors, the restrictions out inlace made many people upset that they couldn’t use parts of the water recreationally. Another example is with Wolves that were reintroduced to Yellowstone and changed the ecology (less deer and more trees) creating conflicts
Population
The birth rates, death rates, age variation and more. They rise, fall, and move. A population is a group of the same species that live in the same place that can reproduce with one another. The strongest relationships are between what it eats and what eats it.
Genetic Diversity
interbreeding from different populations of the same species
Range
Where you can find the population, it can expand and shrink. It is not exact but rather a generalization. It has a connection to habitat
Migration
Animals with seasonal ranges migrate to the different ranges. There are short and long migrations.
Wildlife Management Perspective of Populations
The smallest subunit that a group of animals of the same species is self-sufficient and can interbreed. They can become separated by humans and start to behave differently.
Birth Rate
The number of offspring a population produces per unit time, the average per female. A crude birth rate is how many births per 1000 individuals. K and R selected species have very different birth rates because K have many young and give them less care while the R have few young and give them lots of care. The realized birth rate is the net number of offspring that survives and becomes part of the breeding population.
Growth Rate
The net increase or decrease in a population per unit time, there is fluctuation year to year, generation to generation. Affected by resources, habitat, hunting, and predators.
Death Rate
the number of individuals that die per unit time, it used used to determine causes of deaths and how to prevent it in the future.
Life Tables
Examine the history of a population looking into details like the age classes, mortality, and life expectancy
Survivorship Curves
Examine the life history of a population, 3 types: I is K-selected species, II is those with the same survivorship throughout life, and III is R-selected species
Age Structure
The number of individuals in each age category
Alloparenting
When a non-parent helps raise the young, generally those who are aged and post-reproductive animals. Some young never leave their mom
Genetic Composition
The total genetic material within a population, the more genetic variability the more adaptations. Small populations may experience genetic abnormalities (changes in gene frequency). The minimum viable population is the smallest population size that is genetically sustainable. Population that have low numbers struggle with genetic diversity, ex: Cheetahs have limited genetic variability, 99% similarities. A genetic bottleneck is when a small group survives something and grows larger, with little genetic diversity
Biodiversity
A measure of biological diversity at a given spatial scale, the number of species or variety of an ecosystem. A species consists of a series of populations that can be adjacent or fragmented and they can experience behavioural differences. There is variations within species, populations, and ecosystems.
Structure
The pattern that biomass is arranged in, in horizontal and vertical layers
Composition
A list of the niological species that inhabit an area
Alpha Diversity
Species diversity of a local community
Beta Diversity
Change in a species composition between two communities
Gamma Diversity
Total species richness over a large geographic area such as a biome, continent, or ocean basin
Number of Species
Estimates from 5 to 30 million, a conservative estimate is 12.5 million. Scientists have catalogued around 1.8 million, and some are poorly described and understood. Some species may be grouped as one but are actually two while others may be considered multiple but is actually one. Many species are undiscovered, mainly those who are at the bottom of the trophic pyramid
Olingo’s and Olinguito’s
Originally thought to all be Olingo’s, but were found to be both when a zoo had two Olingos that wouldn’t mate and found out they were two different species
The Alias Problem
Many of the same species get recorded as multiple species, and example is beetles that have been recorded only once at the site of their identification.
Rates of Extinction
It is difficult to establish because the calculation is based on our estimates of how many species exist, especially with microbes. The majority of extinctions are caused by habitat loss so we can estimate extinction rates based on biodiversity estimations in a habitat. Extinct is when there are no more of that species, extant is when they exist. It is a natural process but it is accelerated by human activity
Biodiversity Across Spatial Gradients
Biodiversity across the earth is far from Eva, in general it increases towards the tropics. High potential evapotranspiration means there is high species richness and high potential primary productivity means the is high species richness.
The Latitudinal Biodiversity Gradient
More area means more immigration, more immigration means more biodiversity. More area means more access to resources and energy which means more biodiversity. More area means less extinction, less extinction means more biodiversity.
Bat Diversity
Bats account for a large percentage of the growth in animal diversity in the lower latitudes, this can be attributed to their diet and the prominence of frugivores and insectivores
Tropical Rainforests
They have 3 peak biomass layers and an emergent layer at the highest level. Each of these layers provides another habitat area with unique ecological richness. More structure means more habitat means more richness
Biodiversity Hotspots
Areas with high biodiversity, different animals have different hotspots. There are 17 terrestrial hotspots equalling 1.32% of global land area and they contain 50% of the world’s terrestrial species.
Wallacia Hotspot
There are:
10 000 plant species with 15% endemic
1142 terrestrial vertebrate species with 46% endemic
45% remaining forest cover with only 15% being pristine
The Wallace’s line is a line that divides two places where the species on each side evolved independently of one another and later came together
Biodiversity Across Temporal Gradients
How species assemblages change over time helps us understand rate of biodiversity change. It is very difficult to do over millions of years because some species don’t fossilize well, but over shorter periods it is very informative. This is termed succession. Ex: retreat of glaciers at the end of the ice age, the melting glaciers leave poor soil, pioneer plants come in and fix the nutrients improving the quality, then tree like poplar and willow are able to grown, once again adding more nutrient, the increase in biomass results in a more complex canopy structure that increases the diversity of animal species.
Forest Gaps
A tree dies and creates a gap where the sun can now reach the ground, grasses, shrubs, and small trees begin to grow filling in the gap
Climax Communities
Heterogeneous mosaic of patches in different stages of succession after small scale disturbances (ex: fallen tree) or large scale disturbance (ex: forest fire). An absence of disturbance causes low biodiversity.
The Intermediate Disturbance Hypothesis
Ecosystems subject to moderate amounts of disturbances generally maintain high levels of biodiversity. Ex: warblers need young jack pine to survive, no disturbance leave them with no habitat and too big of disturbance also leave them with no habitat.
COSEWIC and Species at Risk Act (SARA)
SARA established COSEWIC in 2003. It is disconnected by design, the decisions need to be handled by scientists not the government. It requires that the results be posted to the Canadian government and the public. The minister for environment and climate change Canada has to provide an official response to the assessment results. The meetings are open to the public and they issue a report to the minister and public each year
Legal Protection
The assessments do not take political, social, or economic factors into account. The wildlife species that have been designated by COSEWIC may qualify for legal protection and recovery under SARA. It is up to the government to legally protect these wildlife species.
COSEWIC Assessment Process
It is based on a combination of science, aboriginal traditional knowledge, and community knowledge about the species and environment. They include information on personal experience and culture to inform about current and/or past population distribution and abundance, habitats and availability, life history traits, ecological relationships, and potential threats
IUCN Red List
An international union foe conservation of nature, there is a red list of threatened species that offers the worlds most comprehensive overview of the conservation status of animals, fungi, and plants. There are other lists of threatened species out there including national and regional lists used to guide government policy. Focus on particular groups of animals or plants
IUCN Red List Assessment Process
Anyone with sufficient knowledge of a species can submit it to the IUCN for consideration. Based on the population size, population decline or increase, geographic range, and risk of extinction It is an open process and the vast majority of assessments are completed by staff and volunteers of the IUCN’s various partner organizations and networks.
Habitat
the resources and conditions present in the area. The preference for different habitats is based on the use of some resources over others. The selection is a hierarchical process involving a series of behavioural decisions at a different scale. The selection is broken down into first order (geographical range), second order (home range of a population or individual), third order (home range components and uses for different behaviours), and fourth order (how the third order is carried out). The availability of habitats is based on accessibility or components. The quality is based on its ability to provide resources for the populations.
Critical Habitat
The biotic and abiotic elements in the environment essential to conservation. They change with respect to climate change. We look at what the species needs to survive and ecological niches are important for understanding how a species ended up where it is and when.
Limits of Distribution
A species is surrounded by areas where it cannot maintain a population, barriers to their dispersal. The barriers include weather, predators, water, etc. Any species is a prisoner of their own evolution and some are more restricted than others. Ex: palm tree live in tropical or subtropical areas, they only have a single growing point at the apex of the stem, if the top of the tree is damaged by frost the whole tree dies, making them limited by frost sensitivity
Endemism
Organisms that are confined to the area in which they evolved are endemic to that region, can’t live anywhere else. Paleoendemic are those confined by physical barriers and Neo-endemic are those confined because it has recently evolved and hasn't had time to spread. Many endangered species are endemic with restricted distribution. Canada’s only endemic endangered species is the Vancouver island marmot
Overcoming Barriers
Some individuals had to cross in inhabit barrier to have spread in certain areas. Some causes for these moves could be resource issues (running low, competition, predation), weakened climatic barriers (climate change that leads to changes in habitat distribution), and geological time scale (land mass distribution changes, mainly with climate and meeting other land masses)
Accidental Movements
Organisms can cross barriers by accident due to storms (blown off course, rafts broken off land) and wandering (forced to search for food). Accidental migration doesn’t always result in colonization as you need at least one breeding pair for successful colonization. Ex: cattle egret ride on large herbivores waiting for food to be kicked up to them, a group was blown into northern South America and were able to colonize and spread out, mainly because of cattle and horses
Dispersal
A continuous process that often takes place in a currently established range due to geographic barriers. Intra-range dispersal or ecological dispersal is when it is within a range, long-range dispersal is when it is beyond the current range (infrequent and random). Extra-range dispersal or biogeographical dispersal is long-range dispersal, it is less common because organisms can’t always survive crossing larger or harder barriers. Passive dispersal requires an outside force such as wind, water, or mammals to move the organism. Active dispersal requires the organisms to move under their own power.
Method of Dispersal
Anemochores are dispersed by wind (ex: dandelions)
Hydrochores are dispersed by water (ex: crab larvae)
Anemohydrochores are dispersed by wind or water (ex: trembling aspen)
Zoochores are spread by animals. Eco-zoochory is carried or stashed by the animal, end-zoochory is when it is eaten and later pooped out by the animal. (ex: ragweed)
Diffusion
Species expand their range by moving into closely adjacent areas, each succeeding generation may expand the range slightly. Most terrestrial plants expand by diffusion. Some species diffuse quicker than others based on high dispersal ability, short generation time, generalism, can also be alien species. Some disperse very slowly, slow penetration diffusion
Jump Dispersal
Periodically species will disperse over a large distance quickly, often crossing barriers. The new populations can be colonized thousands of kilometres away from their traditional range limits. This is more likely for plants with light seeds, flying animals, and propagules. Ex: Krakatoa exploded and destroyed all life, over time it was recolonized bringing it almost back to normal
Geographic Agents to Dispersal
Geographic feature that promote dispersal are biogeographic corridors, and they are relative to barriers, Something that is a barrier to one species could be a corridor to another such as mountains, Biogeographical harmonization is when similar species are on both sides of a corridor.
Filters
Avenues of dispersal that are not favourable for all species, there are physical environment filters (ex: temperature and moisture) and biological filters (ex: competition and predation). As a result the organisms on both sides of the corridor will remain distinctive.
Isthmus of Panama
North America and South America were separated 16-3 million years ago, eventually subduction formed an isthmus. The mammal species in SA evolved in isolation and were mainly marsupials, mammal species in NA represented native families a well as colonizers from Eurasia, mainly placental species. The early landscape was savanna and forests and allows movement for many species. The isthmus acts as a corridor and barrier, the dense tropical forest that formed acted as a filter to grazing species and the tropical species could traverse the isthmus. The savanna and desert environments of northern Central America and Mexico act as a barrier to the tropical species.