3.3 Revenues, Costs and Profits
1/89
There's no tags or description
Looks like no tags are added yet.
Name | Mastery | Learn | Test | Matching | Spaced | Call with Kai |
|---|
No analytics yet
Send a link to your students to track their progress
90 Terms
production
process that converts inputs into outputs
productivity
increasing outputs from existing inputs
short run
a time period in which at least one factor of production is fixed
long run
a time period in which the scale of all factors are variable
factors of production
land, labour, capital and enterprise
the law of diminishing returns
short run concept - as more and more of a variable factor (labour) is added to a fixed factor (land/capital), eventually the marginal returns of the variable factor begin to fall
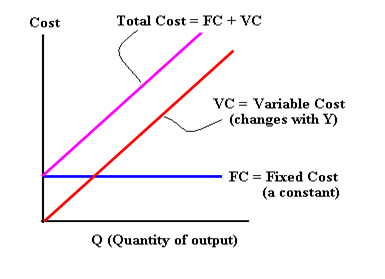
fixed costs
costs that dont change depending on output
variable costs
costs that change depending on output
average costs
total costs/output
marginal costs
cost of producing one more good
change in costs/ change in quantity
total costs, variable costs and fixed costs graph
marginal costs and average costs short run graph
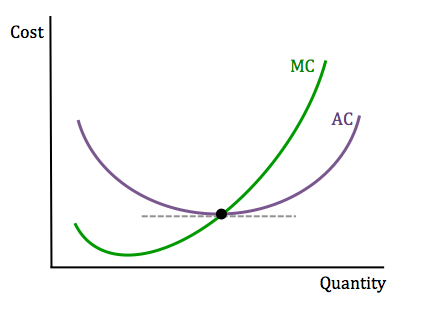
why is the graph a curve
due to the law of diminshing returns
productive efficieny
when marginal costs = average costs
why does marginal costs hit average costs at its lowest point?
because of the relationship between them:
when marginal costs are below average costs it brings the average down
when marginal costs are above average costs it brings the average up
therefore the point of intersection is the minimum point of the curve
returns to scale
how a firm's output changes when all inputs are increased proportionally
increasing returns to scale
a situation where output increases by a greater proportion than the increase in inputs
constant returns to scale
a situation where output increases by the same proportion than the increase in inputs
decreasing returns to scale
a situation where output increases by a smaller proportion than the increase in inputs
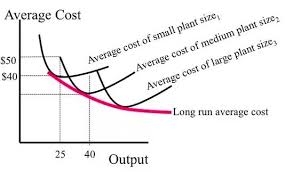
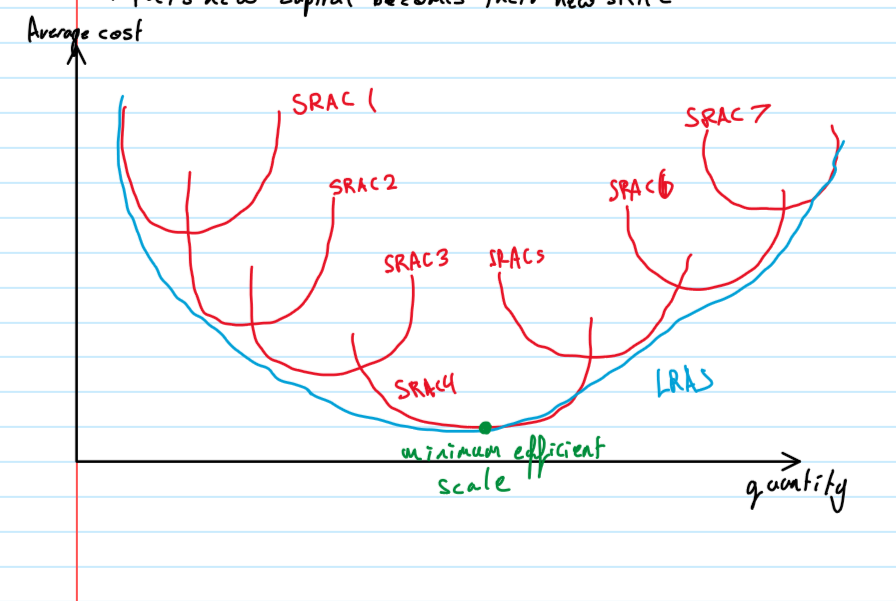
average costs long run graph
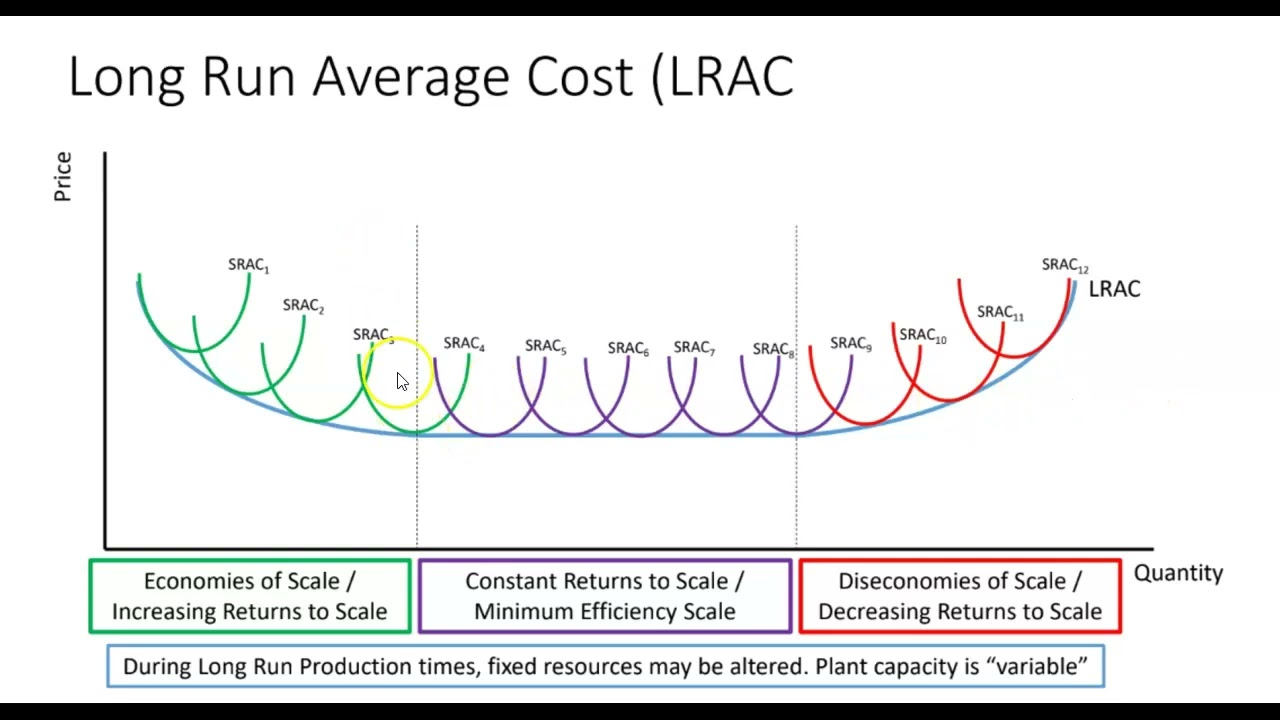
what is the long run curve made up of
small short run curves which represent a paticular size of the firm
economies of scale
fallling averge costs of production that result from an increase in level of output
internal economies of scale
arise from the increased output of the business itself
technical economies of scale
large firm could use computers and technology to replace workers on the production line
able to trasnport bulk materials
mass production means that unit costs are lower
using technology
purchasing (commercial) economies of scale
large businesses can employ specialist/expert staff - the most talented buyers know where to get the best deals
Bulk buying - being able to buy goods in bulk lower the unit price, large firms have warehouses to store the goods in
marketing economies of scale
advertising costs can be spread across many stores - as the cost of a television becomes cheaper “per store” you can “bulk buy” adverts
large business can employ expert staff
financial economies of scale
easier for large firms to raise capital, better lending terms
risk is spread over products
greater potential finance
managerial economies of scale
more specialised management can be employed
best workers want to work for large firms
external economies of scale
occure within an industry: all competitors benefit as the industry gets larger, all firms in an industry will benefit from lower average costs
diseconomies of scale
rising average costs of production that result from an increase in levele of output
examples of diseconomies of scale
difficult communication
cost of adminestration and co-ordination
alienation and low productivity
regulatory differences in different country
growth of corporate bureaucracy - excessive layers of management
loss of focus from core objectives
increase demand for raw materials - D.pull inflation
labour becomes scarce → increase wages to attract labourers
LRAC for a firm with a strong incentive to grow
the firm experiences productive efficiency at high output, therefore are likely to become larger
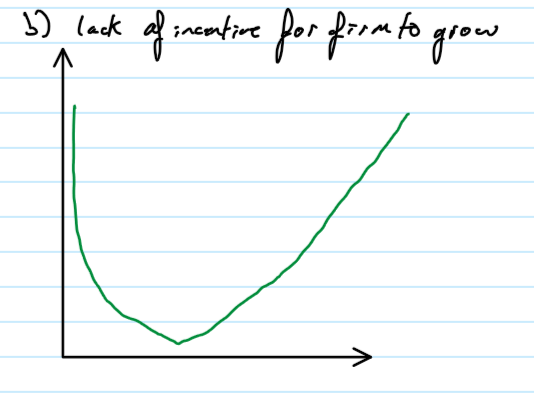
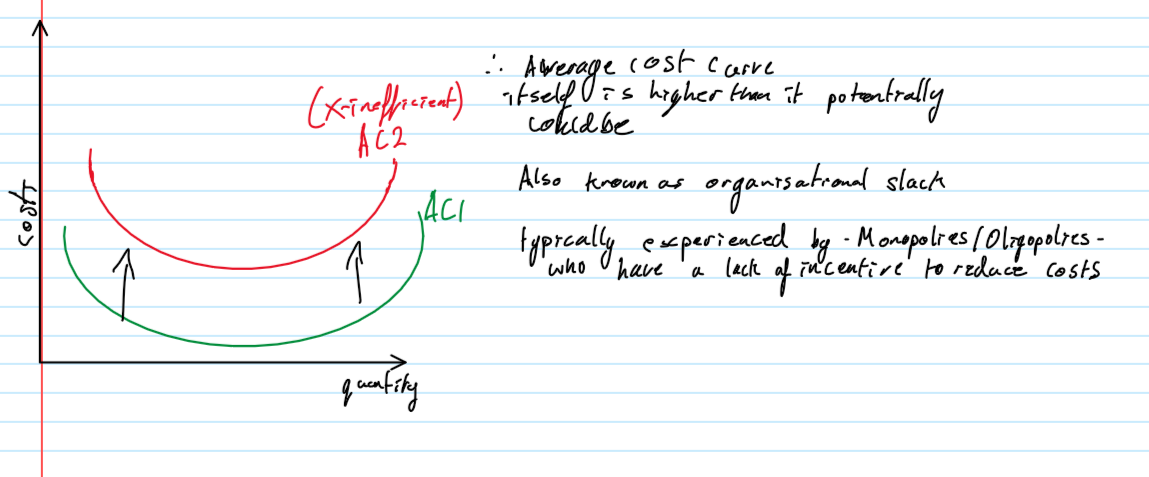
LRAC for a firm with a lack of incentive to grow
the firm experiences productive efficientcy at low output, therfore diseconomies fo scale are likely to occur sooner so less likely to grow
minimum efficient scale
the output of a business in the long term where the economies of scale have fully been exploited
it corresponds to the lowest point on the LRAC curve
how to change quantity produced in the short run vs the long run
in the short run, you would have to operate at maximum output i.e turn your machine (capital) up or down
this is because capital is fixed in the short run
however in the long run capital is not fixed, therfore the can purchase new capital to produce more.
this new capital becomes their new SRAC
productive efficiency
the ability of a firm to produce goods or services at the lowest possible cost, given the level of output and the available technology
where MC = AC
allocative efficiency
when resources are allocated in a way which maximises consumer satisfaction (utility)
on a diagram this is where MC = price
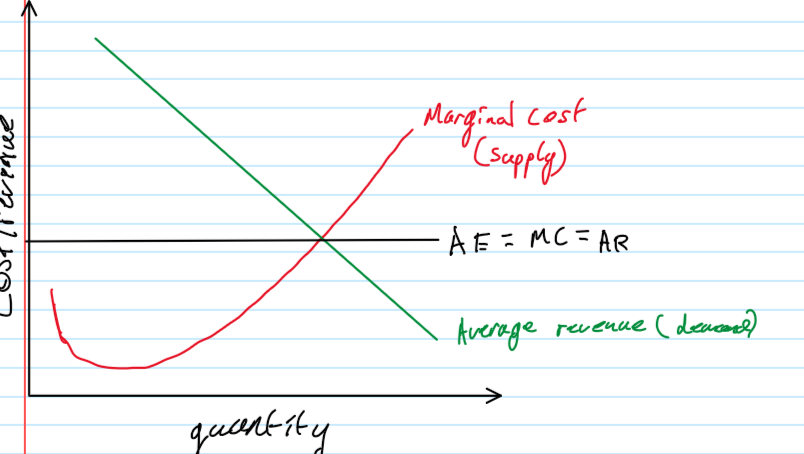
marginal costs curve

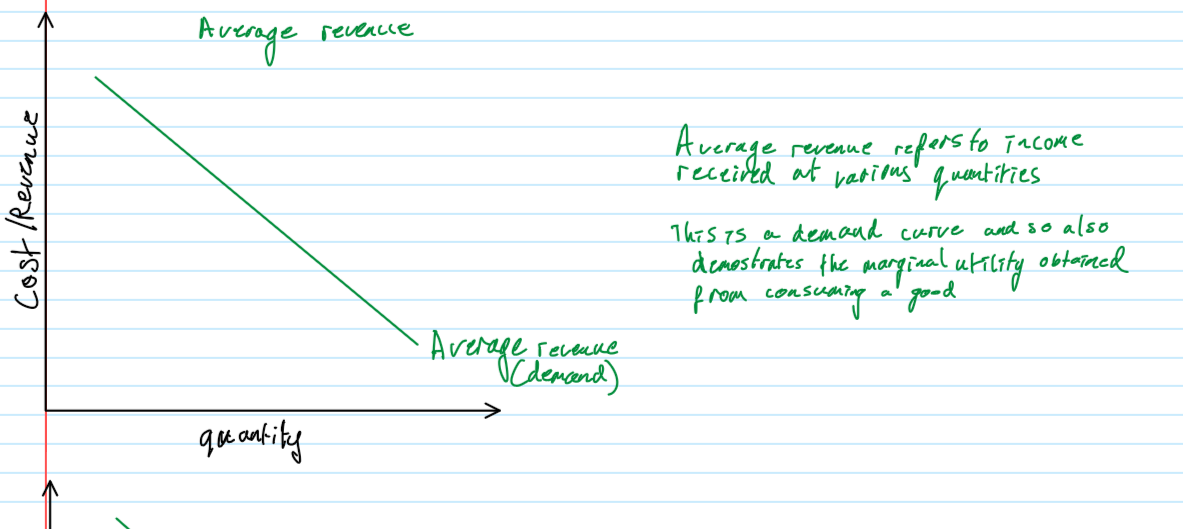
average revenue curve
X-inefficiency
the economic concpet that a firms costs are higher than they should be due to factors like mismanagement, lack of competitiveness and poor motivation, preventing it from operating at maximum efficiency
Dynamic efficiency
as a firm grows they can access more resources
paticularly access to technology e.g. AI,apps,driverless cars
its about reducing costs and improve quality over time
sunk costs
costs that are required to start-up the firm and cannot be recovered if the firm closes down
revenue
money received from selling your products
price x quantity sold
marginal revenue
revenue from the sale of an additional unit
average revenue
total revenue / quantity sold
price makers
businesses that have enough influence in the market to set their own price
price takers
businesses that dont have enough influence in the market and have to accept the market price
how will the MR curve look compared to AR curve for a price maker
will be 2x as steep
how does the MR curve look for price takers
firms who have no influence over price would have a constant MR received from each additional unit of output
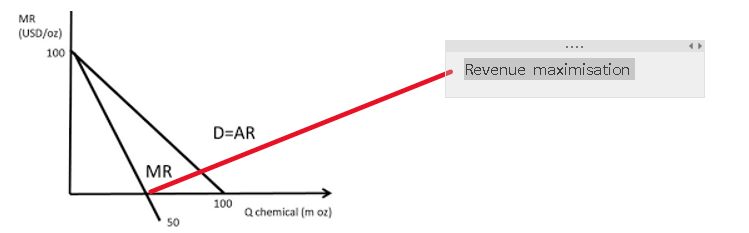
MR and AR curve
the point where MR hits the x axis is revenue max
sales maximisation
a business objective where a firm aims to sell as many units of a product or service as possible without making a loss
AC = AR
profit maximisation
the default quantity in which we assumer firms operate unless told otherwise
where MC = MR
profit maximisation for a price taker
where the 2 curves intersects sets the firm quantity, then the price is set by demand (AR/D)
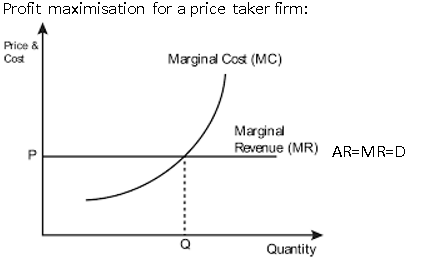
what happens if the firm produces profit less than Q
the marginal revenue from selling an additional unit is higher than the marginal cost of producing it, so the firm could generate even more profit by increasing quantity
what happens if the firm produces more than Q
the marginal revenue from selling an extra unit fails to cover the cost of producing the unit, so the firm could generate more profit by reducing quantity
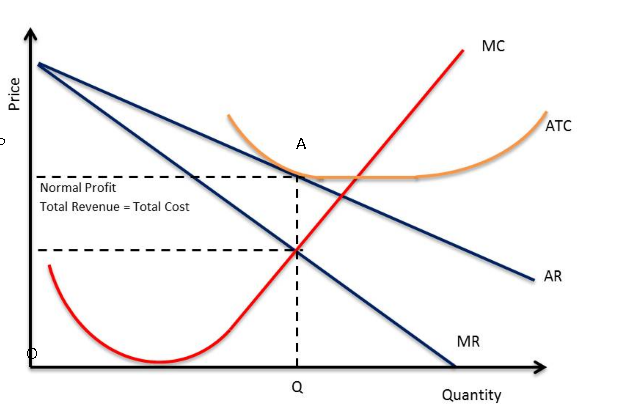
normal profit
the minimum level of profit necessary to incentivise a firm to remain in the market
it is not break even
this level of profit covers all the costs required to stay in business, plus a level of profit deemed satisfactory to continue trading.
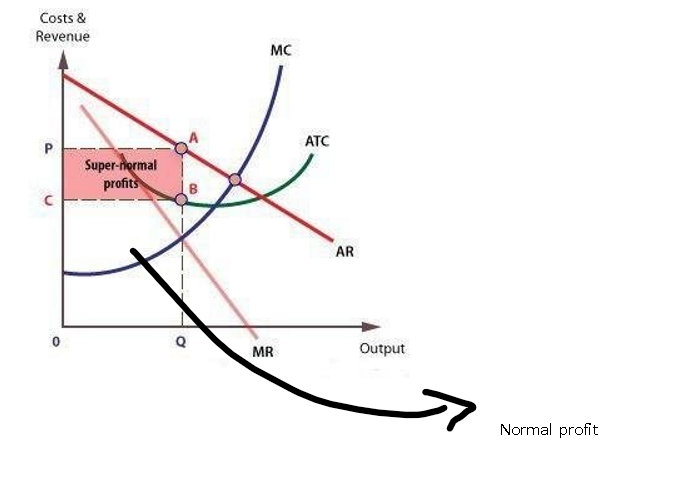
normal profit on a diagram
occurs where AR = AC, after the quantity has been established from MC = MR
The area OQAP = normal profit
Q is profit max
supernormal profit
extra profit above the level of normal profit, occurs where AR>AC
also sometimes known as abnormal profit
means there is an incentive for other firms to enter the market
supernormal profit for price makers
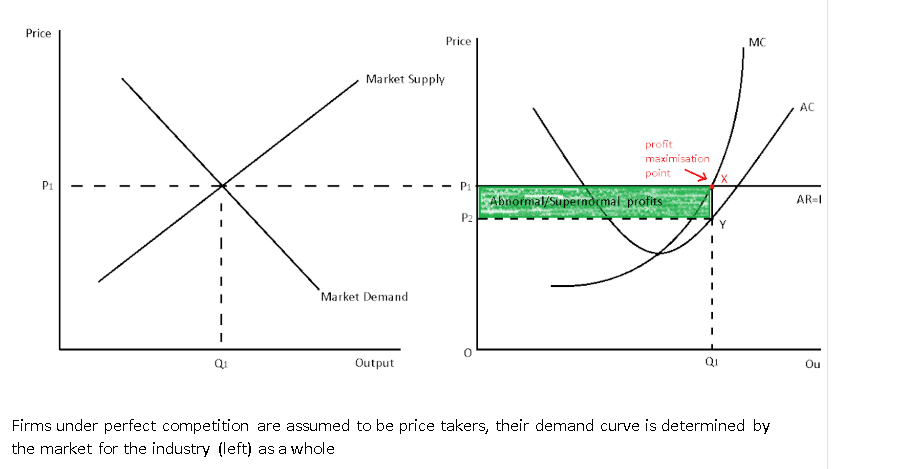
supernormal profit for price takers

perfectly competitive market assumptions
firms are profit maximisers MC=MR
many buyers and many sellers
homogenous (identical) products
free from barriers to entry or exit
perfect information for all buyers and sellers
firms are price takers - firms are a perfectly elastic demand curve
there is no ideal real life example of a perfectly competitive market
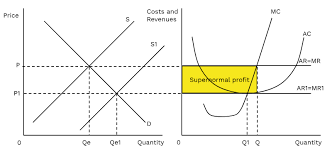
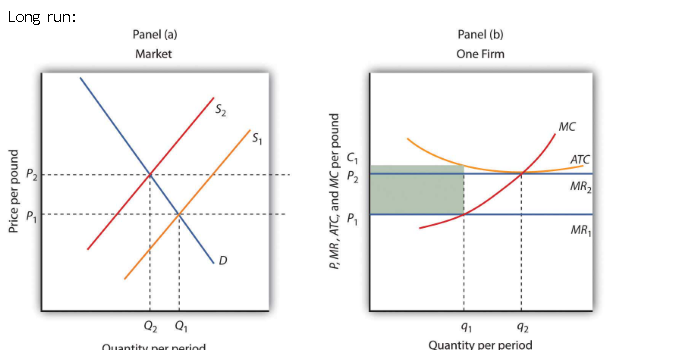
short run equilibrium under perfect competition acheiving supernormal profit
what happens due to supernormal profit in a market in the long run
due to supernormal profits made by incumbent firms, this attracts new firms to enter the market to take advantage of this opportunity, consequently, the additional firms means there is a greater supply in the market therefore leading to a lower market price, since the firms are price takers means that each firm has a lower price.
new firms will keep entering the market until the firms make normal profit
long run supernormal profit under perfect competition
short run loss making firms in perfect competition
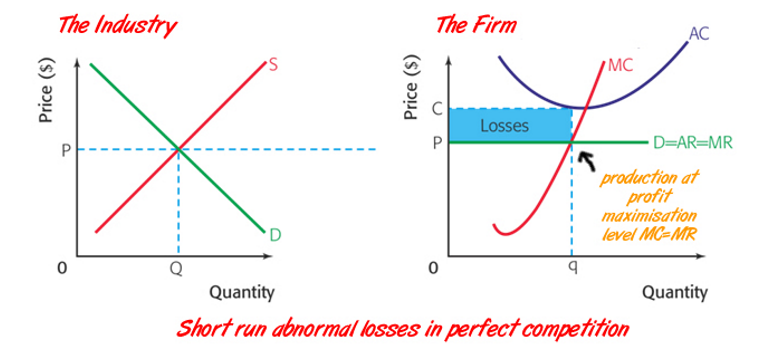
what happens due to loss in a market in the long run
as the firms make losses in the short run will leave the industry (no barriers to exit) and so supply will decrease. therefore the incumbent firm’s D/AR/MR curve will rise and so once again leaving the remaining firms to make normal profit in the long run
long run loss making under prefect competiiton
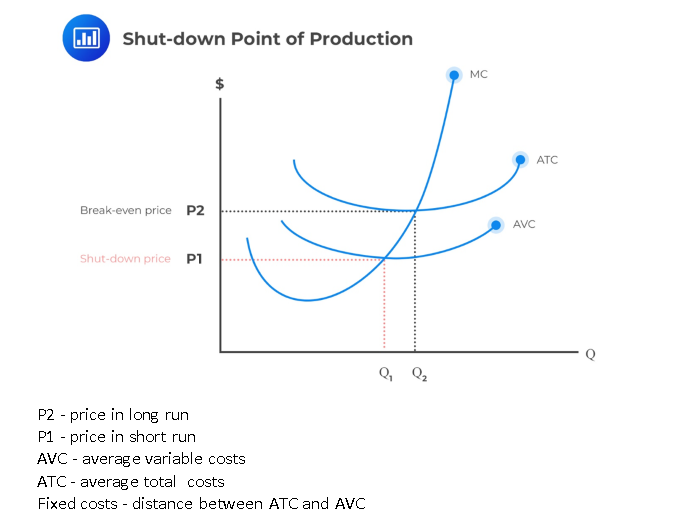
shut down point
for the firm to stay in business in the short run the price needs to be at least P1 to cover the costs of production (variable costs)
however the firm to stay in business in the long run the price needs to be at least P2, so the fixed costs are also covered remember ATC = (variable costs + fixed costs)/quantity produced
monopoly
a market structure where a single seller dominates the market with no close subsitutes for its product
legal definition: a firm that has a market share of at least 25% only a pure or natural monopoly will have 100% of the market which is a rare occurence
assumptions of monopoly markets
few sellers (maybe few buyers)
high entry and exit barriers
assymetric information
differentiating products
profit maximisers
price makers (to some extent)
supernormal profit
what profit does a monopoly make in the short run and the long run
supernormal profit in short run and due to high entry barriers it makes supernormal profit in the long run aswell
do monopolies operate at productive efficiency
(minimum point of cost curve): this is unlikely for monopoly, since they are not pressured by competition to minimize costs and operate at their lowest possible average cost
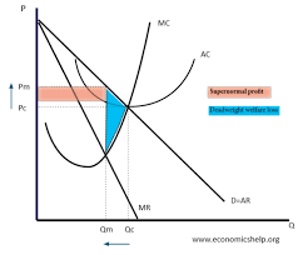
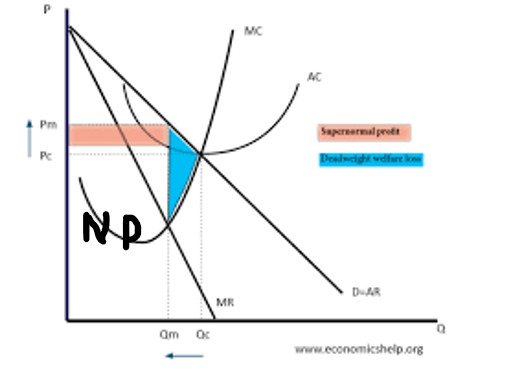
do monopolies operate at allocative efficiency
(producing what customers want, price = marginal cost): given that MR is below AR the price will always be above marginal costs and so is not allocatively efficient

why is the demand curve not perfectly inelastic
monopolies cannot charge whatever price they want
perfectly inelastic implies that no matter how high the price is that the monopoly could charge whatevery they want and the QD wouldnt change.
which isnt true
natural monopolies
where 1 firm dictates the whole markete.g. united utilities
an industry in which in order to reach productive efficiency, it is better for production ot be dominated by a single firm, rather than contested by several firms.
diagram for a natural monopoly
there is room for only one firm to fully exploit all the available internal economies of scale so one firm can supply a price lower than if there were 2 firms
MES can only be acheived at large output (likely to be 90-100% of market demand) thus LRAC curve is constantly falling

regulatory bodies in privatised monopolies
competition authorities will encourage competition to ensure low prices and higher quality, but in natural monopolies this isnt possible
regulatory bodies (Ofwat, Ofgem, ORR etc) monitor natural monopoly industries such as water, electricity, rail and telecommunications
key terms
PE - lowest point of AC
AE - where MC = AR
PM - where MR = MC
RM - where MR = 0
SM - where AR = AC
monopolistic competition
many firms that are selling products that are slightly differntiated therfore not perfect
Assumptions of monopolistic market
Many producers and many consumers
Slightly differentiated products - both actual (function and aesthetics) and artificial (branding)
Producers have some control over price
Barriers to entry and exit are low
Profit maximisers
Examples of monopolistic markets
Fast food
Restaurants
Clothing
Diagram for monopolistic firms in short run achieving supernormal profit
Just like the monopoly diagram but more elastic demand curve, allocatively and productively inefficient in both short run and long run, firms achieve supernormal profit
Diagram for monopolistic firms in long run
As a result of low barriers to entry, the supernormal profits attract other firms to enter the market which shifts the demand curve to the left as a result of the extra competition into the market, firms achieve normal profit
Diagram for monopolistic competition in the long run
Eventually long run firms will leave market making firms achieve normal profit
Contestability
How easy it is to enter and exit a market, refers to barriers to entry and sunk costs
Market that has low contestability
Difficult for new firms to enter an industry
Market that has high contestability
Easier for new firms to enter an industry
How can incumbent firms deter new entrants to the market With supernormal profit
Supernormal profit provides an incentive to firms, to stop this firm may choose to lower prices to where AC = AR (limit pricing), thus removing the incentive (firm making normal profit)
Mere threat of competition reduces price and increase output
Assumptions of Oligopolies
Dominated by a few, large firms (known as oligopolists)
Many firms in the market but the concentration ratio is high (maybe 100 firms but oligopolists have the majority of market share)
Product differentiation amongst firms - engaging in non-price competition
High barriers to entry
High risk of collusion
Firms are interdependent
Diagram for incumbent firms in monopoly
Operate at P1 Q1
Any action will lead to a reaction by the other oligopolists therefore all decisions must factor in potential reactions, due to this interaction the demand curve is elastic before p1