AP Statistics Chapter 1 Vocabulary
1/40
There's no tags or description
Looks like no tags are added yet.
Name | Mastery | Learn | Test | Matching | Spaced | Call with Kai |
|---|
No analytics yet
Send a link to your students to track their progress
41 Terms
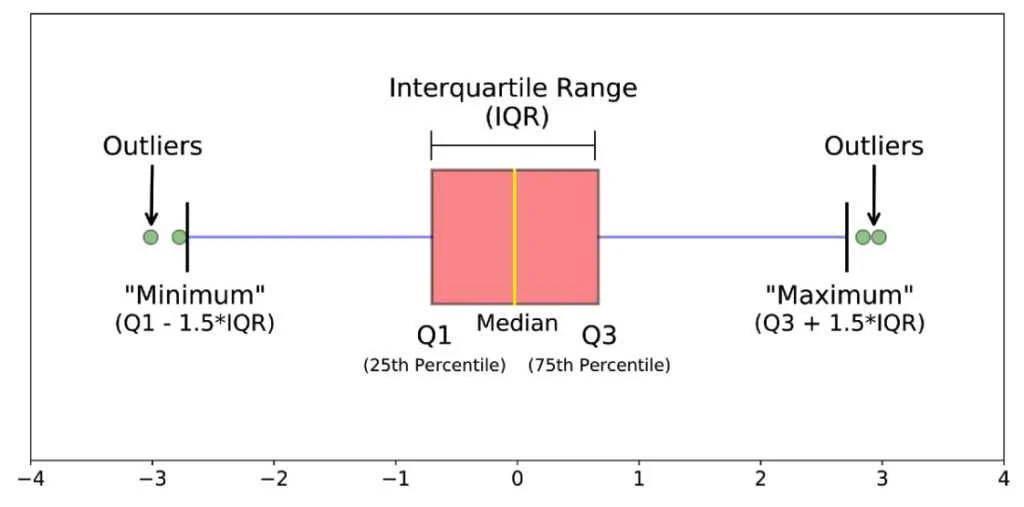
1.5 x IQR Rule for Outliers
Low outliers: Q1-1.5(IQR) if values are below, it’s an outlier
High outliers: Q3+1.5(IQR) if values are above, it’s an outlier
Association
Exists between two variables if the value of one variable helps predict the value of the other
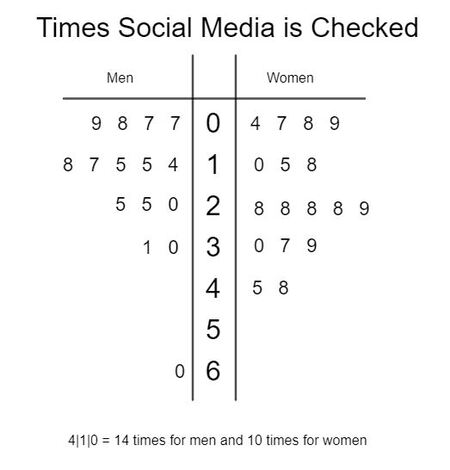
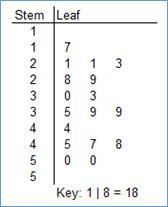
Back-to-back stemplot
Stempolot where the leaves on each side are ordered out from a shared/common stem
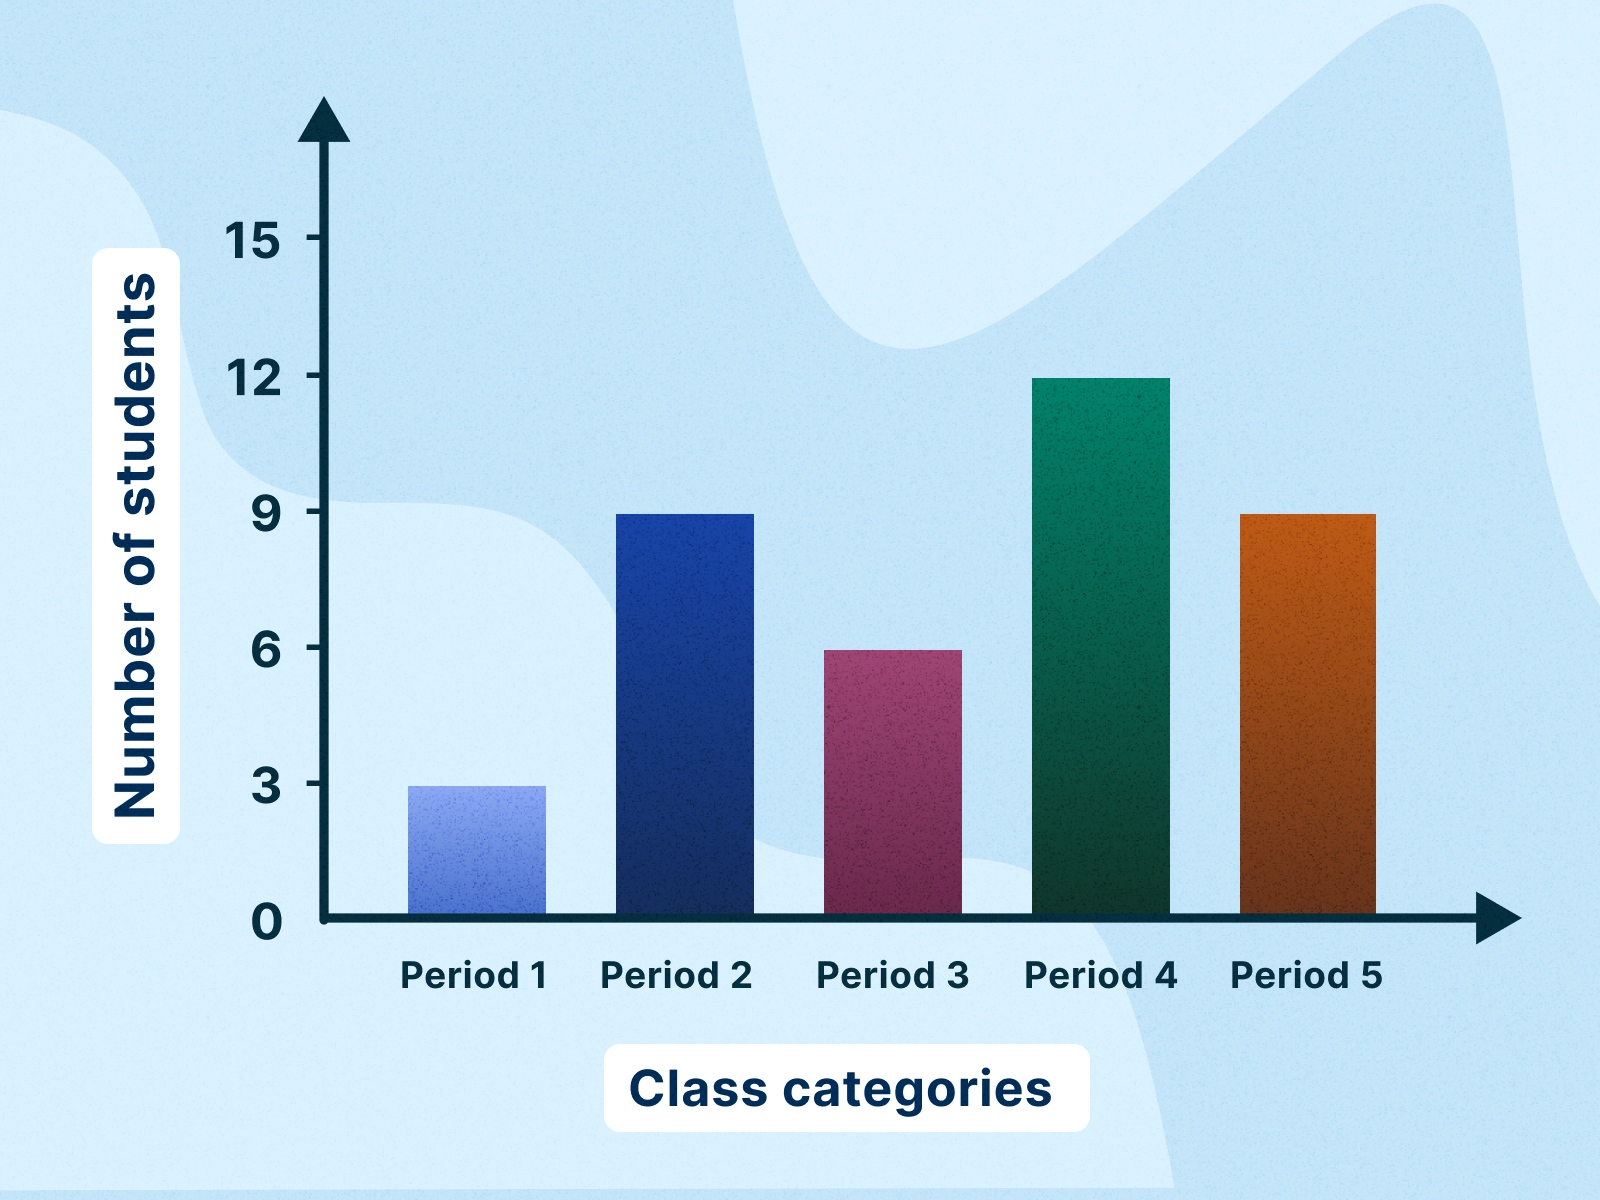
Bar graph
Shows each category as a bar, with heights showing each frequency or relative frequency
Bimodal
a graph with two clear peaks
Boxplot
Graph made from a five-number summary of a data set; outliers are graphed as points
Categorical Variable
variables that place individuals into groups; favorite color, music genre, state, gender)
Conditional Distribution
Describes the value of a variable among individuals who have a specific value of another variable
Data analysis
The process of organizing, displaying, summarizing, and questioning data
Distribution
tells us what values a variable takes and how often (frequency)
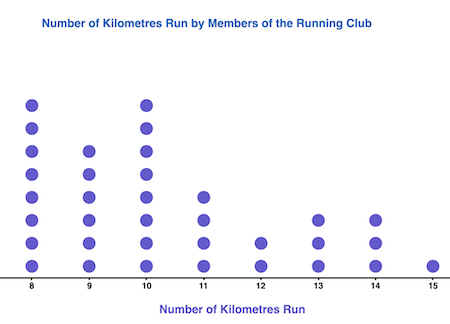
Dotplot
Shows each data value as a dot above its location on a number line
First quartile (Q1)
In a five-number summary, the value that are one-quarter up on the list of observations; first 25% of the data
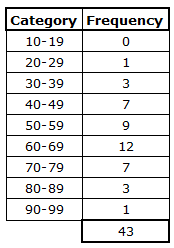
Frequency table
A table displaying frequencies/counts in various categories
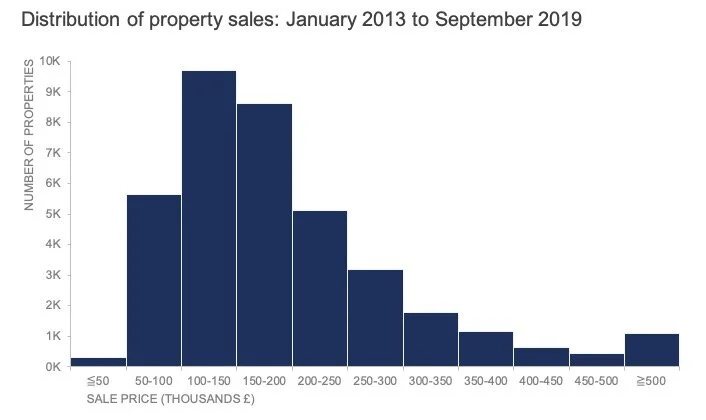
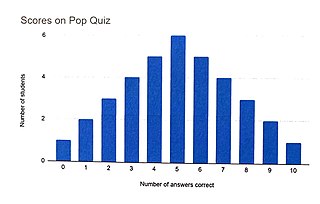
Histogram
Shows each interval of values as a bar; heights show frequencies (counts) of relative frequency of each value; quantitative, needs at least five bars to be accurate
Individuals
Objects described by data (the who!)
Inference
A conclusion that goes beyond the given data
Interquartile range (IQR)
The distance between the upper and lower quartiles; IQR = Q3-Q1; very resistant to extreme values
Marginal distribution
the distribution of values of one categorical variable in a two-way table among all individuals described in the table
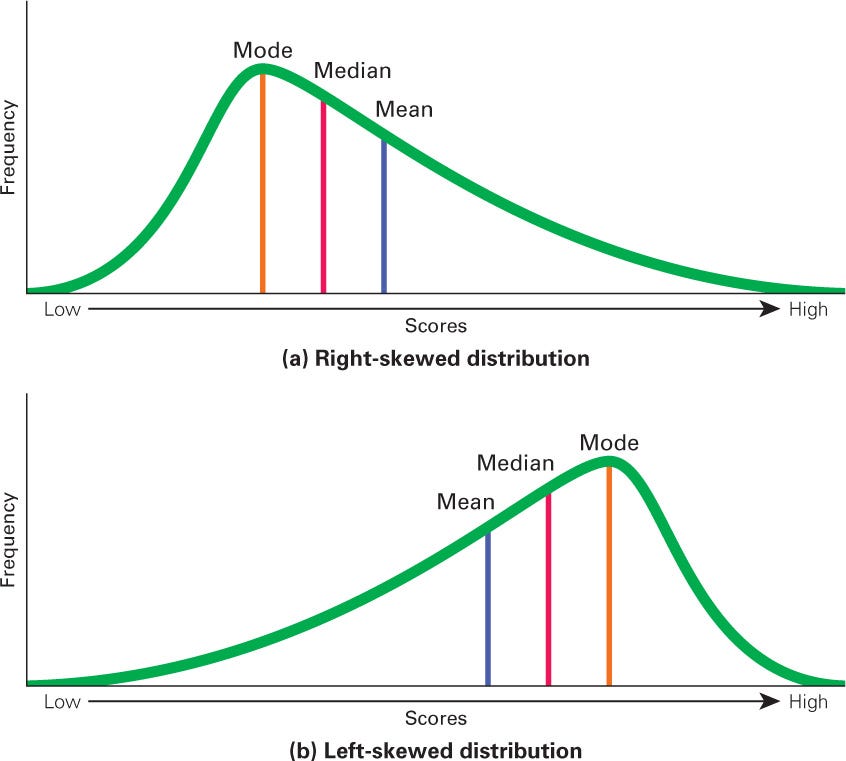
Mean
An arithmetical average of a distribution; symbol is x̄ (x-bar)
Median
Midpoint of a distribution, usually resistant
Mode
The most frequent value in a distribution
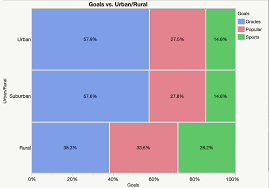
Mosaic plot
A segmented bar graph where the width of the bars is proportional to group size
Multimodal
graph with more than two clear peaks
Outlier
An observation that falls outside the overall pattern of distribution
Overall pattern
Shape, center, spread, outliers of a data set or distribution
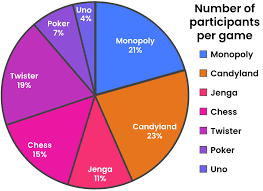
Pie chart
A graph that shows each slice (variable) as a part of a whole
Quantitative variable
Takes number values that are quantities; counts are usually measurements like height, income, age, etc.
Range
The largest value of a distribution minus the smallest; shows the spread of data in a single value
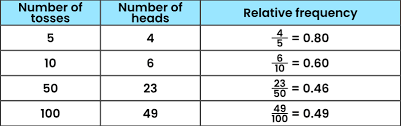
Relative frequency
Percentages
Relative frequency table
A table displaying the percentages of certain variables in each category
Resistant measure
A way to measure data that is unaffected or barely affected by extreme values being added
Examples: IQR, median, mode
Roundoff error
When rounding various figures, only to add them and get just short of 100%
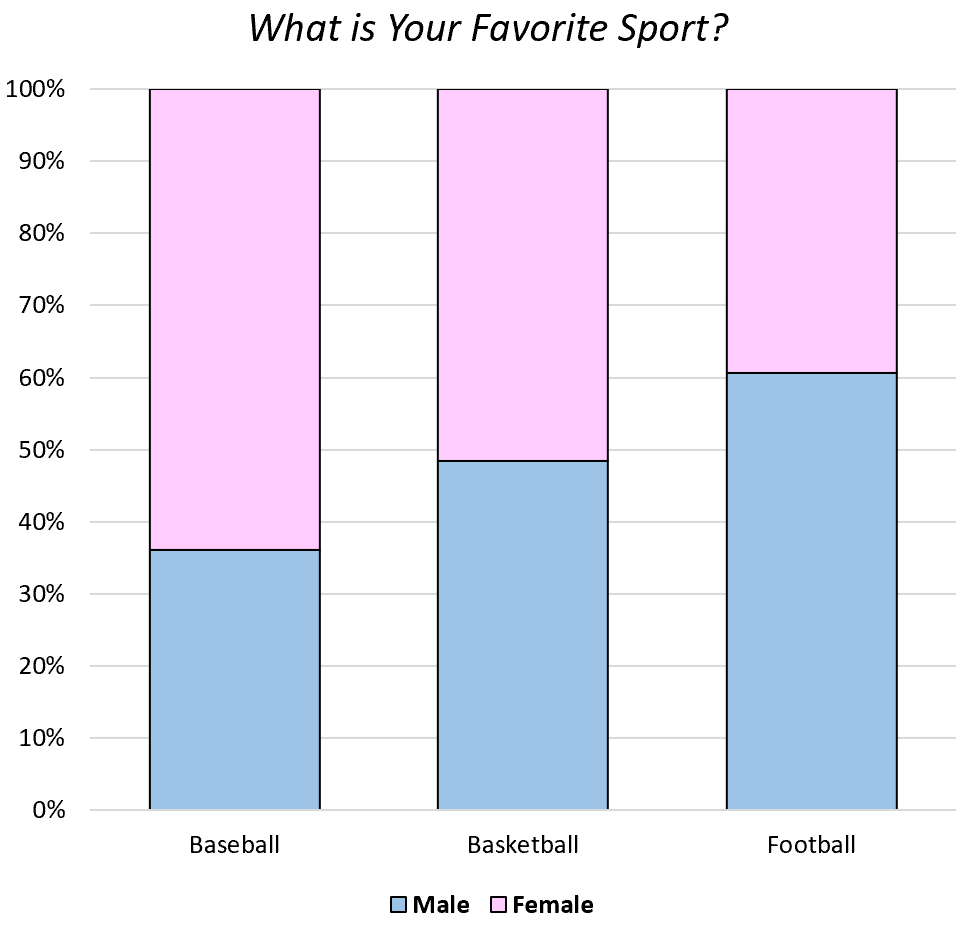
Segmented bar graph
Stacks the responses into a bar that reaches 100% to show the conditional distribution
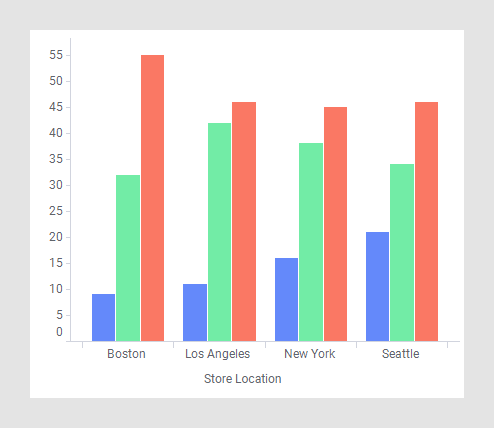
Side by side bar graph
Used to compare the distributions of multiple different categories to make data easier to interpret
Skewness
Either the right or left side has more data points
Splitting stems
On a stemplot, adding more stems to better organize and interpret data when working with a large data set
Standard deviation
The average distance of values from the mean
Symmetry
The right and left side are approximately mirrored; in a graph, mean and median are the same
The five-number summary
Used to summarize boxplots: minimum, Q1, median, Q3, maximum values
Variables
Characteristics being measured on an individual
Variance
The value underneath a radical before the root is taken