PY 211 - Vocab Unit 1
0.0(0)
0.0(0)
Card Sorting
1/65
Earn XP
Description and Tags
Study Analytics
Name | Mastery | Learn | Test | Matching | Spaced |
|---|
No study sessions yet.
66 Terms
1
New cards
statistics
mathematical procedures used to organize, summarizes, analyze, and interpret observations
2
New cards
data
numbers assigned to observations according to rules, called "scores" or "raw scores"
3
New cards
descriptive statistics
summarize, organize, describe score
4
New cards
inferential statistics
allows sample results to be generalized to representative populations
5
New cards
population
entire set of individuals or items of interest
6
New cards
parameter
data for a population
7
New cards
sample
representative subset of a population
8
New cards
statistics
data for a sample
9
New cards
variable
a characteristics that can have different values
10
New cards
examples for variable
stress level, age, gender, religion
11
New cards
value
a possible number or category that a score can have
12
New cards
examples for values
women, man,trans; 18-100;muslim,hindu,christian
13
New cards
score
a particular person's value on a variable
14
New cards
inventor of scales of measurements
S.S.Stevens (Harvard)
15
New cards
scales of measurement
degree to which measured variables conform to the abstract number system, determines the type of statistical analyses possible
16
New cards
types of scales of measurement
nominal, ordinal, interval, ratio
17
New cards
nominal (type of scales of measurement)
identity or classification (variable that has a name)
18
New cards
ordinal (type of scales of measurement)
rank or order
19
New cards
interval (type of scales of measurement)
order and equal units
20
New cards
ratio (type of scales of measurement)
order, equal units, and absolute zero
21
New cards
continous variable
diverse into an infinite number of fractional parts, possible decimals
22
New cards
discrete variable
separate and indivisible categories, whole numbers only
23
New cards
quantitative variable
varies by amount
24
New cards
qualitative variable
varies by form or class
25
New cards
frequency
describes the number of times or how often a category, score, or range of scores occurs
26
New cards
frequency distribution
a summary display for a distribution of data
27
New cards
ungrouped data
a set of scores or categories distributed individually, where the frequency for each individual score or category is counted
28
New cards
grouped data
set of scores distributed into intervals, where the frequency of each score can fall into any one interval
29
New cards
interval
discrete range of values within which the frequency of a subset of scores in contained
30
New cards
uses of frequency tables
describes the data, makes pattern of data clear, shows how many scores there are for each value on the scale
31
New cards
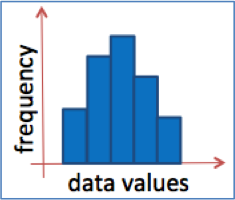
histogram
summarizes the frequency of continuous data that are grouped
32
New cards
unimodal frequency distribution
one peak
33
New cards
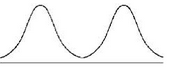
approximately bimodal frequency distribution
has 2 peaks
34
New cards
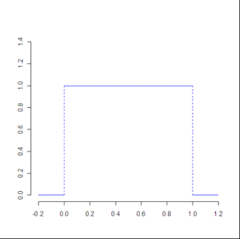
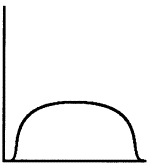
approximately rectangular frequency distribution
has a plateau
35
New cards
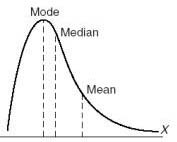
positively skewed distribution
tail goes toward the right
36
New cards
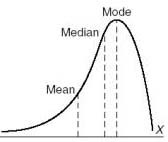
negatively skewed distribution
tail goes to the left
37
New cards
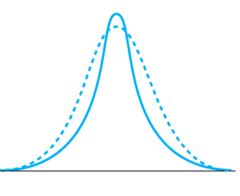
Leptokurtic distribution
sharper peak than normal, very thin
38
New cards
Platykurtic distribution
flat peak, more spread out
39
New cards
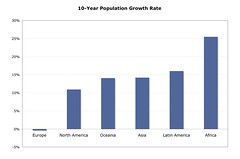
bar chart
summarizes the frequency of data in whole units or categories, nominal data
40
New cards
pie chart
summarizes the relative percent of discrete and categorical data into sectors
41
New cards
sector
represents the relative percentage of a particular category
42
New cards
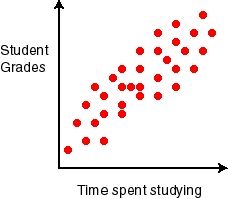
scattergram
displays discrete data points to summarize the relationship between two variables, data points are plotted to see whether or not a pattern emerges
43
New cards
central tendency
most "typical" or common score
44
New cards
mode
most frequently occurring number in a distribution, used for nominal variables
45
New cards
median
value at which 1/2 of the ordered scores fall above and 1/2 fall below, middle score when all scores are arranged from lowest to highest
46
New cards
mean
sum of all the scores divided boy the number of scores (average)
47
New cards
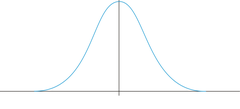
measures of central tendency
in a normal distribution, mean, median,mode coincide
48
New cards
mean>median
in positively skewed distribution
49
New cards
mean
in negatively skewed distribution
50
New cards
variance
average of each score's squared difference from the mean
-negative is meaningless
-value can be 0 (no variability)
-negative is meaningless
-value can be 0 (no variability)
51
New cards
formula for variance
SD^2 = (X-M)^2 /N
52
New cards
formula for the standard deviation
square root of variance
53
New cards
standard deviation
the average distance of scores around the mean
54
New cards
68% (34% above mean, 34% below mean)
at least ... of all scores lie within one SD of the mean
55
New cards
95% (48% above mean, 48% below mean)
at least ... of all scores lie within two SD of the mean
56
New cards
99.7%
at least ... of all scores lie within three SD of the mean
57
New cards
z score
number of standard deviations a score is above or below the mean
58
New cards
formula to change a raw score to a z score
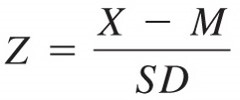
59
New cards
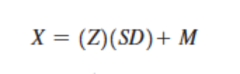
formula to change a z score to a raw score
60
New cards
property 1 of z score
sum of a set of z-scores is always 0
61
New cards
property 2 of z score
sd of a set of z-scores is always 1
62
New cards
normal curve table and z scores
shows the precise percentage of scores between the mean (z-score of 0) and any other z score
63
New cards
methods of sampling
random selection and haphazard selection
64
New cards
haphazard selection
Select items in a nonsystematic manner
65
New cards
probability
expected relative frequency of a particular outcome
66
New cards
outcome
result of an experiment