Theme 1 - Revision - Year 13 Mock
1/138
Earn XP
Description and Tags
Should include all from Theme 1 Economics Edexcel A
Name | Mastery | Learn | Test | Matching | Spaced |
|---|
No study sessions yet.
139 Terms
1.1.1: Define ‘Ceteris Paribus’.
All other things remain equal.
1.1.2: Define a ‘Positive Statement’.
A statement that is objective and made without any value judgement or emotion. These statements can be proven or disproven.
1.1.2: Define a ‘Normative Statement’.
A statement that is subjective and based on opinion, so cannot be proven or disproven. Often includes words such as ‘ought’, ‘maybe’, ‘should’ etc.
1.1.3: What is the ‘Economic Problem’?
This is the fact that the government and the people have a shortage of money. The problem of scarcity is faced by producers, consumers and governments. There are infinite wants and needs, but finite resources to meet those wants and needs.
1.1.3: What are the 4 factors of production?
Land
Labour
Capital
Enterprise
1.1.3: What is meant by an ‘Opportunity Cost’?
This is the benefits forgone of the next best alternative
1.1.3: What is meant by ‘Renewable Resources’?
These resources can be replenished, so the stock level of the resources can be maintain over a period of time. For example, commodities such as oxygen, fish, or solar power are renewable, assuming that the rate of consumption is lower than the rate of replenishment.
1.1.3: What is meant by ‘Non-Renewable Resources’?
These are resources that cannot be renewed. For example, things produced from fossil fuels such as coal and oil are non-renewable. The rate of consumption is higher than the rate of replenishment.
1.1.3: Why are renewable and non-renewable resources important?
This is important because environmental economics can be managed by preventing or limiting deforestation or imposing fishing quotas.

1.1.4: What is meant by a ‘Production Possibility Frontier’ (PPF)?
This shows the different combination of choices that a firm or country has when choosing between two goods to produce.

1.1.4: Are points A,B,C efficient combinations of goods that can be produced?
These points are all efficient combinations of goods that can be produced. This is because they are all on the PPF curve, meaning that this is the maximum amount of resources that can be allocated at their specific ouputs.

1.1.4: Is point D an efficient allocation of resources?
This point is showing an inefficient allocation of resources as not all of the resources are being used. At this point, it is possible to increase production of both goods by using the unemployed resources. Since nothing is given up in return, there is no opportunity cost for increasing production at this point.

1.1.4: Is point E an efficient allocation of resources?
This point is showing an output combination that is currently unobtainable. The PPF curve will need to be shifted outwards in order for this combination to be reached.

1.1.4: What causes the PPF to shift outwards?
Higher productivity
Discovery of new natural resources
Innovation
Increased capital
1.1.4: What causes the PPF curve to shift inwards?
War
Natural disasters
Outward migration (people leaving the country)
Long term fall in population (an ageing population - more retirement)
1.1.5: What is meant by ‘Specialisation’?
This is when an individual, a firm, or a country will concentrate on the production of a limited range of goods and services.
1.1.5: What is meant by the ‘Division of Labour’?
This is specialisation by individuals, where the production process is broken down into smaller separate tasks.
1.1.5: Explain the advantages of the Division of Labour.
Advantage is that the DoL increases the labour productivity and also increase the output per worker per hour. Workers can also become highly skilled at their job due to repetition.
Another advantage is because workers can become highly skilled, the quality of the output will increase, and make less mistakes
A third advantage of the DoL is that it will also increase the efficiency of resources. This is because capital equipment can be used continuously on a production line, meaning there will be less time wasted moving workers and machinery from one task to another.
1.1.5: Explain the disadvantages of the Division of Labour.
One disadvantage is because there is high repetition, this will create boredom in workers , which could lead to staff quitting, and so results in high recruitment costs and training costs
The second disadvantage of DoL is that breaking down the production process makes it easier for workers to be replaced by machinery. This means that workers who were skilled now face structural unemployment. This makes it harder for the worker to find work in the future as they only have experience in what they specialised in. If the worker stays unemployed for too long, they may lose their skills and this only makes it harder for them to find work.
A third disadvantage of the DoL is that segmenting the production process causes interdependence. If one group of workers make a mistake or go on strike, the whole production process stops, and possibly an entire industry stops.
1.1.5: What are the risks a country faces if they choose to specialise?
One risk is that if they specialise in a particular good, then this country goes to war or experiences natural disasters, then the country will not be able to continue to produce this good at the same output level, thus causing a global shortage of the good, causing global prices to rise. E.g. Russia-Ukraine war
Another risk is the country will be subject to changes in consumer taste
A third risk is the country is subject to changing weather and climate conditions.
1.1.5: What is meant by ‘Production’?
This is a measure of the value of the outut of goods and services
1.1.5: What is meant by ‘Productivity’?
Measures the efficiency of factors of production. This can be measured by output/person employed.
1.1.5: How is money used as a medium of exchange?
Money is used as a MoE as without money, buyers and sellers would have to ‘barter’ (the practice of exchanging one good or service for another without the use of money). Bartering is problematic as it requires two economic agents to want each others goods (double coincidence of wants). Money facilitates the exchange of goods without needing a double coincidence of wants.
1.1.5: How is money used as a Measure of Value?
Money is used as a MoV as it provides a means of ascribing value to different goods and services. Knowing the price of goods in terms of money allows both consumers and producers to make decisions in their best interest. Without money used in this way, it would be difficult for buyers and sellers to reach an agreeable exchange.
1.1.5: How is money used as a Store of Value?
Money is used as a SoV becuase it holds its value over time. This means that money can be saved. It remains valuable in exchange over long periods of time.
1.1.5: How is money used as a Deferred Method of Payment?
Money is used as a DMoP as it is an acceptable way to arrange terms of loans and settle debts. This allows for producers and consumers to acquire goods in the present and pay for them in the future.
1.1.6: What is meant by a ‘Free Market Economy’?
This is an economy where all resources are allocated by the price mechanism. This economy is driven by the profit motive and has a limited role for government intervention. The private sector dominates in this economy.
1.1.6: What are the advantages of the Free Market economy?
The profit motive helps to stimulate investment
The free market has efficient allocation of resources
Competition in the free market drives innovation.
The free market promotes competitive pricing due to competition. Firms will produce goods that consumers demand and the price mechanism will equate demand with supply
1.1.6: What are the disadvantages of a Free Market economy?
Monopolies may form in a free market economy. This then means that competitive prices will no longer exist as one firm has all the market power and so decides what price to charge.
There is poor income and wealth distribution and the lack of welfare support will lead to people living in absolute poverty
An insufficient quantity of public goods and merit goods are provided in a free market. Public goods include defence and streetlights, merit goods are healthcare and education.
1.1.6: What is meant by a ‘Mixed Economy’?
This is an economy where there is a mix of private and state sectors. The government provides a welfare state which gives people access to things such as universal credit and state pensions. The Mixed economy also provides public services like public transport, free education and healthcare.
1.1.6: What are the advantages of a ‘Mixed Economy’?
The mixed economy supports the vulnerable people in society
The government collects tax which is then used to pay for public and merit goods and redistribution of wealth
There are still competitive markets in a mixed economy and there is still the profit incentive, which allows for innovation.
1.1.6: What are the disadvantages of a ‘Mixed Economy’?
Decisions on allocating resources are now slower as they have to pass through the government.
If the government sets tax too high, it may discourage the rich from living in the country - less tax revenue
If welfare support is too high, this will discourage people from working.
1.1.6: What is meant by a ‘Command Economy’?
This is an economy system that is associated with communism where scarce resources are owned and allocated by the Government.
1.1.6: What are the advantages of a ‘Command Economy’?
In theory, there should be no poverty because all of the money and resources should be allocated equally.
The government allocated people to jobs and so beccause of this, theoretically, this economy should always be at maximum output.
The government has more control over the economy and so there are smaller swings in the business cycle which will lead to less unemployment and inflation.
1.1.6: What are the disadvantages of a ‘Command Economy’?
There is likely to be corruption from the people at the top such as corrupt governments
This economy is likely to lead to black markets where someone has more access to a resource illegally, then this resource can be sold through the black market illegally.
There is a lack of competition in this economy and this will lead to poor quality goods, especially when the emphasis is on maximising output instead of profit.
1.2.1: How do consumers behave rationally?
They wish to maximise their satisfaction or utility by correctly choosing how to spemd their limited income.
1.2.1: How do producers behave rationally?
They wish to maximise their profits by producing goods and services that are desired by consumers at the lowest cost.
1.2.1: How do governments behave rationally?
They wish to improve the social and economic welfare of all citizens.
1.2.2: What is meant by Demand?
The quantity that consumers are willing and able to buy at a given price, in a given time period.
1.2.2: What is the ‘Law of Demand’?
It states that demand varies inversely with price - Lower prices make goods and services more affordable for consumers and so demand rises.
1.1.6: What are the disadvantages of a ‘Command Economy’?
There is likely to be corruption from the people at the top such as corrupt governments
This economy is likely to lead to black markets where someone has more access to a resource illegally, then this resource can be sold through the black market illegally.
There is a lack of competition in this economy and this will lead to poor quality goods, especially when the emphasis is on maximising output instead of profit.
1.2.1: How do consumers behave rationally?
They wish to maximise their satisfaction or utility by correctly choosing how to spemd their limited income.
1.2.3: What is meant by ‘Price Elasticity of Demand’ (PED) ?
This measures the responsiveness of demand in relation to price.
1.2.3: What is the formula for PED?
%Change in Quantity Demand / %Change in Price
1.2.3: What is meant by Price Inelastic Demand?
This means that the quantity demanded is relatively unresponsive to a change in price. The calculated PED coefficient will be between 0 and 1.

1.2.3: What would happen if a business had price inelastic demand and they were to raise their prices?
The business would see an increase in revenue

1.2.3: What is meant by Price Elastic Demand?
This means that the quantity demanded is relatively responsive to a change in price. The calculated PED coefficient will be between 1 and infinity.
1.2.3: If a business had Price Elastic Demand, and they wanted to see a rise in revenue, what would they need to do?
The business would need to drop their prices in order to see a rise in revenue.

1.2.3: What is meant by Perfectly Inelastic Demand?
This means that the quantity demanded is completely unresponsive to a change in price. The calculated PED coefficient will be 0.

1.2.3: What is meant by ‘Perfectly Elastic Demand’?
This means that the quantity demand is completely responsive to a change in price. The calculated PED coefficient will be infinity ♾
1.2.3: What are the factors that affect PED?
Availability of substitutes - The more substitute goods there are, the more price elastic demand will be
Price of the product in relation to total income - If a high percentage of income is spent on the good, demand tends to be more price elastic
Brand Loyalty / habitual consumption - high levels of brand loyalty means that demand is more price inelastic.
1.2.3: What is meant by Income Elasticity of Demand (YED)?
Measures the responsiveness of demand in relation to real income.
1.2.3: What is the formula for YED?
%Change in Quantity Demanded / %Change in real income.
1.2.3: What is meant by a ‘normal’ good?
This is a good that will always have a positve income elasticity coefficient. As the price falls for these goods, consumers will buy more of them. Have a YED greater than 0.
1.2.3: What is meant by Perfectly Inelastic Demand?
This means that the quantity demanded is cxompletely unresponsive to a change in price. The calculated PED coefficient will be 0.
1.2.3: What is meant by ‘luxury’ goods?
This is a good that will always have a PED coefficient greater than 1. These goods are typically high end products.
1.2.3: What is meant by an ‘Inferior good’?
This is a good that will always have a negative YED coefficient. This good, following an increase in real income, will see its demand fall. However, when there is an economic recession, and so a subsequent fall in real incomes, this good will see its demand rise. This is because, typically, these goods are cheap and low quality.
1.2.3: What is Cross Price Elasticity of Demand (XED) ?
This measures the responsivenes of quantity demand for Good X after a change in the price for Good Y.
1.2.3: What is the formula for Cross Price Elasticity of Demand (XED)?
%Change in Quantity Demanded of Good X / %Change in Price for Good Y.
1.2.3: What is meant by ‘substitute goods’?
These are goods that are in competitive demand. With these goods, an increase in the price of one good, will lead to an increase in demand for the other good. The calculated XED coefficient will always be positive.
1.2.3: What is meant by Complementary Goods?
These are goods that are in joint demand. A fall in the price of one good will lead to an increase in demand for the complementary good. The calculated XED coefficient for these goods will always be negative.
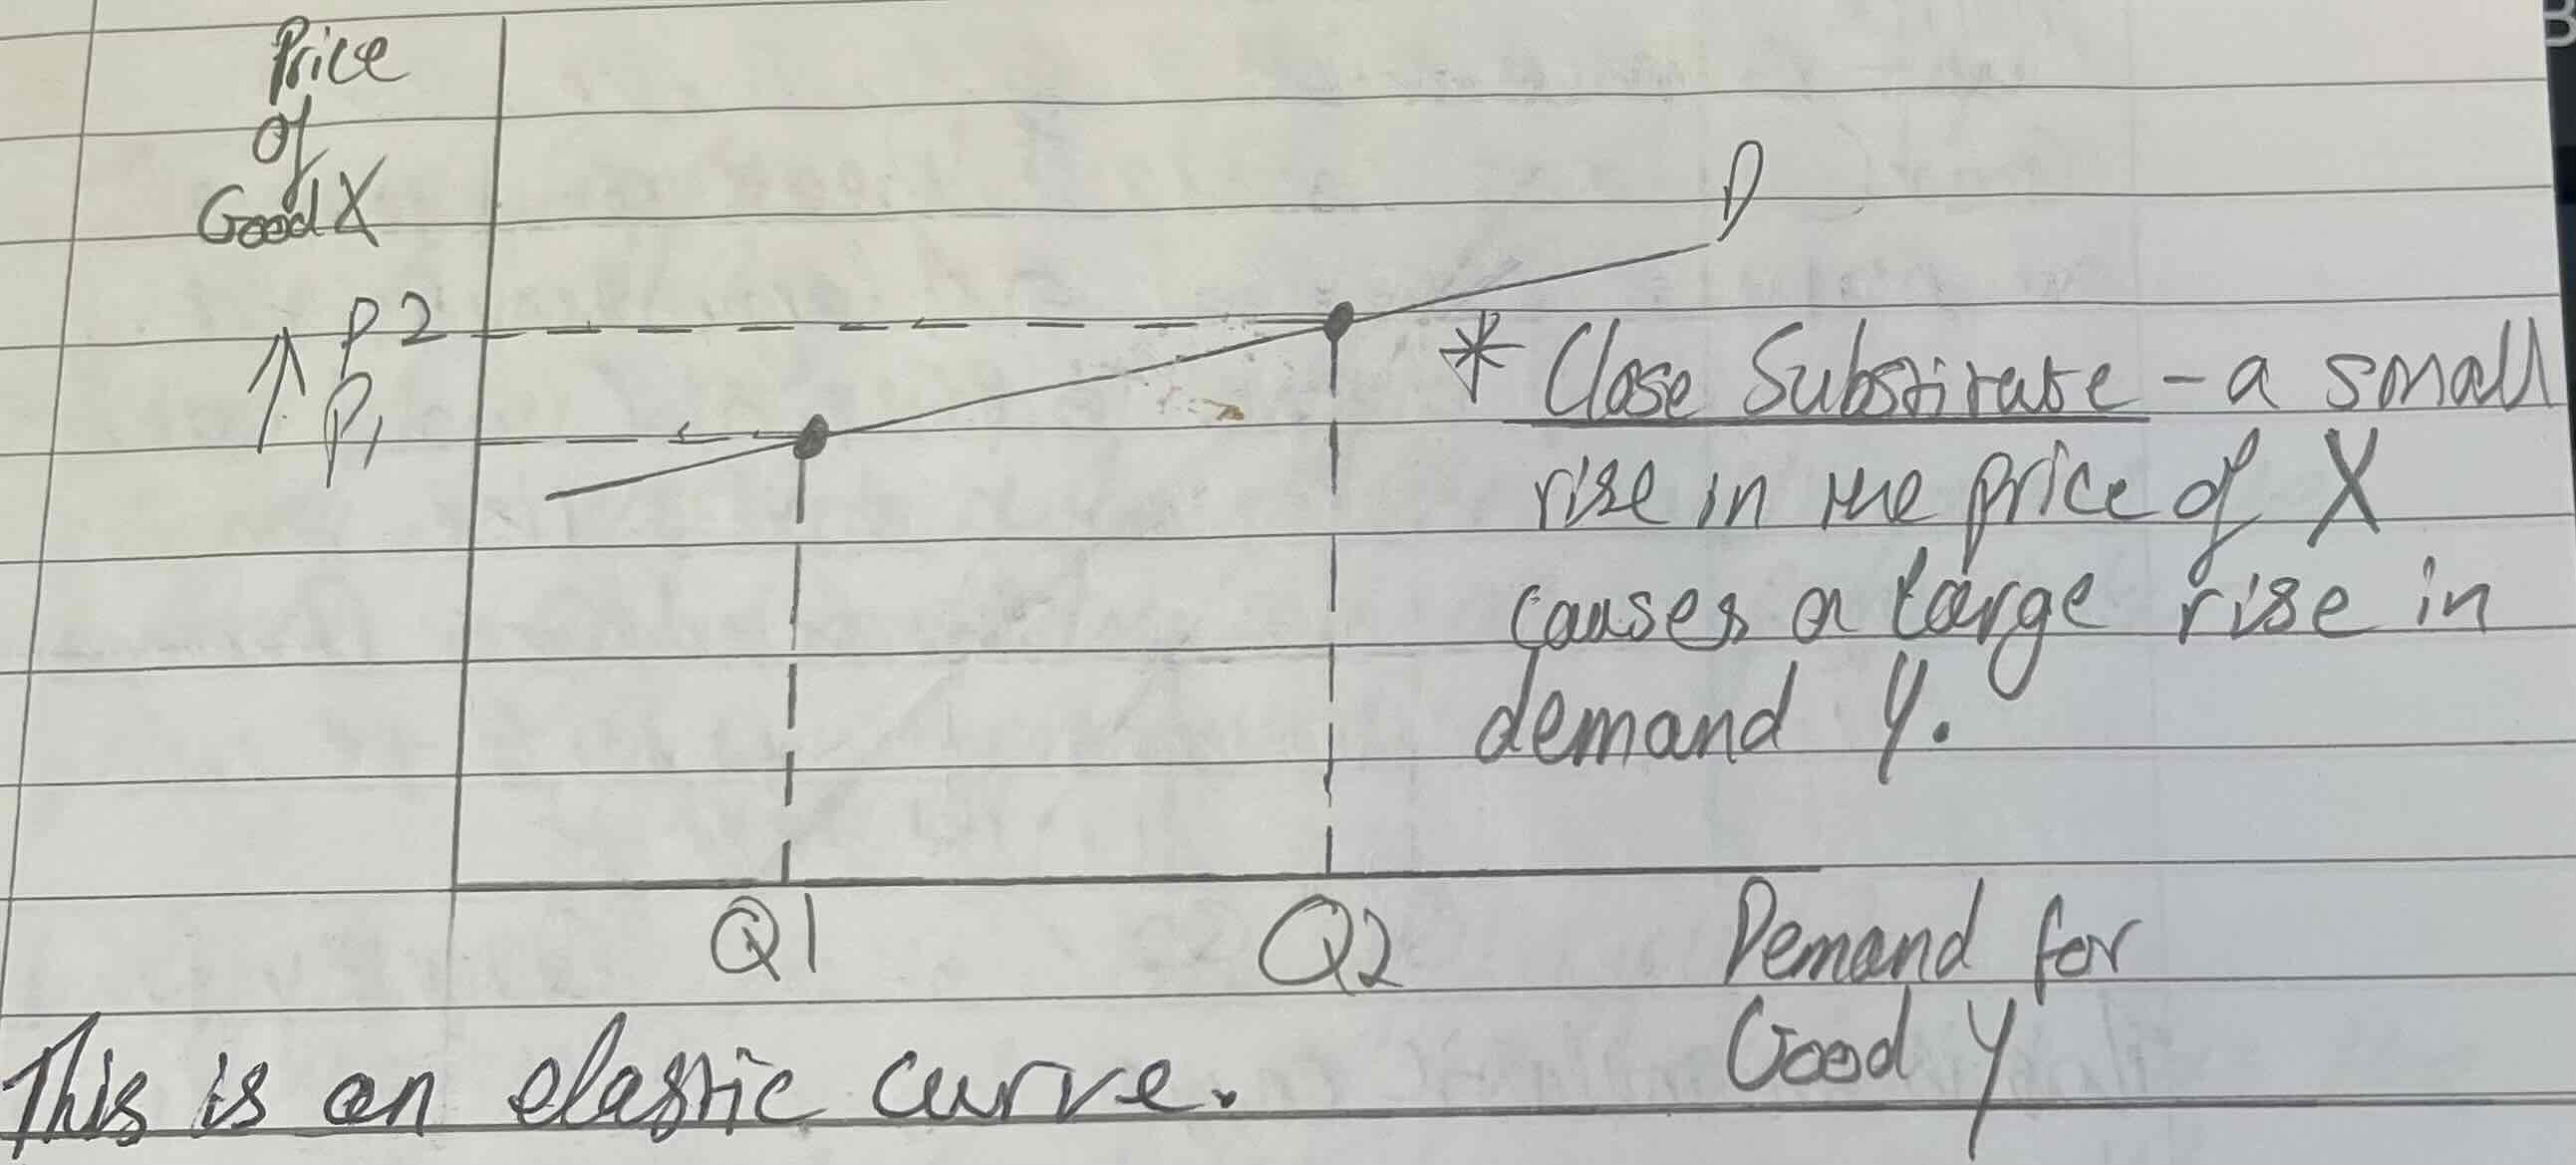
1.2.3: What happens when two goods are “Close Substitutes”?
When this happens, the two hoods will have a highly positive XED coefficient. This means that a small change in price would lead to a big switch in consumer demand
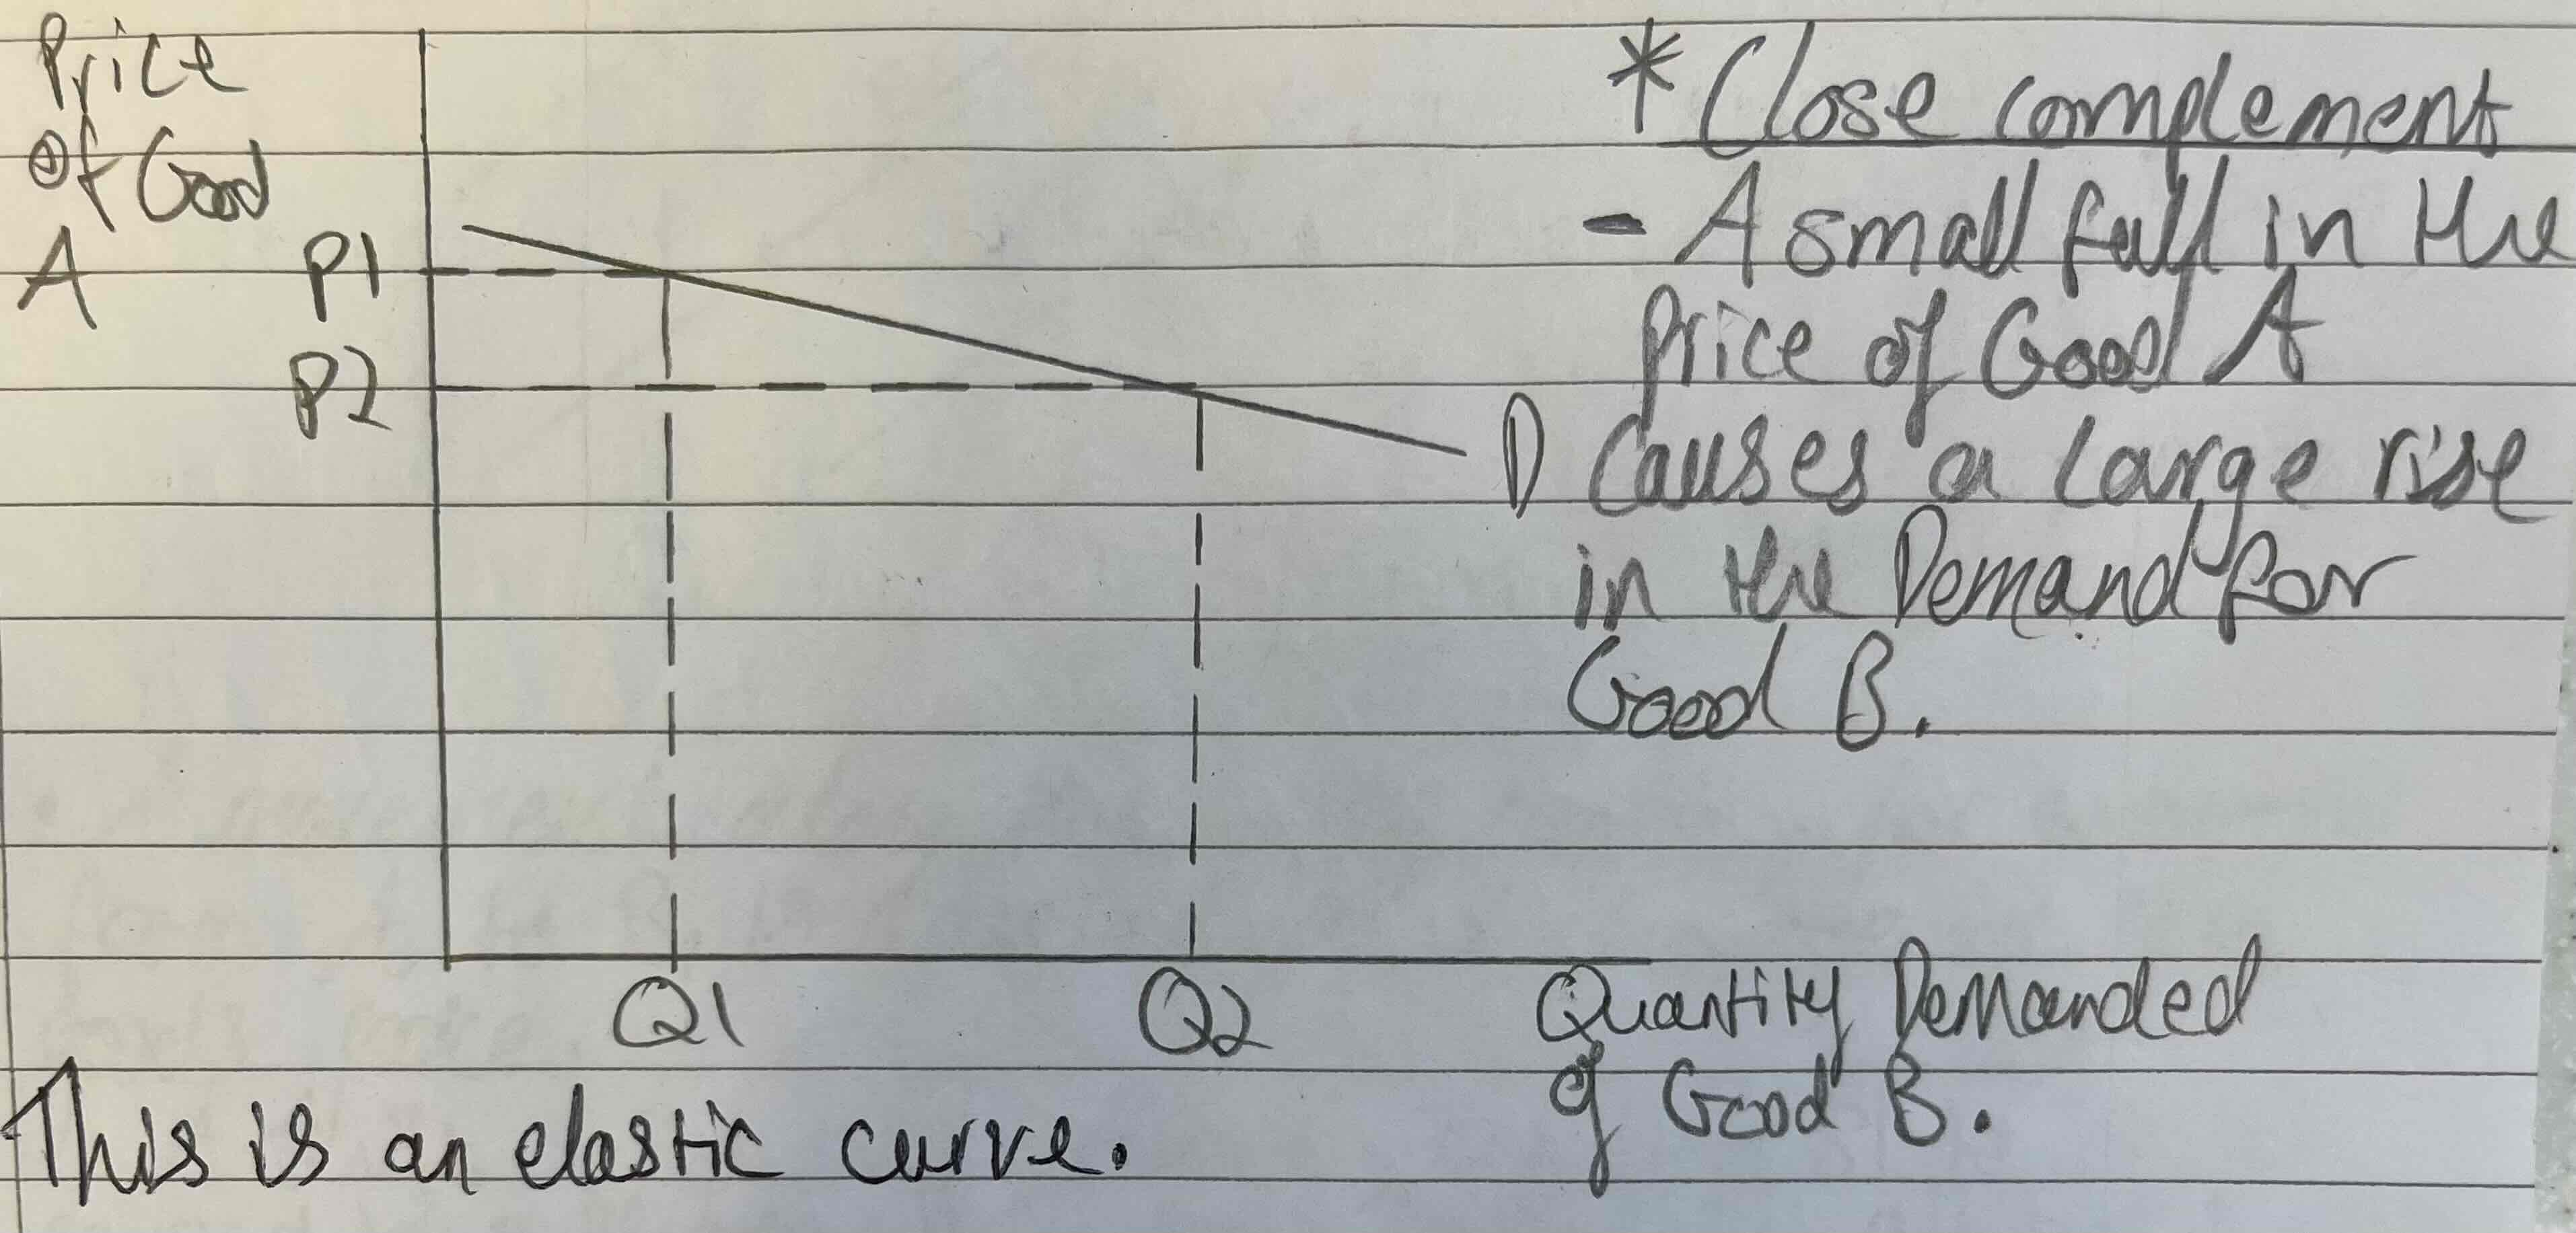
1.2.3: What happens when two goods are “Close Complements”?
When this happens, the two hoods will have a highly negative XED coefficient. This means that a small fall in price of one good will lead to a large increase in demand of the other good.
1.2.4: Define Supply.
This is the ability and the willingness to provide a good or service at a particular price at a given moment in time.
1.2.4: Define the Basic Law of Supply.
This states that as the price of a product rises, businesses will expand supply of that product in the market.
1.2.4: What causes a shift in the supply curve?
Changes in costs of production - lower unit costs mean the business can supply more at each price level, this is an outward shift of supply
Advancements in technology - will cause an outward shift as they either make the production process cheaper or more efficient.
Favourable weather conditions - for agricultural goods, good weather means more supply as more of the product is being produced.
Tax - inward shift due to the firm taking less profit, becomes less profitable to produce at the current output
Subsidies - outward shift due to government giving suppliers money to continue producing products which lowers the costs of production
Government Regulation- inward shift as producers will have to do more inspections to see if their products meet the regulations, which reduced productivity
1.2.4: Define Joint Supply.
This is when the increase or decrease in the supply of one good leads to an increase or decrease in the supply of a by-product
1.2.5: Define Price Elasticity of Supply (PES).
This measures the responsiveness of supply to a change in price.
1.2.5: What is the formula for PES?
%Change in Quantity Supplied / %Change in Price

1.2.5: What is meant by Price Elastic Supply?
This is when producers can increase their output without a rise in cost or time delay. The calculated coefficient will be greater than 1

1.2.5: What is meant by Price Inelastic Supply?
This is when producers find it hard to change their production in a given time period. The calculated coefficient will be between 0-1.

1.2.5: What is meant by Perfectly Inelastic Supply?
This is when supply is fixed and producers cannot respond to a change in market demand. The calculated coefficient of PES will be 0.

1.2.5: What is meant by Perfectly Elastic Demand?
This is when an increase in demand can be met without any change in the price. Producers can respond to changes in consumer demand without a rise in price. The calculated coefficient of PES will be infinity.

1.2.6: What is meant by ‘Equilibrium’?
This is a state of equality or balance between market supply and market demand.
1.2.6: What is meant by ‘Points of Disequilibrium’?
These points are prices where demand and supply are out of balance.

1.2.6: Explain this Excess Supply diagram.
With the market price at P2, there would be excess supply from Q2 to Q3, (because demand is at Q2 at P2, but supply is at Q3 at P2), which causes a downward pressure on price. Producers then reduce their price back down to QE, which leads to a contraction in supply and an expansion in demand.

1.2.6: Explain this Excess Demand diagram.
With the market price at P1, there would be excess demand from Q1 to Q2, (as supply is at Q1 at P1, but demand is at Q2 at P1) which would put an upward pressure on price. Producers would then increase their price to PE, and this would lead to a contraction in demand and an extension in supply. This brings demand and supply back to the equilibrium of QE-PE.

1.2.6: Explain this Increasing Demand Diagram.
An outward shift of demand would lead to a rise in equilibrium price, and as producers see the rise in demand and price, this causes an extension of market supply.

1.2.6: Explain this Increasing Supply diagram.
An outward shift in market supply (ceteris paribus) will lead to a fall in equilibrium price, and so this causes an extension of market demand.

1.2.6: Explain this Decreasing Demand Diagram.
An inward shift of market demand leads to a fall in equilibrium price and a contraction of market supply.

1.2.6: Explain this Decreasing Supply diagram.
An inward shift of market supply (ceteris paribus) leads to a rise in equilibrium price and contraction in market demand.
1.2.7: What is meant by the ‘Price Mechanism’?
This is used to allocate scarce resources (CELL) within the market.
1.2.7: Describe the Signalling function of the Price Mechanism.
This is the function where prices adjust to demonstrate where resources are needed. For example, when fidget spinners where trending and demand for them was high, toy businesses put their resources towards making fidget spinners, leading to an increase in price. The increase in price then signals customers to stop buying them. Producers will see increases or decreases in demand which will signal them to increase or decrease supply.
1.2.7: Describe the ‘Incentives’ function of the Price Mechanism.
This is the function where, when the price of a product rises, producers are likely to respond by increasing the supply of the product due to the profit incentive, so the producers/supplyiers can earn more money from the increasing price of the product.
1.2.7: Describe the ‘Rationing’ function of the Price Mechanism.
The price system is a way of rationing goods because when price increases, some people will no longer be able to afford to buy the product and others may no longer have the desire to buy the good. The limited resources can be rationed and allocated to the people who are able to afford them, and those who value them highly.

1.2.7: How does an external adverse shock (Covid) cause Price Volatility?
This can cause price volatility by causing market prices to rise sharply, especially when PES is inelastic (between 0 and 1).

1.2.8: What is Consumer Surplus?
This is the difference between the total amount that consumers are willing an able to pay for a good or service, and the total amount they actually pay (the market price). This is represented by the area under the demand curve and above the market price.

1.2.8: Explain, using the diagram, how an increase in supply cost causes a reduction in consumer surplus.
Higher supply costs will cause a decrease in supply and leads to an increase in market price. This then leads to a fall in consumer surplus from BAC to BDE.
1.2.8: What is the relationship between consumer surplus and Price Inlestic Demand?
When demand is price inelastic, there is a greater consumer surplus because there are some buyers that are willing to pay very high amounts to continue consuming the good.
1.2.8: What is the relationship between consumer surplus and Price Elastic Demand?
When demand is elastic, there is relatively low consumer surplus due to consumers not willing to pay high prices for the good.

1.2.8: Define ‘Producer Surplus.’
This is the difference between the price producers are willing and able to supply a good or service at, and the price they actually receive.

1.2.8: How does lower supply costs affect producer surplus?
Lower supply costs will cause an increase in supply which causes the market price to fall. Producer surplus increases from area ADB to FEC.

1.2.8: How does an increase in market demand affect producer surplus?
An increase in market demand leads to a higher price and leads tp a rise in producer surplus from ABC to DEC.
1.2.9: What is meant by an ‘Indirect Tax’?
This is a tax that is imposed by the government and is levied on goods and services.
1.2.9: What is the impact on Supply from an indirect tax?
Less can be supplied at each price level as they would be earning less profit
1.2.9: What is the intended impact of an indirect tax
There will be an increase in the market price and a reduction in demand to a new equilibrium output.
1.2.9: What is meant by a ‘Specific Tax’?
A tax that is set as ‘tax per unit’. E.g. £5 tax per unit sold.
1.2.9: What is meant by an ‘Ad Valorem’ Tax?
This is a tax set as a percentage. E.g. 20% tax to the unit price. An example is VAT.

1.2.9: Explain an Ad Valorem tax diagram.
The supply curve shifts and tilts so that the gap between S1 and S1+tax grows. This is because the tax is a percentage of the products value. So, when the price is low, the tax will only be a small percentage. However, when the price of the good is high, the tax will also be high.

1.2.9: What is the result when an indirect tax has been imposed, and PED is pefectly inelasticn(0)?
All of the tax is paid for by the consumer in the form of charging the consuer a higher price.