Looks like no one added any tags here yet for you.
a distribution of all possible samples of a given size drawn from a population. It represents the distribution of statistics (such as the mean or proportion) calculated from these samples
_____ (mu,p) describes Population, _____ (lined x, hatted p) describes Sample
_____ (lined x, hatted p) estimates corresponding ____ (mu , p)
unbiased estimator: statistic whose mean is ____ to value of ____ being estimated (does NOT consistently either over/underestimate value of parameter)
take every possible sample of size n & graph some ____ → sampling distribution: frequency distribution of ALL possible values of a statistic (we can only approximate)
parameter, statistic, statistic, parameter, equal, parameter, statistics
10% Condition (review 6.3)
often can assume 10% Condition: “Assuming the population size it at least …”
Regardless of population size, take same ____ size for same ____ assuming equal probabilities between distributions
sample, variability
If claim of some probability for some interval of parameter, but sampling distribution has significantly small probability of that interval, it is (un/likely) for that probability’s smallness to be due to chance, so the claim is likely ____ (precursor to significance tests)
unlikely, false
confidence interval:
estimate population parameter from sample statistic
C% confidence interval: statistic (unbiased point estimator) ± margin of error, where margin of error = critical value * standard deviation of population (if don’t know standard deviation of population, must use ______ as estimate)
critical value depends on ____ level
confidence level (does/n’t) tell the chance that a particular interval captures the parameter; the parameter is ___ already, so one you make a sample, the interval either contains or does not contain the parameter
Instead (interpretation): “The interval was constructed using a method that produces intervals that capture the true (parameter) in C% of all possible samples of size (n).”
standard error, confidence, doesn’t, fixed
How is a mean sample distribution found?
you take the average of all means (quantitative) or proportions (categorical) of each possible sample size (n) and use these averages as your data points
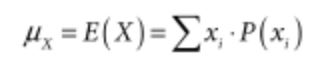
How do you find the mean of a discrete random variable?
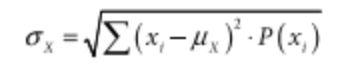
How do you find the standdev of a DRV?
A population parameter is a measure of
a characteristic of a population, such as the mean or proportion of a certain attribute
A sample statistic is a measure of a
characteristic of a sample, such as the mean or proportion of a certain attribute
Sample statistics estimate
population parameter
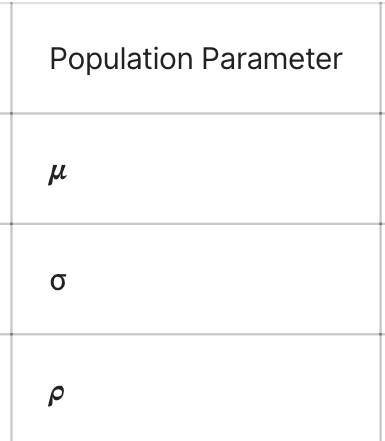
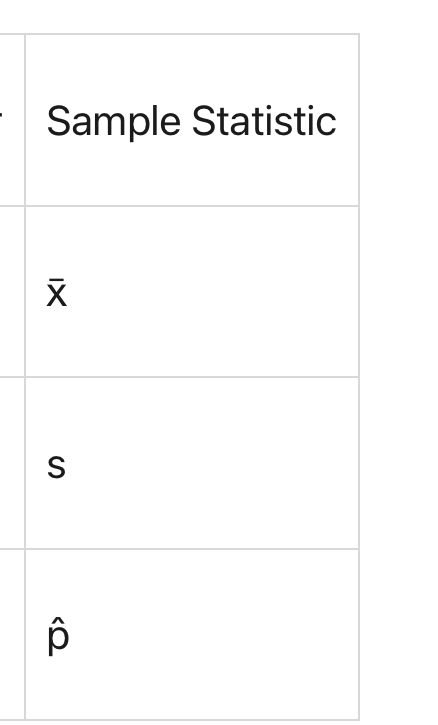
What are these variable letters for population parameter: standard deviation, mean, proportion
lowercase sigma, mu, rho
What are these variable letters for sample statistic: mean, standard deviation, proportion
barred x, s, hatted p
The mean, median, and mode of a normal distribution are all (different/equal), and the distribution is_____l, meaning that it has only one peak or mound.
equal, unimodal
The center of a normal model is represented by the ___, which is the arithmetic average of the data. The shape of a normal model is characterized by the ___-shaped curve, which is symmetrical around the ____. The spread of a normal model is represented by the _________ which measures the dispersion or ____ of the data around the mean.
mean, bell, mean, standard deviation, spread
A model displaying categorical or proportion-based data is nearly normal if
The number of successes and failures is at least 10 (Large Counts)
A model displaying quantitative or mean-based data is nearly normal if
OR
|
A z-score indicates how many
standard deviations above or below the mean a piece of data is
A z score (does/n’t) contain units
doesn’t
When asked to interpret a z-score, it is imperative that you indicate the
direction (pos or neg)
The Central Limit Theorem states that
if a sample size (n) is large enough, the sampling distribution of the sample mean will be approximately normal, regardless of the shape of the population distribution.
a sample size of n > _ is considered to be large enough for the Central Limit Theorem to hold.
30
for the Central Limit Theorem to apply, the samples must be ______ of each other and the sample must be a______. Additionally, it is generally recommended to use the Central Limit Theorem only for____ variables, as it may not hold for_____ variables with small sample sizes.
independent, SRS, continuous, discrete
An unbiased estimator is one that
produces estimates that are on average as close as possible to the true population parameter
A sample is unbiased if the estimator value (_____) is equal to the ______ _____
sample statistic, population parameter
A sampling distribution has a minimum amount of variability (spread) if all samples have statistics that are approximately ____ to one another
equal
It is (im/possible) to have no variability, due to the nature of random sampling
impossible
he sample you are using to make the inference is only a small subset of the entire population, and so it is subject to_______
sampling error
f a sample is equally spread out around the mean, it is not necessarily unbiased; it is _____ to be biased than a sample that is heavily skewed in one direction or the other.
less likely
A consistent estimator is
a statistical method that produces an estimate that becomes more accurate as the sample size increases. In other words, it consistently approaches the true value of the population parameter.
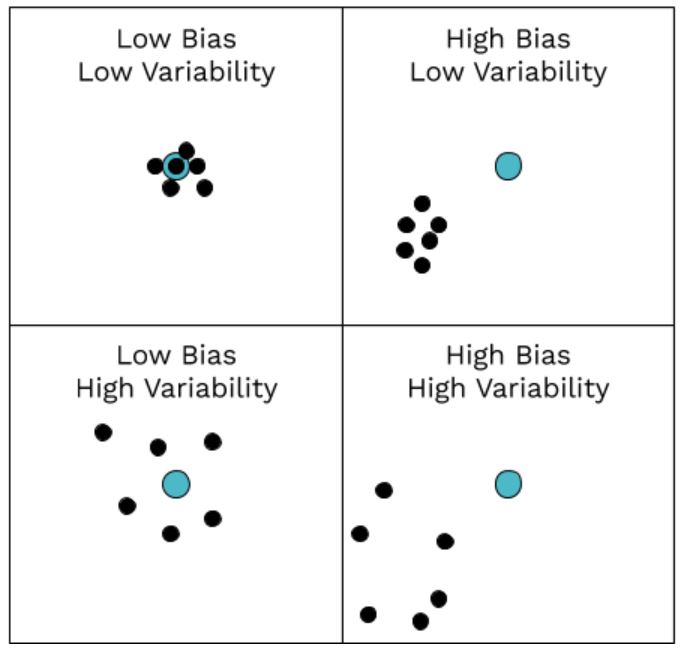
Bias measures how precise the archer is (how ___ to the bullseye), while variability measures how _____ he/she is. In this analogy, the bullseye represents the true ____, and the archer's shots represent the estimates produced by the ___.
close, consistent, population parameter, estimator
You can usually tell if you will solve a problem using sample proportions if the problem gives you a ________
probability or percentage
The large counts condition can be expressed as np ≥ 10 and n(1-p) ≥ 10, where n is the sample size and p is the sample proportion. This means that both the number of ____(np) and the number of ____ (n(1-p)) in the sample should be at least ___. If these conditions are met, then you can assume that the sampling distribution for the sample proportion is approximately ___, and you can use statistical techniques that rely on normality, such as confidence intervals or hypothesis tests (we'll cover this in future sections!). ✔
successes, failures, 10, normal
For the shape (normal) of distributions of means, you can check the _______, but for proportions you must always check the_____
CLT, LCC
normal distribution
a continuous random probability distribution
sampling distribution for a difference in sample proportions
compares the mean and standard deviation of a binomial random variable; parameter shown by p; statistic shown by dotted p; conditions SRS, normal or np and n(1-p)≥10 (large counts), for standard deviation population is at least 10. mean for distribution is mu dotted p equals p. standard deviation for distribution is standard deviation of dotted p is equal to the square root of the probability of non p divided by n
sampling distribution for sample mean
parameter shown by p1-p2, statistic shown by hatted p1 - hatted p2, conditions: SRS, large counts, 10% rule, mean for distribution is mu sub(p1-p2) = p1-p2, standard devitaion for distribution shown by sampling distribution for sample population formula added with data from both populations and all square rooted
sampling distribution for the difference in sample means
shown by mu parameter, shown by lined x statistic, conditions: SRS, normal or sample size at least 30, 10% rule, mean for distribution is mu
standard deviation
parameter shown by sigma sub p, statistic shown by s
When you are working with numerical data and you want to estimate the mean of a population, you can use the______ of the ____ (x̄) to make inferences about the ____ However, before you can solve the problem, you must first assure the sampling distribution is normally distributed using the_____
sampling distribution, sample mean, population mean, CLT
To find the standard deviation of differences in sample means, divide the variances by each sample size before square rooting to find the overall standard deviation. Just like with proportions, the “________” applies to sampling distributions for the difference in two means as well
pythag theorem of stats