Module 9 - Chi-squares
1/20
There's no tags or description
Looks like no tags are added yet.
Name | Mastery | Learn | Test | Matching | Spaced | Call with Kai |
|---|
No analytics yet
Send a link to your students to track their progress
21 Terms
Single sample t-test
Sample relative to reference value
Paired t-test
Two measurements per sampling unit
Two-sample t-test
Compare the means of two groups
One-tailed test
Hypotheses have a level of directionality to them. Only one alpha level for the sample mean to be compared against, all alpha is on one tail, thus a greater chance of rejecting the null hypothesis if our p-value is on that side.
Expected contingency table
The contingency table of expected frequencies under the null hypothesis. Always given as counts. The sum of all counts must be the same as the sum of the counts in the observed contingency table. Typically has fractional values even when the observed does not because it represents the average from a statistical population
One-way expected contingency tables
Main question is to ask whether there are differences in counts among the levels of the variable. All cells have the same expected frequency on an expected contingency table
Two-way expected contingency tables
Researchers are interested in whether the counts across the levels of one variable change differently depending on what level of the other variable is being looked at — the interaction between variables. If there is no interaction, variables are independent (have the same relative proportion across levels of variables) of each other.
Calculating a marginal distribution in a 2-way table
Calculate the marginal distributions (add the row/column to get the count) as proportions (divide by total table count).
Using the marginal distribution, calculate the product of the row and column proportions for each cell multiplied by the total table count.
Chi-squared score (X2)
Measures the distance between the observed and expected contingency tables. Calculates the squared difference on a cell-by-cell basis. (Squared because the importance is in the difference, not which is larger)
Steps to calculate a chi-squared score
Take the difference between each observed and expected cell
Square the difference
Divide by the expected value
Sum over all cells in the table
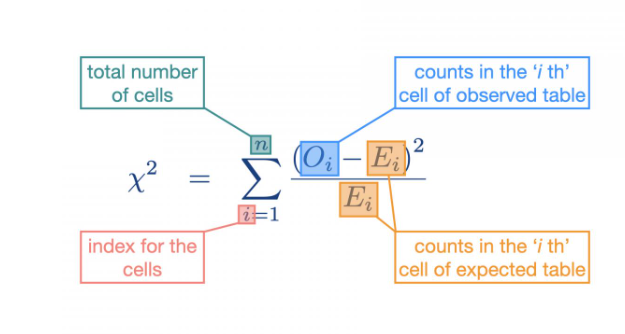
The image represents
Chi-squared score calculation. The sum across all cells ((subtraction of observed from expected)2, divided by expected). Same for both 1-way and 2-way contingency tables
Null distribution for a chi-squared test
Sampling distribution of the chi-squared test (which is already a measure of the distance between sample data and the null hypothesis). distribution of chi-square scores you would get from sampling an imaginary statistical population where the null hypothesis was true
Values on the chi-squared distribution
The area under the curve sums to one, can calculate probabilities or quartiles over specific intervals. Different shape because only positive values are possible. Describes the likely variation in chi-squared scores that are due to sampling error alone
Degrees of freedom in a chi-squared distribution
Depends on the number of cells in the expected contingency table. Determines the shape of the chi-squared distribution.
for 1-way tables, df are number of cells (k) minus 1 (df=k-1)
for 2-way tables, df are the number of rows minus one multiplied by the number of columns minus 1 (df=(c-1)(r-1))
Becomes flatter with more degrees of freedom.
Steps for a chi-squared test
define the null and alternative hypotheses
establish the null distribution
conduct the statistical test
draw scientific conclusions
Hypothesis test for a chi-square test
Locating the critical X2 score that corresponds to the Type I error rate on a chi-squared distribution, then comparing it to the observed X2 score. The statistical decision can be made by either comparing the observed and critical X2 scores, or comparing the p-value and Type I error rate. Always directional (right hand side)
Rejecting the null hypothesis on a chi-squared test
if the observed score is greater than the critical score (i.e., ꭓ2O>ꭓ2C) or if the p-value is smaller than the Type I error rate (i.e., p<⍺). On the distribution, if the observed X2 is to the right of the line
Failing to reject the null hypothesis on a chi-squared test
If the observed score is less than or equal to the critical score (i.e., ꭓ2O≤ꭓ2C) or if the p-value is larger or equal to the Type I error rate (i.e., p≥⍺). On the distribution, if the observed X2 is to the left of the line
Scientific conclusions for 1-way tables
Reject the null hypothesis and conclude that there is evidence to support that the counts are not equal among cells.
Fail to reject the null hypothesis and conclude that there is no evidence to support that the counts are not equal among cells.
Scientific conclusions for 2-way tables
Reject the null hypothesis and conclude that there is evidence to support that the variables are not independent of each other.
Fail to reject the null hypothesis and conclude that there is no evidence to support that the variables are not independent of each other.
Reporting for a chi-square test should include
Short name of the test (i.e., ꭓ2)
Degrees of freedom
Total count in the observed table
The observed chi-squared value (two decimal places)
p-value (three decimal places)