Geography Exam
1/73
There's no tags or description
Looks like no tags are added yet.
Name | Mastery | Learn | Test | Matching | Spaced | Call with Kai |
|---|
No analytics yet
Send a link to your students to track their progress
74 Terms
Describe global pattern of temperature
Lower latitude general indicates higher temp. (but subtropics are hotter than equator)
Describe glonal pattern of rainfall
what effects the seasonal changes of tempeature
tilt of the earth on the axis (how close to sun)
other spatial variations that affect temperature
the ocean maintains a regular temperature
environmental lapse rate: every km of alt. the temperature decreases by 6.5°C
tropics of cancer and capricorn: where the sun hits in the middle of summer/winter.
Describe global pattern of rainfall
high rainfall = rising air and low pressure belts
low rainfall = sinking air and high pressure belts
why do oceans receive more rainfall than land
water is needed to create rain (more water that can evaporate into clouds)
seasonal changes that affect rainfall
tilt of earth on axis
pressure belts moving e.g perth has wet winters and dry summers
types of rain in different latitudes
equator: convectional rainfall
temperate: frontal rainfall
spacial variations that affect rainfall
mountain barriers: prevent movement of air therefore rain has to rise over mountains therefore it cools down (condensation) and the rain falls on the windward side while the other side is a desert
continental effect: wind blows off oceans (with high moisture) and therefore the coast gets more rainfall than inland areas
ocean currents: warm current = higher rainfall, cool current = lower rainfall e.g Gulf Stream is warm and Humboldt Current creates Atacama desert
Describe where the weather occurs
a thin layer of gases (100km thick) surrounding Earth held in place by gravity. Weather occurs within this layer, specifically in the layer closest to Earth (Troposphere).
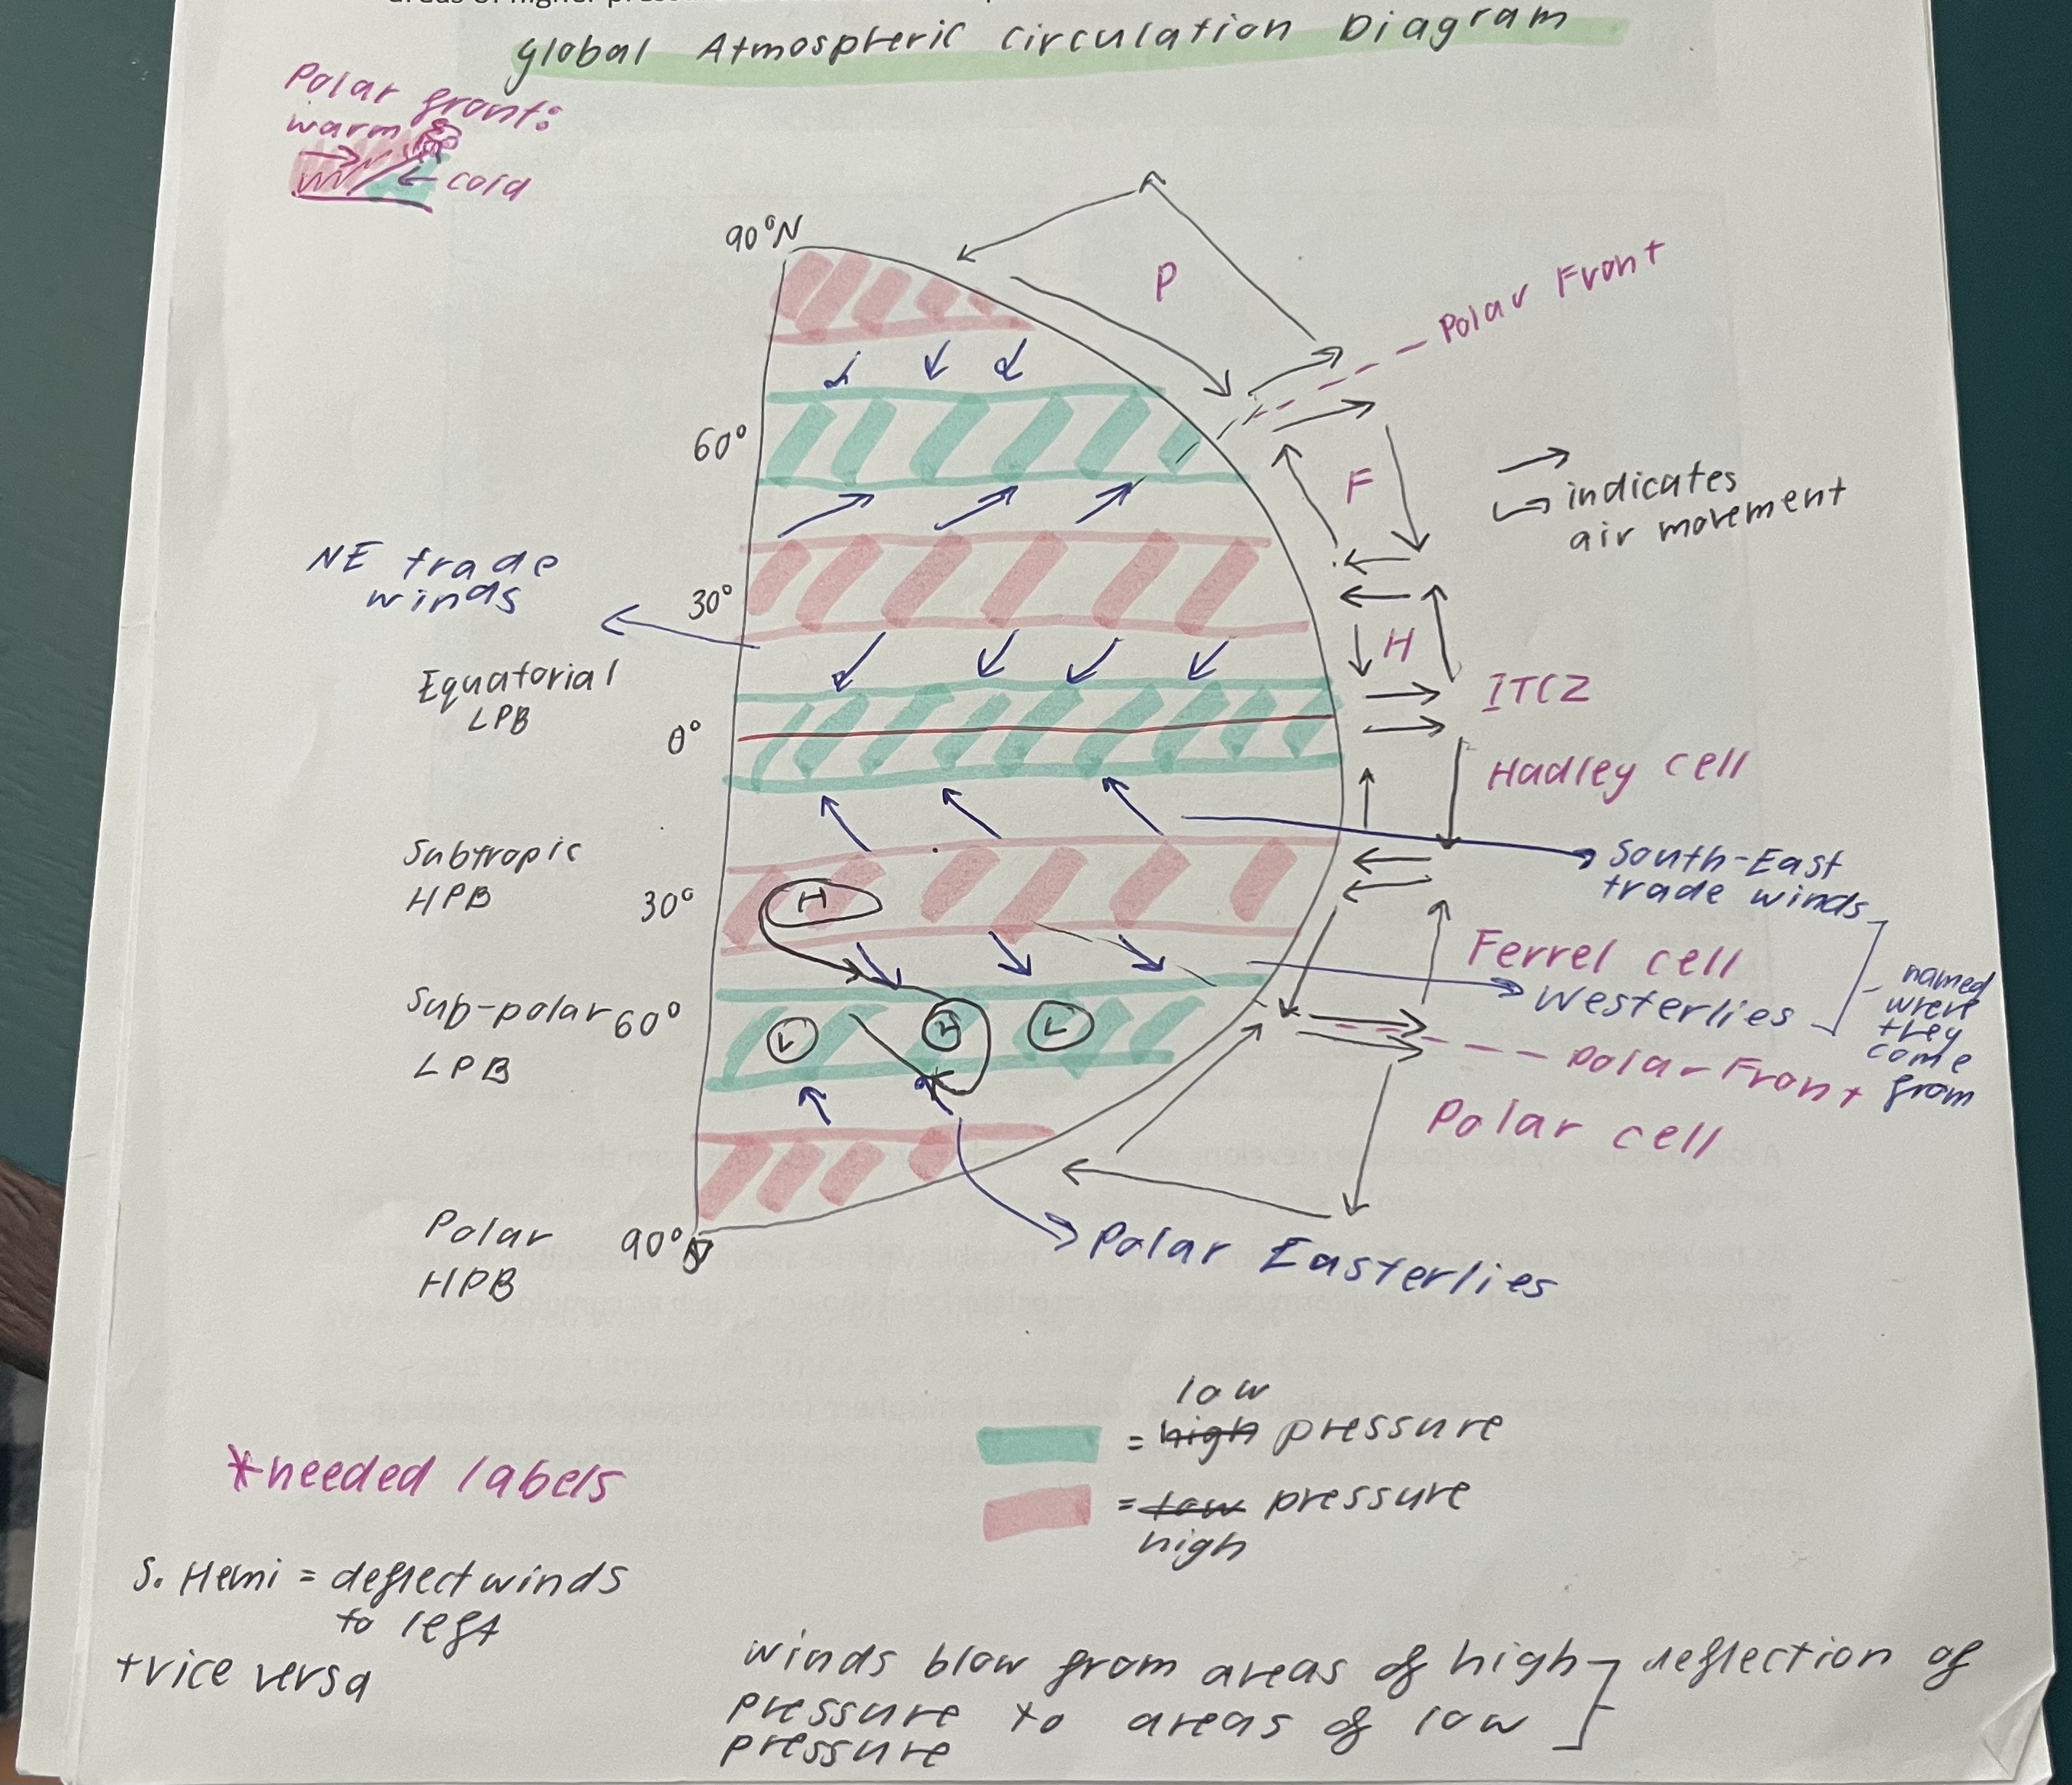
Draw the global atmospheric circulation diagram
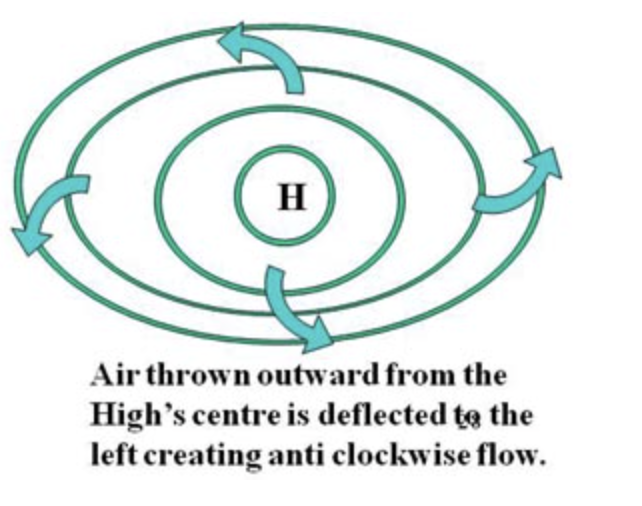
Describe a high pressure cell
Also known as: anti-cyclones
Hectopascals: >1000hPa
Where: subtropical belt (30°) and poles (90°)
Synoptic map:
In/out flowing air: outflowing
Anti/clockwise (S.Hem): anti-clockwise
Rising/sinking air: sinking
Pressure gradient: gentle, isobars spaced apart (gentle winds)
Associated weather conditions: light winds, little/no rainfall, no clouds, wide temp. range
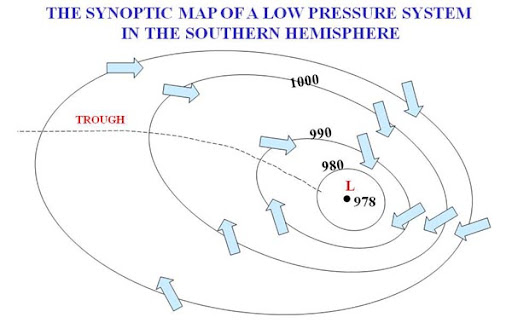
Describe a low pressure cell
Also known as: cyclones/depressions
Hectopascals: <1000hPa
Where: equatorial belt (0°) and sub-polar belt (60°)
Synoptic map:
In/out flowing air: inflowing
Anti/clockwise (S.Hem): clockwise
Rising/sinking air: rising
Pressure gradient: steep, isobars close together (strong winds).
Small and circular high pressure gradient (H to L) in smaller area pressure changes = high winds.
Associated weather conditions: rain, clouds, strong winds, unsettled and smaller temp ranges
Describe the equatorial low pressure belt
Strong heating by the Sun in the low latitudes creates convections, which causes the air to rise and a low pressure to form. This region has a lot of tree cover and regular rain.
Describe the sub-tropical high pressure belt
Air that has risen at the Equator nd lost most of its moisture, cools and descends at 30°North and 30°south. Sinking air pushes on Earth’s surface and leads to a high pressure. The climate here is hot and dry with very few clouds.
Describe the sub-polar low pressure belt
Cold polar air meets warm tropical air in an area called the polar front. The warm air is pushed up and leads to a low pressure. Storms and cold fronts are common here with lots of rain and strong winds
Describe the polar high pressure belt
Cold air at the poles sinks towards the earth's surface, causing high pressure. The climate here is very cold and very dry.
Explain the thermal equator
Moves north in a northern hemisphere summer and south in a southern hemisphere summer.
Define climate change
a long-term shift in global or regional climate patters or average atmospheric conditions.
What is the current ice cover % and what does this mean
10% therefore we are in an ice age
Define an ice age
A time where there is permanent ice at the poles
Earth’s past with ice ages
Earth has had at least 4 major ice ages. And 100% snow cover around 700 million years ago (snowball earth)
How did we escape snowball earth
Through volcanic activity, high CO2 lowered snow cover, over a very long time
What are the two periods within an ice age
Glacial (more cold) and interglacial (less cold)
What period of an ice age are we currently in
Interglacial period
Explain how these two periods work together
Ice sheets expand and contract in a regular rhythm, sea levels rise and fall and global mean temperature changes by 4°C to 7°
Explain the timing of these ice age cycle
A cycle occurs every 100 000 years. A glacial period lasts 70 000 years and interglacial periods last 10 000-30 000 years.
How has the interglacial period been important to our development
started 11 500 years ago and has be stable, allowing time for development.
What was the “Younger Dryas”
rapid natural climate change 14,500 years ago. N.Hemisphere returned to near-glacial conditions. then melted causing some of USA’s great lake e.g Lake Michigan
what are milkanovitch cycles and their affect
cyclical orbital movements that occur regularly over long periods of time that affect the distribution and insolation reaching earth.
What are milkanovitch cycles believed to be responsible for
they are believed to be responsible for the 100 000 interglacial-glacial cycles.
what is eccentricity
Eccentricity refers to changes in the shape of Earth’s orbit around the Sun, shifting between more circular and more elliptical over cycles of about 100,000 and 400,000 years. This affects the difference in solar energy received at perihelion (closest point to the Sun) and aphelion (furthest point), and is strongly linked to the 100,000-year rhythm of glacial–interglacial cycles.
what is obliquity
Obliquity is the variation in Earth’s axial tilt, which shifts between 22.1° and 24.5° over a 41,000-year cycle. A greater tilt produces more extreme seasons, while a smaller tilt creates milder seasons that favour the growth of glaciers.
what is precession
Precession, or the axial wobble, operates on a 26,000-year cycle and changes the timing of the seasons in relation to Earth’s orbit, influencing whether summers occur when Earth is closer to or further from the Sun. Together, these cycles alter the amount and distribution of incoming solar radiation (insolation), driving the advance and retreat of ice sheets
how do volcanoes influence the atmosphere
Volcanic activity is another natural driver of climate change, capable of influencing both short-term and long-term climate patterns. Explosive eruptions inject large amounts of dust, ash, and gases such as sulphur dioxide into the stratosphere, where they are converted into sulphuric acid aerosols that can remain for several years. These aerosols increase atmospheric reflectivity (albedo) and reduce the amount of solar radiation reaching Earth’s surface, producing a temporary cooling effect.
explain mr pinatubo example
the eruption of Mount Pinatubo in 1991 ejected about 10 cubic kilometres of material and caused global temperatures to fall by around 0.5°C for several years. A more extreme case was Mount Tambora in Indonesia in 1815, the largest eruption in recorded history. The vast amounts of sulphur dioxide it released lowered global temperatures by about 0.7°C and led to “the year without a summer” in 1816, when widespread crop failures and famine occurred across Europe and North America due to unseasonal frosts.
how do volcanoes affect earth over a long period of time
they can trigger short-lived cooling through aerosols
contribute to long-term warming through greenhouse gas emissions spec. C02
current concentration of CO2
425ppm (record high)
global average temperature increase rate
0.08°C per decade since 1880 and 0.18°C since 1981
hottest year on record
2024 by 1.6°C
effects of climate change
increases in global average air and ocean temperatures
heatwaves and extreme rainfall events becoming more common in many regions
the sea levels rising at an accelerating rate - currently 3.2mm per year
the intensity of severe weather events has increased
fewer frosts and the ice sheets of Antarctica & Greenland are shrinking
the timing of physiological processes in plants and animals is changing throughout the world, and populations are shifting their distributions.
What is direct evidence
Direct evidence refers to actual measurements of climate data (eg rainfall and temperature) and has only been available for less than 200 years.
what is the instrumental temperature record
it shows fluctuations of the temperature of earth's climate system documented in land and ocean temperatures.
what has evidence shown in relation to differences in temperature increase between continents
Evidence shows the temperature increase hasn’t been equal everywhere with temperatures in the Arctic (eg Alaska) rising most rapidly of all locations on Earth and continents warming more than oceans
what is a temperature anomaly
the difference between the actual temperature in a place and the long term average temperature for the same place and time.
explain the anthropogenic causes of global climate change with reference to the enhanced greenhouse effect
The earth is surrounded by an atmosphere, made up of lots of gas.
Some of these gases can absorb heat energy and these are known as greenhouse gases. This is a natural process and keeps the earth at a nice, liveable temperature (18°C warmer than it would otherwise be).
Human activities are increasing the amount of greenhouse gases in the atmosphere. More GHG means more heat is trapped, causing the earth to warm up. This is called the enhanced or anthropogenic greenhouse effect.
what are the GHG that humans are responsible for
The three main gases that humans are producing which enhance the greenhouse effect are carbon dioxide (CO2), methane (CH4) and nitrous oxide (N20).
what are the human and natural causes for CO2
natural: volcanoes and animal respiration
human: power stations, industrial processes and transportation
what are the human and natural causes for CH4
natural: wetlands and oceans
human: agriculture (cows and sheep)
what are the human and natural causes for N2O
natural: soils and oceans
human: agriculture (fertilisers)
relationship between CO2 emissions and development of country
high CO2 (>12.5t per person)> saudi arabia> developed, highly industrialised and urbanised (high power and cars)
low CO2 (<12.5t poer person)> chad> less developed, pop. based around agric. and rural pop.
how can countries react to climate changes
adapt - change self
mitigate - change or stop problem
define sustainability
meeting the needs of current and future generations through simultaneous environmental, social and economic adaptation and improvement
sustainability evaluation of kiriabati mangroves
ENVIRONMENTAL
pros: uses local mangroves, provides habitat for fish breeding and other animals, photosynthesis occurs therefore stores carbon
cons: changes the beaches, disruption of smaller seedlings, changes natural environment
ECONOMIC
pros: foreign aid, utilised for production and trade as used as source of building materials, dye and medecine
cons: cost $150 000, may impact tourism as beaches have changed
SOCIAL
pros: protects homes, “giants that protect them”, community works together to collect and plant them, community doesn’t have to move from ancestors, food security, jobs
cons: loss of views and access to beach
LONG TERM
not effective because they won’t forever hold back rising sea levels
Define development
the process of change in the economic and social structure of nations. An improvement in the standard of living.
how is development measured
It’s difficult to measure but universal indicators can help e.g GDP, literacy rates, life expectancy, employment rate and avg. Y
define well-being
the ability to access the things one needs to live a happy and healthy life. primary requirements include: fresh water, food, security, shelter and clothing
distinguish between more econ. developed countries (MEDC) and less (LEDC)
MEDC | LEDC | |
Population located | High % of pop. in cities or towns (urbanised) | High % of pop. in rural areas (country) |
Industry types | High industrialisation. High % of people work in secondary/tertiary industries | High % of people in agriculture |
Standard of living | High SoL: majority of people own homes, good access to education, have jobs, healthcare and high civic participation | Low SoL: most people in squalid accom., poverty, poor access to education, no job, no healthcare, low civic participation |
Example | Japan, USA, AUS, NZ, Canada | Chad, DRC, Niger |
Alternative names | first world countries | third world countries |
describe the spacial distribution of the least developed countries
less developed countries sit near the equator, between the tropics of cancer and capricorn.
they are primarily in Africa and Asia (Chad, Niger, Somalia and Yemen, Myanmar, Nepal)
Chad: land-locked
Nepal: on Eurasian tectonic plate boundary
what % of wealth does the top 1% control
46%
% living in extreme poverty
9% of world live in extreme pverty (less than $2.15/day)
define qualitative data w. examples
descriptions about people’s lives that are hard to measure e.g their human rights, political system and stability, freedoms, leisure
define quantitative data w. examples
measurable factors e.g avg. life expectancy, wealth, literacy rates
what is wealth measured by
GDP
what is health measured by
life expectancy
what is education measured by
literacy rates
what is the HDI
an index measuring health, wealth and education that gives a score from 0-1
country with highest HDI
Norway (0.94)
country with lowest HDI
Niger/Congo (0.34)
what is the OECD Better Life Index
measures housing, income, jobs, community, education, environment, governance, health, life satisfaction, safety, and work-life balance.
what is the sustainable society index and typical tred
measures countries based on three genres: environ, social and economic with subcategories.
high social and economic = low environ
what is an ecological footprint
measure a population’s demand for and ecosystem’s supply of resources and services
Haiti
located on a geological fault line: prone to storms
deforestation: prone to flooding
lack of city planning, bad infrastructure, large coastal populations and high dependence of farming magnifies issues
earthquake in 2010 killed 220 000 Haitians and displaced 1.5 mil
$8 billion for basic reconstruction
2015-2017: draught that led to crop losses of 70%
2016 hurricane destroyed housing, livestock and infrastructure
2021 earthquake destoyed 30% of local homes, killed 2000 poeople and displaced many more
dengue and malaria run rampant
cholera has killer 10 000 people and infected 1 million more
Yemen
HEALTH
malnutrition: 600 000 children under 5
disease: cholera + measles
measles: 2.6 mil children at risk as vacc. fac. shut down
2015: 70 000 men, women and children have either lost their lives or suffered serious injuries as a result of the conflict.
AGRICULTURE
landmines impede agric. activ.
agric. sector only supplies 15-20% of the food the pop. needs (only 30% of needed wheat)
POVERTY
economic collapse due to war and high poverty
$7 billion in damages from war
in Houthi controlled areas families spend >30% of Y on internet as needed for edu and work, if they don’t then un/e and no Y
high inflation making daily g+s unavailable
82.7% of population below poverty line
land mines hinder econ. development
EDCUCATION
school closures: 7.8mil students lost access to education
child soldiers: children, youngest 10, forced into armed groups instead of school
2.3 mil displaced students, who are 2x more likely to drop out
INFRASTRUCTURE
landmines cause damage to infrastructure e.g due to a 2016 explosion a water desal. plant closed, less clean water
2016: 3652 vaccine facs existed now it is less than 900 (25% of original #)