Methods of Human Health Assessment Final
1/106
There's no tags or description
Looks like no tags are added yet.
Name | Mastery | Learn | Test | Matching | Spaced | Call with Kai |
|---|
No analytics yet
Send a link to your students to track their progress
107 Terms
cross-sectional study
A study in which a representative cross section of the population is tested or surveyed at one specific time.
cross-sectional study strengths/weaknesses
Quick, inexpensive, and safe for participants
They may be subject to bias- difficult to create even groups
Cannot determine cause-and-effect relationships
longitudinal study
a study that observes the same participants on many occasions over a long period of time
longitudinal study strengths/weaknesses
Changes in the outcome variable cannot be attributed to differences between individuals
Eliminates risk of recall bias
Often time-consuming and expensive
Requires commitment and effective resources
Any potential insights from the study can take a long time to be discovered
Participants dropping out is common
observational study
observes individuals and measures variables of interest but does not attempt to influence the responses
observational study strengths/weaknesses
Less hypothetical- captures what people are actually doing (not what they say they will do)
The observer is a human with their own bias- one cannot know what the subject is thinking
No randomization, possible confounding bias
Case-control study
A type of epidemiologic study where a group of individuals with the diseases, referred to as cases, are compared to individuals without the disease, referred to as controls
case-control study strengths/weaknesses
Great for rare diseases/outcomes
Subjects are identified for the study based on their outcome status prior to study
Inexpensive, quick to conduct, and require fewer subjects
Often depend on past records or subjects' memories
Difficult to identify controls
Study is not blind (potential bias with selection)
prospective cohort study
A research study that follows over time groups of individuals who are alike in many ways but differ by a certain characteristic and compares them for a particular outcome.
retrospective cohort study
participants already have a known disease or outcome, and the study looks back to try and determine causation
cohort study strengths/weaknesses
Group sizes can be large
Provide insights into possible relationships between variables
Do not require extensive variable control
Timing of events can be obtained
Less expensive than RCTs
Not randomized and studies may be lengthy
Difficult to control for variables, and often not blind
Outcomes may suggest correlative relationships, but not causative relationships
Randomized Controlled Trial (RCT)
a research study using a true experimental design
RCT strengths/weaknesses
Provides best evidence for given treatment
Able to determine cause-and-effect relationships
Requires a large amount of variable control
May create an artificial environment that may not be generally representative
Randomization techniques used for selection
Sample sizes may be small and RCTs depend on compliance
Possibility of attrition
Can be expensive
Side effects can be dangerous
Correlation vs. Causation
Causation indicates that one event is the result of the occurrence of an event
Correlation means there is simply a relationship between variables
Two variables may have a casual relationship, but it is impossible to conclude which variable affects the other
Validity
the extent to which a test measures or predicts what it is supposed to (accuracy)
Reliability
consistency of measurement
feasibility
the state or degree of being easily or conveniently done
sensitivity to change
ability to detect a change when true behavior change occurs
Blood flow though the heart
O2 poor blood -> superior and inferior vena cava -> right atrium -> tricuspid/right AV valve -> right ventricle -> pulmonary valve -> pulmonary trunk -> pulmonary arteries -> lungs -> O2 rich blood -> pulmonary veins -> left atrium -> bicuspid/left AV valve -> left ventricle -> aortic valve -> aorta -> rest of body
5 major functions of the cardiovascular system
1. Delivers O2 and nutrients to cells in the body
2. Removes CO2 and metabolic waste products from cells in the body
3. Transports hormones from endocrine glands to their target receptors
4. Supports body temp. regulation and blood's buffering capability to control pH
5. Maintains proper fluid balance and helps prevent infection from invading organisms
SA node
where electrical activity originates in the heart
Parasympathetic innervation of the heart
Vagus nerve
-carries impulses to SA and AV nodes
-releases Ach, hyperpolarizes cells
-decreases HR and force of contraction
-decreases HR below intrinsic HR (100bpm)
Sympathetic innervation of the heart
Sympathetic cardiac nerves
-carries impulses to SA and AV nodes
-releases NE and facilitates depolarization
-increases HR and force of contraction
-release of epi from adrenal medulla can have similar effect
-increases HR above intrinsic HR during physical/emotional stress
Effect of endurance training on the heart
Elite athletes may have very low resting HRs (35 bpm) due to high vagal tone
Cardiac output
the total volume of blood ejected from the heart per minute
Q = SV x HR
Typical CO = 4.2-5.6 L/min
average CO = 5 L/min
Stroke volume
SV = EDV - ESV
EDV = end diastolic volume
ESV = end systolic volume
Measuring HR
Use ECG, pulse, or HR monitors/watches
-pulse can be measured at radial or carotid artery (don't use your thumb)
Typical resting HR
60-100 bpm
Tachycardia = HR > 100 bpm
Bradycardia = HR < 60 bpm
Max HR = 220-age
Measuring blood pressure
Measured with a sphygmomanometer and stethoscope
Can also use automated sphygmomanometer
Normal BP vs Hypertension
Normal SBP = < 120mmHg
Normal DBP = < 80mmHg
Prehypertensive SBP = 120-129mmHg
Prehypertensive DBP = < 80mmHg
Hypertensive SBP = >130mmHg
Hypertensive DBP= >80mmHg
AHA recommendations for hypertension
-eat a well-balanced diet that is low in salt
-limit alcohol
-enjoy regular PA
-manage stress
-maintain healthy weight
-quit smoking
-take medications properly
-work with your doctor
Importance of assessing dietary intake
Can be used to make associations between intake and disease or risk
Used in diet/health intervention research
Can be used in clinical settings
24 hr dietary recall
-interviewers should be trained in probing methods (5-step multiple pass)
-low participant burden
-very quick to administer
-recalls are usually unannounced, not likely to alter intake
-minimal problems relying on memory
-participants are generally willing to respond
-most accurate method of dietary assessment with correct methodology
-multiple recalls are needed to get a better typical intake
-under- and over-reporting errors can occur
Food intake records/diaries
-individuals should use measuring cups, scale, or diagrams
-does not rely on memory
-can serve as self-monitoring tool and motivation to improve dietary habits
-can be simpler logistically to administer
-individuals must be literate, motivated, and trained
-recording should be on typical days
-more burdensome for participants
-not realistic to use for large population studies
-provides info on recent diet, not past history
-people may alter eating habits while recording
Food Frequency Questionnaire (FFQ)
-relatively simple to administer by researcher or self
-could be scanned for analysis
-can be modified or expanded to adapt to different populations
-cost-effective and can be used in large samples
-may be more representative of usual dietary intake over longer time periods
-less precise
-often will underestimate caloric intake and overestimate micronutrient intake
Common problem with self-reported dietary intake
Possibility of under-reporting
-can be intentional if individual does not want to report consuming socially undesirable foods
-can be unintentional if forgotten items
Assumption for working with human tissues/fluids
-Assume that ALL blood is positive for HIV, HBV, and HCV
-Assume that ALL other human fluids/tissues are also positive
-Assume that ALL individuals are carrying these disease organisms
Handling human tissues/fluids
-Avoid skin contact with blood and other potentially infectious materials
-Avoid eye, nose, and mouth contact with blood and other potentially infectious materials
-Avoid punctures/sticks with contaminated sharp objects
Urinalysis
the examination of urine to determine the presence of abnormal elements
-minimally invasive
-tests for diabetes, UTIs, pregnancy, etc.
-reliable indicator of hydration status
-can be assessed by cloudiness and color
Urinary specific gravity
The density of urine as compared to water; the greater the solute in urine, the higher is its specific gravity
-typically between 1.003-1.030
-higher USG values can indicate dehydration
-values closer to 1.00 indicate adequate hydration
Biomarker
must be: valid, reliable, and sensitive to change
Examples: urinary sodium excretion, sugar intake
Blood glucose importance
Can be used to diagnose diabetes, prediabetes, hypoglycemia, and metabolic syndrome
Diabetes mellitus
a group of metabolic disorders characterized by hyperglycemia resulting from defects in insulin secretion, insulin action, or both
-T1D: insulin is not made/secreted
-T2D: insulin resistance
Prevalence rates of diabetes
Overall prevalence in the US is 9%
Among adults, 12%
Adults 65+, 25%
High prevalence among American Indian, Alaskan Natives, Blacks, and Hispanics
About 1 in 3 Americans has prediabetes
Measuring blood glucose
Fasting blood glucose (FBG) after 12 hour fast
-snapshot of BG
-does not represent overall BG
2 hr oral glucose tolerance test (OGTT): glucose drink given to determine insulin sensitivity
-only indicates insulin resistance
HbA1C indicates concentrations over past 8-12 weeks
-better picture of long-term BG
complications with diabetes
Glaucoma
Kidney disease
Neuropathy
Hearing loss
Gum disease
Stroke
Impaired circulation
Diabetes Prevention Program findings
we can reduce our risk of T2D by:
-modest weight loss
-reduced calorie intake of 500-1000 kcals/day
-reduced dietary fat intake
-add resistance training (not in study)
Risk reduction greater in DPP than in group given metformin drug
Metabolic syndrome
A syndrome marked by the presence of usually three or more of a group of factors
-high blood pressure
-abdominal obesity
-high triglyceride levels
-low HDL levels
-high FBG
that are linked to increased risk of cardiovascular disease and Type 2 diabetes
Visceral obesity is central feature
Risk factors: overweight/obesity, insulin resistance, race/gender, age
Coronary heart disease (CHD)
damage to the heart from the complete or partial blockage of the arteries that provide oxygen to the heart
manifested in clinical endpoints of myocardial infarction and sudden death
CHD vs CVD
CHD is one FORM of CVD
CVD refers to a variety of conditions affecting the heart and vascular system
CVD includes: CHD/CAD, congestive heart failure, stroke, peripheral vascular disease, hypertension
Dyslipidemia are CHD/CAD risk factors
CVD is the leading cause of death in the US
Positive and negative risk factors for CHD
Positive risk factors:
-smoking
-hypertension (>140/90)
-low HDL cholesterol (<40 mg/dL)
-high total and LDL cholesterol (>130 mg/dL)
-family history
-age (>45 men, >55 women)
-diabetes/prediabetes
-lack of PA
-overweight/obesity
-unhealthy diet
-stress
Negative risk factors:
-high HDL cholesterol (>60 mg/dL)
"good" vs "bad" cholesterol
"Good" cholesterol is HDL
"Bad" cholesterol is LDL
Optimal ranges for total cholesterol, LDL, and HDL
Total: <200 mg/dL
LDL: <100 mg/dL
HDL: >60 mg/dL
Why is LDL bad?
transports cholesterol around body and deposits it in the arteries
Can lead to accumulation in the sub-endothelial space, which can lead to atherosclerosis
Injury caused by hypertension and/or elevated LDL -> inflammatory response -> formation of a lesion -> develops into fatty streak -> fatty streak grows as platelets and monocytes adhere -> oxidized LDL can accumulate -> fatty streak develops into plaque -> fibrous cap forms over plaque, which can occlude vessel or rupture
How can we improve our cholesterol?
Reduce saturated fat intake, and replace it with PUFA or MUFA (do not replace with refined carbs or trans fats)
Maintain healthy diet, reduce intake of refined carbs, avoid excessive alcohol intake
Saturate fat intake of 5-6% total calories
Sodium intake < 2400 mg/day
Framingham risk score
this screening estimates the 10 year risk of having a CHD event.
Includes factors like age, total cholesterol, smoking hx, HDL, SBP, gender, diabetes, known vascular disease
Energy balance
We can measure or estimate expended number of calories
Weight gain occurs when energy intake exceeds expenditure
Weight loss occurs when energy intake is less than expenditure
Components of total energy expenditure
Daily total energy expenditure (TEE):
-Resting energy expenditure (REE) 65-75% of TEE
-Thermic effect of food (TEF) 5-10% TEE
-Energy expenditure of PA (EEPA) 15-30% of TEE
EEPA is the most variable component (determined by duration/intensity)
Primary determinants of REE
REE is the sum of metabolic rates of individual organs and tissues
Factors: body size, body composition, rage, age, sex, hormonal status, fever
Fat-free mass (FFM) contributes more to REE than fat mass
Methods for assessing energy expenditure
Direct calorimeter measures heat production
Indirect calorimeter measures O2 consumption and CO2 production (RER)
-whole room calorimetry (subject stays in room for 24 hrs; air is pulled through the room at known rate and analyzers measure fraction of O2 and CO2 in air)
-metabolic hood (takes about 45 min)
-handheld instrument (takes about 10 min)
RER and RQ
-RER (Respiratory Exchange Ratio) is the ratio of the volume of CO2 exhaled and the volume of O2 inhaled
- RQ (Respiratory Quotient) is measured at the tissues and is the content of CO2/O2 in the blood
RER indicates proportion of fats or carbs being oxidized
Resting RER with mixed diet is about 0.85
Falls between 0.70-1.0
Caloric equivalent
The number of kilocalories produced per liter of oxygen consumed
Depends on RER
Anthropometry
Assesses body dimensions in terms of: length, breadth, circumference, or skinfold thickness
-Anthropometry and body composition are used to assess nutritional status, proper growth in infants/children, outcome of nutritional or other interventions, effects of disease or trauma, or risk or chronic disease
Essential body fat
the minimum amount of body fat necessary for the proper protection of internal organs
-includes fat associated with CNS, bone marrow, cell membranes, and internal organs
Higher in females because it also includes fat in mammary glands and pelvic region
Males: 2-4%
Females: 10-12%
BMI ranges
BMI = weight (kg) / height^2 (m^2)
Underweight = < 18.5
Normal = 18.5-24.9
Overweight = 25.0-29.9
Obesity I = 30.0-34.9
Obesity II = 35.0-39.9
Obesity III = >40.0
Importance of BMI
Reverse causality (many people lose weight due to illness before death)
Overweight/obesity are associated with increased mortality risk
Excess weight is a strong risk factor for developing T2D and CVD
Major limitation: does not account for body composition; individuals with a lot of muscle mass will be misinterpreted as overweight
Converting BMI units
1 inch = 0.0254 meters
1 pound = 0.45392 kg
Body shapes and health outcomes
Lower body/gynoid/pear shape is associated with better health outcomes
Upper body/android/apple shape is associated with more adverse health outcomes
Many of the complications and risks associated with adiposity are more closely related to abdominal fat than obesity
Methods for assessing body composition
Skinfolds
Hydrostatic weighing (first method)
Plethysmography (air displacement/BodPod)- new gold standard
DEXA
Bioelectrical impedance (BIA)
Compartment models of body composition
2-compartment: FM and FFM
3-compartment: bone mass, FM,FFM
4-compartment: FM, total body water (TBW), bone mass, residual mass
5-compartment: adipose tissue, skeletal muscle, bone mass, blood mass, remaining tissue mass
Hydrostatic weighing
Uses 2-compartment model
-body density = body mass/volume
-assumes invariant density of FFM and FM from person to person
-person must blow out all residual lung volume
BodPod Air Displacement
Uses 2-compartment model
-body density = body mass/volume
-assumes invariant density of FFM and FM from person to person
-actually measures pressure changes with injection of air of known volume into chamber
-large body volume displaces air in chamber, resulting in bigger change in pressure
-high cost, and still assumes constant density of FM and FFM
Bioelectrical Impedance Analysis (BIA)
Uses 2-compartment model
A method of assessing body composition by running a low-level electrical current through the body.
DEXA
Uses 3-compartment model
-dual-energy x-ray absorptiometry
-most attenuation through bone, least through FM
Relationship of feasibility and validity
Generally a strong negative relationship between the feasibility of a PA assessment and its validity
As feasibility increases, validity tends to decrease, and vice versa
Least vs most valid method of PA assessment
Least valid: questionnaire
Most valid: doubly labeled water (DLW)
Pedometers vs. Accelerometers
Pedometers:
-tend to be more feasible and less valid than accelerometers
-counts steps/day
-can be used to categorize clients into PA groups
-objective, inexpensive, easy to use, moderate validity, interpretable
-have specific targets for Ex Rx
-don't capture all PA, and are not direct minutes of PA or EE
-limited reactivity
Accelerometers:
-differentiate between walking and running
-use equations to predict EE, time spent being active
-record number of bouts of activity
-high validity and reliability
-sensitive to change, non-reactive
-acceptable cost (kind of)
Steps/day recommendation
10,000 steps/day
-equates roughly to recommended amount of moderate PA (30 min/day)
-exact number was random (nice, round number that is easy to remember)
MET
metabolic equivalents that correspond to kcals burned
1 MET = 3.5 mL O2/kg/min
can be used to describe activity intensity
Electrical path through the heart
SA node, internodal atrial conduction tracts, AV node, Bundle of His, L and R bundle branches, Purkinje fibers
electrical activity measured by ECG
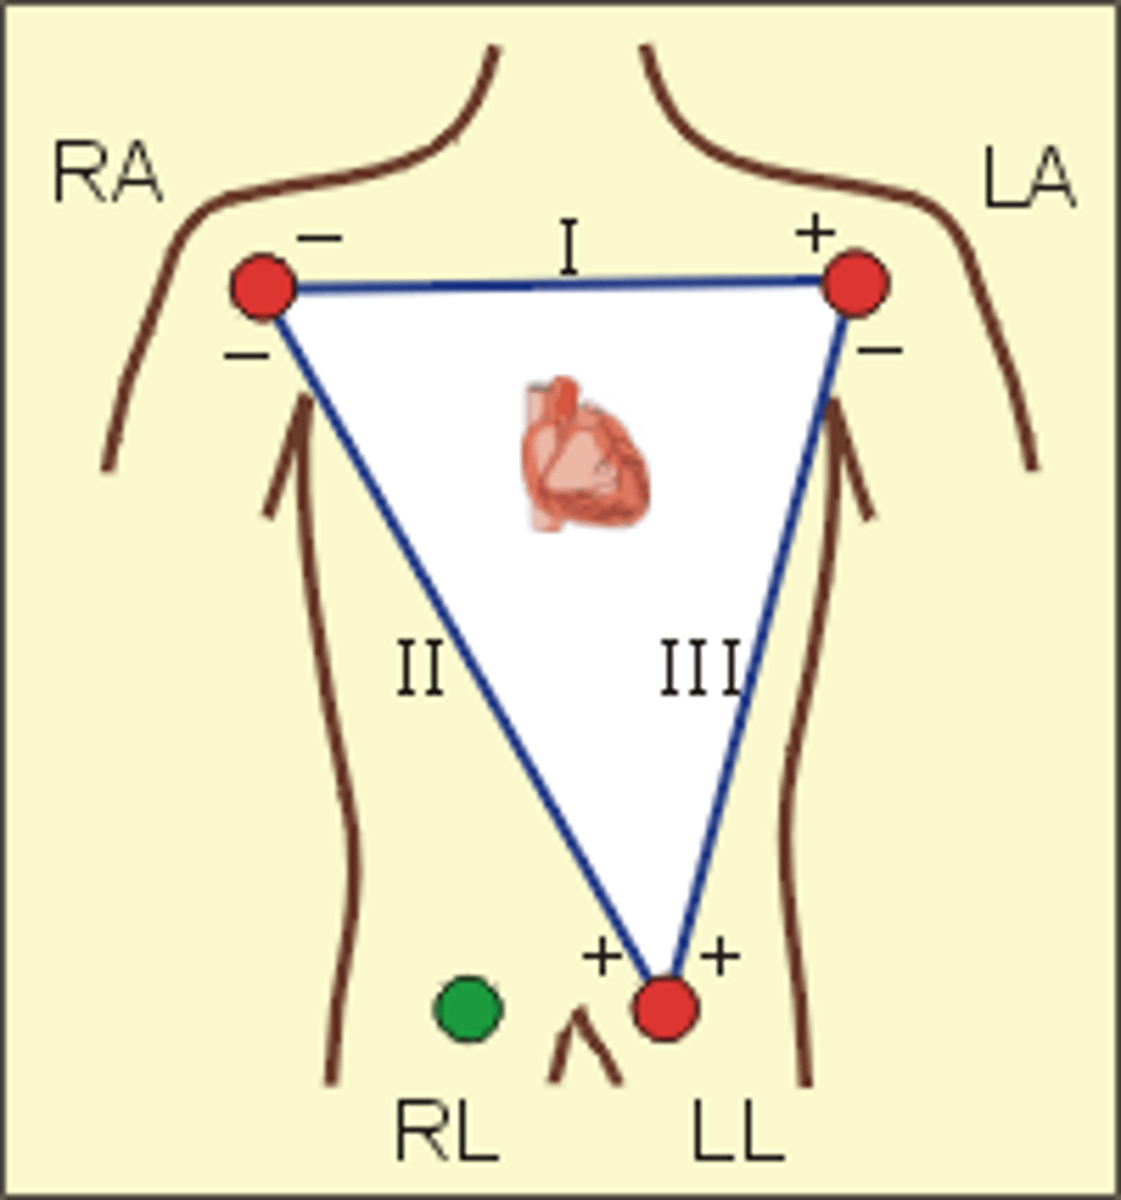
Einthoven's triangle
the triangle around the heart formed by the bipolar limb leads
shape forms an inverted triangle with the heart at the center that produced zero potential when summed
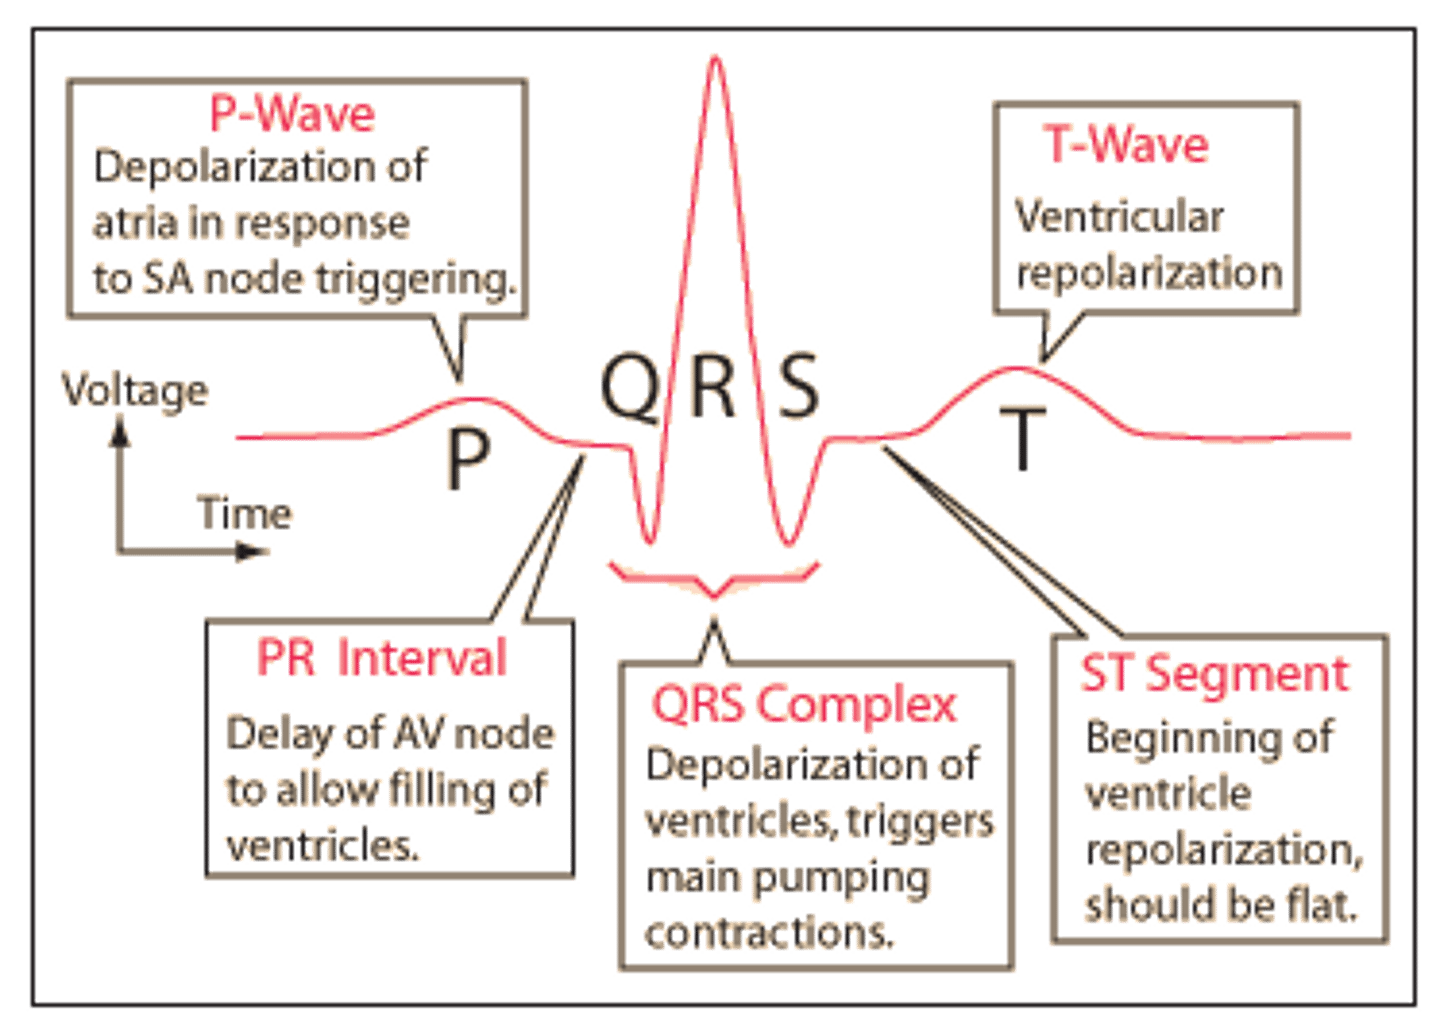
Components of ECG wave
P wave = depolarization of R/L atria
QRS complex = R/L ventricular depolarization
T wave = ventricular repolarization
PR interval = time interval from onset of atrial depolarization to onset of ventricular depolarization
QRS duration = duration of ventricular depolarization
QT interval = duration of ventricular depolarization and repolarization
RR interval = duration of ventricular cardiac cycle
Positive wave deflection (ECG)
Electrical impulse that travels TOWARDS the electrode produces an upright (positive) deflection
-if current flows in same direction as axis of lead, ECG stylus is deflected strongly upwards
-if current flows obliquely to axis of lead, stylus deflection is less strong
-if current flow is perpendicular to axis, there is no deflection
Negative wave deflection (ECG)
Electrical impulse that travels AWAY from the electrode produces a downward (negative) deflection
-if current flow is in opposite direction to axis of lead, stylus is deflected strongly downward
-if current flows obliquely in opposite direction of axis, stylus deflection is less strong
-if no current flow, no deflection of stylus
Respiratory Sinus Arrhythmia (RSA)
variability in heart rate in synchrony with breathing
-R-R interval is shortened during inspiration and prolonged during expiration
-normal variant can be seen in athletes with increased vagal tone
R-R method for HR
1500 / R-R mm (# of small boxes)
Graph paper method for HR
start with R on thick line, and the next 6 thick lines represent HRs of 300, 150, 100, 75, 60, & 50 bpm
estimate HR based on where next R wave lands
6 sec method for HR
number of ECG complexes in a 6 second interval (30 thick lines) multiplied by 10
BEST for irregular rhythms
VO2 max
Maximum oxygen uptake; most oxygen used when working the hardest you can
A measure of the functional capacity of the cardiorespiratory system
Predicts all-cause mortality
Sets upper limit for submaximal work, and can be useful for exercise Rx
Useful for assessing impact of disease status
VO2 max ranges
Sedentary college-aged female: 35-40 ml/kg/min
Sedentary college-aged male: 40-45 ml/kg/min
Joan Benoit (Olympic marathon champion): 78.6 ml/kg/min
Bjorn Daehlie (Olympic cross-country skier): 94 ml/kg/min
5 factors that affect VO2 max
1. Age- decreases in VO2max with age due to age-related reductions in PA levels
2. Gender- about 20% lower in women
3. Level of conditioning- maximum level is reached within 8-18 months of heavy endurance training
4. Specificity of training- the closer the training is to the sport, the greater the improvement in the sport
5. Heredity- accounts for as much as half the variation if VO2max and the individual's response to training
6. Altitude- decreases as altitude increases due to reduction in partial pressure of O2
Absolute vs relative VO2
Absolute: L/min or mL/min
-used when we measure VO2max on cycle ergometer when weight is supported
Relative: ml/kg/min
-used when we measure VO2max when weight is not supported
Measuring VO2max
Maximal exercise testing involves measuring maximal O2 consumption using a treadmill or cycle ergometer with the use of indirect calorimetry
Submaximal testing is often used to predict VO2max because it is easier and does not require the expensive equipment to measure gas fractions and ventilation
Key assumptions for submaximal exercise testing
-Max HR for a given age is uniform (220-age)
-Linear relationship between workload and VO2 (assumes that O2 consumptions of a specific workload is always the same)
-Linear relationship between HR and workload/O2
-A steady-state HR is obtained for each given exercise workload
-Mechanical efficiency (VO2 at a given work rate) is the same for everyone
-HR will vary depending on fitness level between subjects at any given workload
Variables involved with VO2 testing
Positive linear relationship between workload and VO2
Positive linear relationship between HR and VO2
HR is lower at any submaximal workload in endurance-trained state
Heart rate reserve (HRR)
HRR = HRmax − HRrest
5 criteria for a valid VO2max test
1. Plateau in O2 consumption of <150 ml/min with increasing workload
2. Achievement of age-predicted maximal HR
3. RER > 1.1
4. RPE = 17-20
5. Plasma lactate concentration >8.0 mmol
3 of these must be met
Fick equation
VO2 = Q x a-vO2 difference
O2 consumption depends on blood flow (cardiac output) and O2 extraction (difference in arterial and venous O2 content)
Resting VO2:
250 ml/min = 5000 ml/min x (20-15 ml/100 ml)
Maximal VO2:
4560 ml/min = 30,400 ml/min x (20-5 ml/100 ml)
Muscle strength
maximal force that can be generated by a muscle or muscle group
Muscular power
amount of work being done in a movement divided by the time it takes to perform (explosiveness)
-product of strength and speed
-sports: weightlifting, football, gymnastics