PY 211 - Exam Two
1/50
There's no tags or description
Looks like no tags are added yet.
Name | Mastery | Learn | Test | Matching | Spaced |
|---|
No study sessions yet.
51 Terms
properties of a normal distribution
Symmetric about the mean; Mode, median, and mean are at the same point; Area under the curve and to the right of the mean is equal to area to left of mean; Curve approaches but does not touch zero; Area under the curve is exactly 1
68-95-99.7 rule (empirical rule)
Within a normal distribution, 68% of scores will fall within +/- 1 standard deviation (SD) of the mean; 95% within 2 SDs of the mean; and 99.7% within 3 SDs of the mean.
(Almost all scores will fall between 3 SDs of the mean.)
z-score
a measure of how many standard deviations you are away from the norm (average or mean)
raw score
A test score that has not been transformed or converted in any way
positive z-scores
reflect deviations from above the mean; above average
negative z-scores
reflect deviations below the mean; below average
what are z-scores used for
to compare raw scores from two different distributions on the same playing field
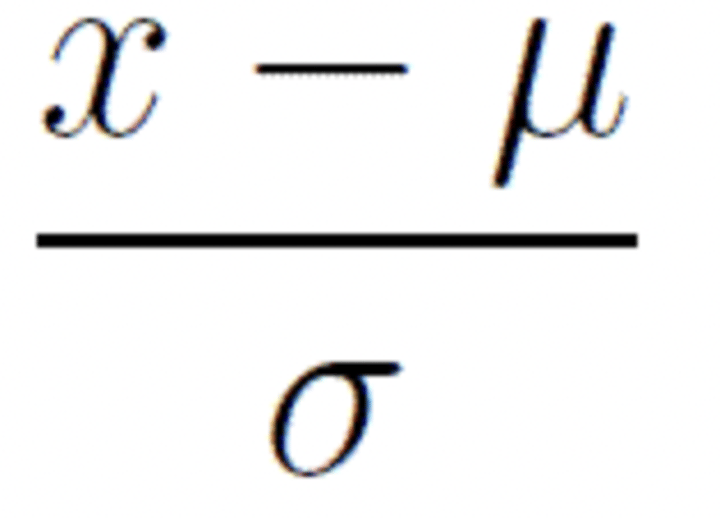
z-score formula (finding z-score from a raw score)
(raw score-population mean)/population standard deviation
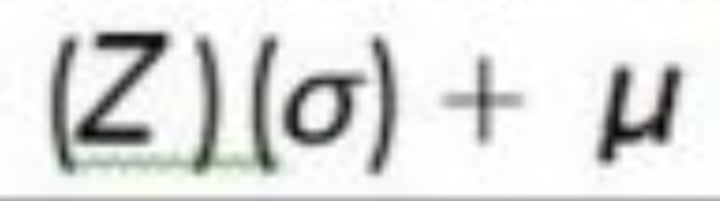
raw score formula (finding raw score from z-score)
standard deviation(z-score)+population mean=raw score
what does it mean when you have a larger standard deviation
the z-score is closer to 0
random process
a situation in which we know what outcomes could happen, not which particular outcome
probability
likelihood that a particular event will occur; cannot be less than zero or greater than one
probability formula
number of desired outcomes/number of possible outcomes
Law of Large Numbers
as a sample size grows, its mean gets closer to the average of the whole population
disjoint outcomes (mutually exclusive)
two outcomes that cannot happen at the same time (i.e., a coin cannot land on heads and tails at the same time)
non-disjoint outcomes
two outcomes that can happen at the same time (i.e., a student can get an A in stats and an A in Econ in the same semester)
random variable
a variable whose value is a numerical outcome of a random event
discrete random variable
variable that only takes integer values (i.e., number of credit hours)
continuous random variable
variable that takes a decimal value (i.e., the cost of books this semester)
sampling distribution of means
a probability distribution that represents a statistic (i.e., mean) for all possible sample sizes of a given size from a population (i.e., why is the true population mean of homeless people in Atlanta)
central limit theorem
as sample size (n) increases, the sampling distribution of means follows a normal distribution of means; the mean of the sampling distribution will be the population; the standard of distribution of means is the standard error of the mean
what is the standard error of mean
the standard deviation of the sampling distribution of the mean
formula for SEM
standard deviation/sqr(n)
what happens to error as the population mean changes
as population mean increases, error decreases
what makes a good hypothesis
if-then statement; testable
hypothesis test
a method to make informed decisions/ draw conclusions about a population based on a sample; helps determine if there is enough evidence to support and claim or hypothesis about a population
difference between a hypothesis v. hypothesis testing
hypothesis describes a population and hypothesis testing deals with a sample and then the results are generalized to the larger population
null hypothesis
a statement or idea that can falsified, or proved wrong
research hypothesis
a definite statement that a relationship exists between variables
directional research hypothesis
prediction of the specific outcome of an experiment
nondirectional research hypothesis
a specific prediction concerning the outcome of an experiment is not made
what do words like more, greater than, less, etc. indicate
direction (when direction is indicated only focus on that information)
=
example of a nondirectional research hypothesis
the average score of 9th graders is different from the average score of 12th graders on a memory test
Example of a null hypothesis
There is no difference in plant growth between nutrients present and no nutrients present groups
example of a directional research hypothesis
the average score of 12th graders is greater than the average score of 9th graders on a memory test
one-tailed test
a hypothesis test in which the research hypothesis is directional
two-tailed test
a hypothesis test in which the research hypothesis is non-directional
when do you use a one-tailed test
if you have a specific prediction about the direction of the difference
when do you use a two-tailed test
if you want to determine if there is any difference between the groups you are comparing; null hypothesis testing
steps of hypothesis testing
formulate a hypothesis, determine alpha levels and critical values, calculate the statistics (SEM and z-score), report
cutoff scores (critical values)
If reached or exceeded, the null hypothesis is rejected
What happens when the alpha value is adjusted
there is a larger range of p values for which we would reject the null hypothesis
what happens to alpha level during a two-tailed test
divided by two
structure of reporting the results of a hypothesis test
With a z-score obtained of __________ we __________ the null hypothesis and conclude that ___________, p</>0.05 (< is used when rejected, > is used when accepted)
type I error
Rejecting null hypothesis when it is true
Type II error
failing to reject a false null hypothesis
Effect Size (Cohen's d)
the magnitude or size of the experimental treatment
Power Estimation
Power is the ability of a statistical test to detect significant differences between subgroups of a population when differences really do exist; studies with more participants have more power.
small effect size
d=.20-.49
moderate effect size
d=0.5-0.79
large effect size
d=.8