Lecture 3: Descriptive and Graphing
1/54
There's no tags or description
Looks like no tags are added yet.
Name | Mastery | Learn | Test | Matching | Spaced |
|---|
No study sessions yet.
55 Terms
Levels of Measurement (LoM)
Nominal
Ordinal
Interval
Ratio
Characteristics of Nominal Variables
Attributes are named.
Characteristics of Ordinal Variables
Attributes are named.
Attributes can be ordered.
Characteristics of Interval Variables
Attributes are named.
Attributes can be ordered.
Distance is meaningful.
Characteristics of Ratio Variables
Attributes are named.
Attributes can be ordered.
Distance is meaningful.
Absolute zero.
Descriptive statistics
Describing the data.
Inferential statistics
Making inferences about the population based on the sample.
Parametric statistics
Estimate the parameters of a population, based on the normal distributions.
Includes: mean, standard deviation, skewness, kurtosis.
Non-parametric statistics
Do not assume sampling from a population which is normally distributed.
Includes median, frequencies.
Characteristics of Parametric statistics
More powerful - more sensitive
More assumptions - normal distribution
Vulnerable to violations of assumptions - less robust
Non-parametric statistics
Less powerful - less sensitive
Fewer assumptions - do not assume a normal distribution
Less vulnerable to assumption violations - more robust
Central tendency
Statistics which represent the ‘centre’ of a frequency distribution. Includes mode, median, and mean.
LoM and Central Tendency
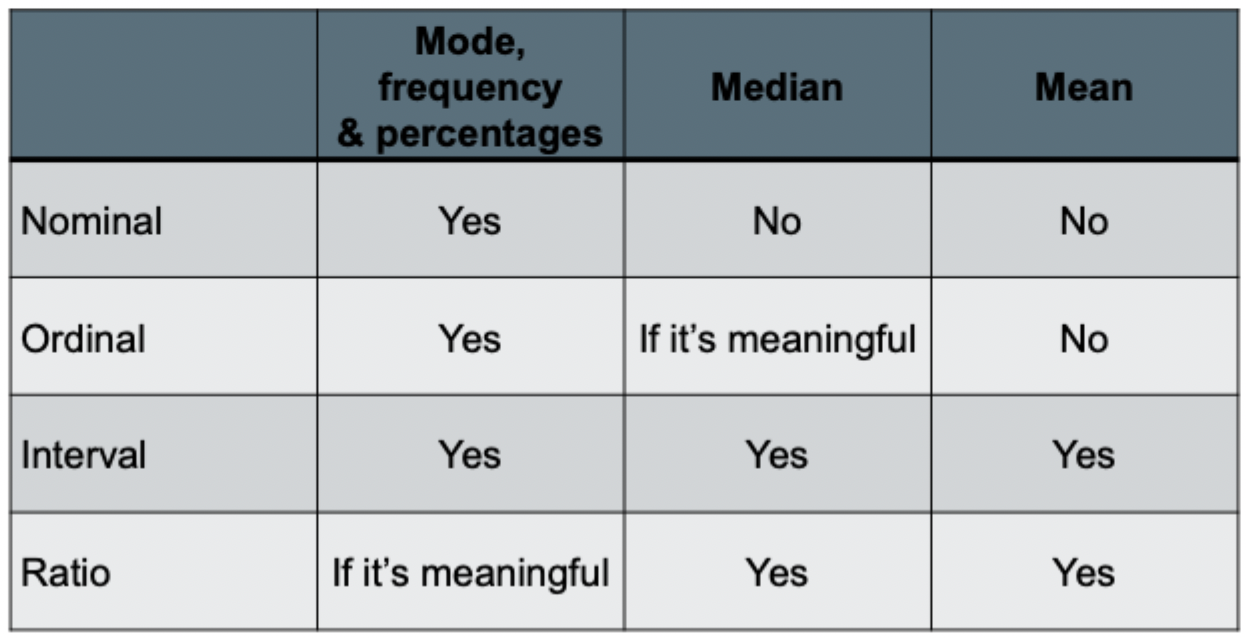
Mode (Mo)
The most common/frequent score; the highest point in a frequency distribution, the most common response.
Frequencies (f) and percentages (%)
The number of responses in each category, and the percentage of responses in each category.
Median (Mdn)
The mid-point of the distribution; Quartile 2, 50th percentile.
Mean
The average score.
Distribution
Measures the shape, spread, and dispersion of your data, as well as the deviation from the central tendency.
Which statistics can you use for non-parametric stats?
Minimum and maximum
Range
Percentiles
Which statistics can you use for parametric stats?
Standard deviation
Skewness
Kurtosis
LoM and Distribution
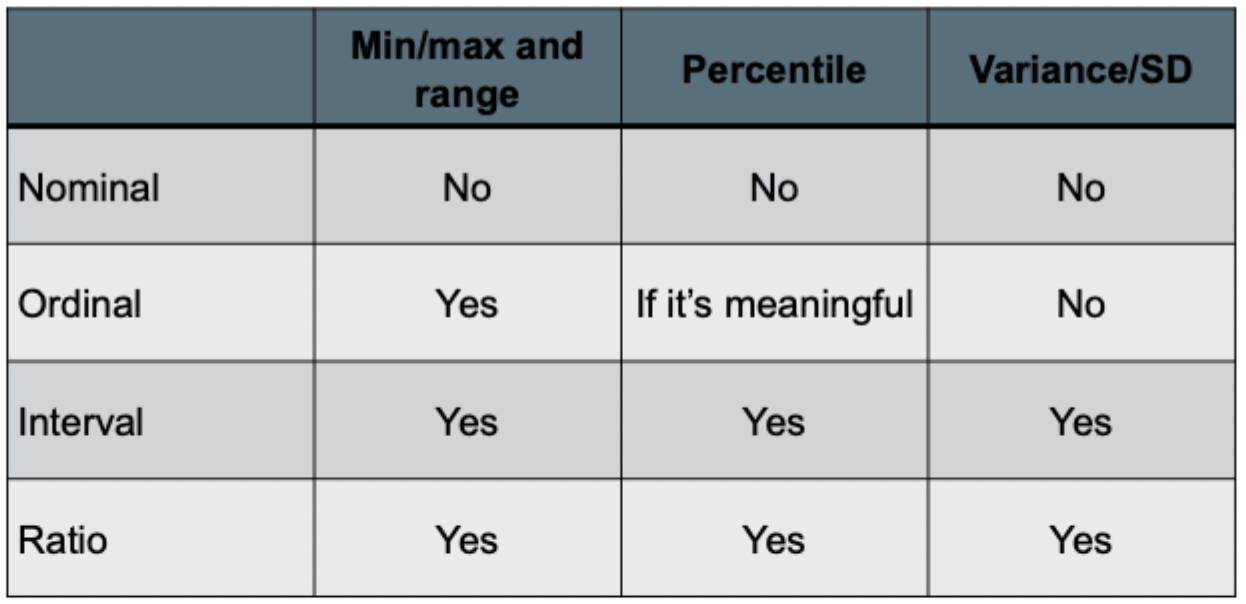
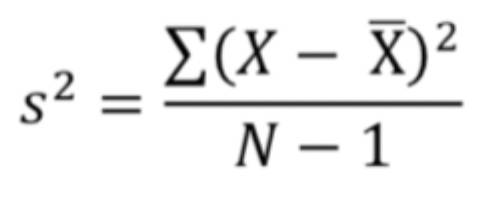
Variance
The average squared distance from the mean.
Variance Formula
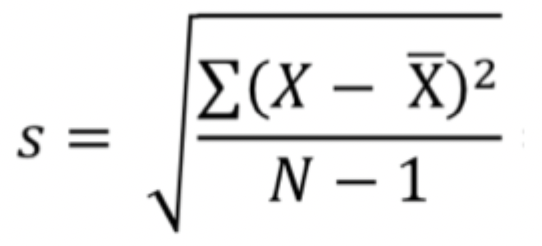
Standard Deviation (SD)
The square root of the variance.
Standard Deviation (SD) Formula
Descriptives for Nominal Data
Which is the most frequent? (similar to the mode)
Which is least frequent?
What are the frequencies?
Cumulative percentages
Ratios
Descriptives for Ordinal Data
Which is the most frequent? (similar to the mode)
Which is least frequent?
What are the frequencies?
Cumulative percentages
Ratios
Percentiles
Descriptive for Interval Data
Central tendency - mode, median, mean.
Shape/spread - minimum, maximum, range, standard deviation, skewness, kurtosis.
Descriptives for Ratio Data
Central tendency - mode, median, mean.
Shape/spread - minimum, maximum, range, standard deviation, skewness, kurtosis.
Ratios
What can you use to describe central tendency?
Frequencies
Percentages
Mode
Median
Mean
What can you use to describe the distribution?
Minimum and maximum values
Range
Quartiles
Standard deviation
Variance
Four Components of a Normal Distribution
Mean
Standard deviation
Kurtosis
Skew (negative or positive)
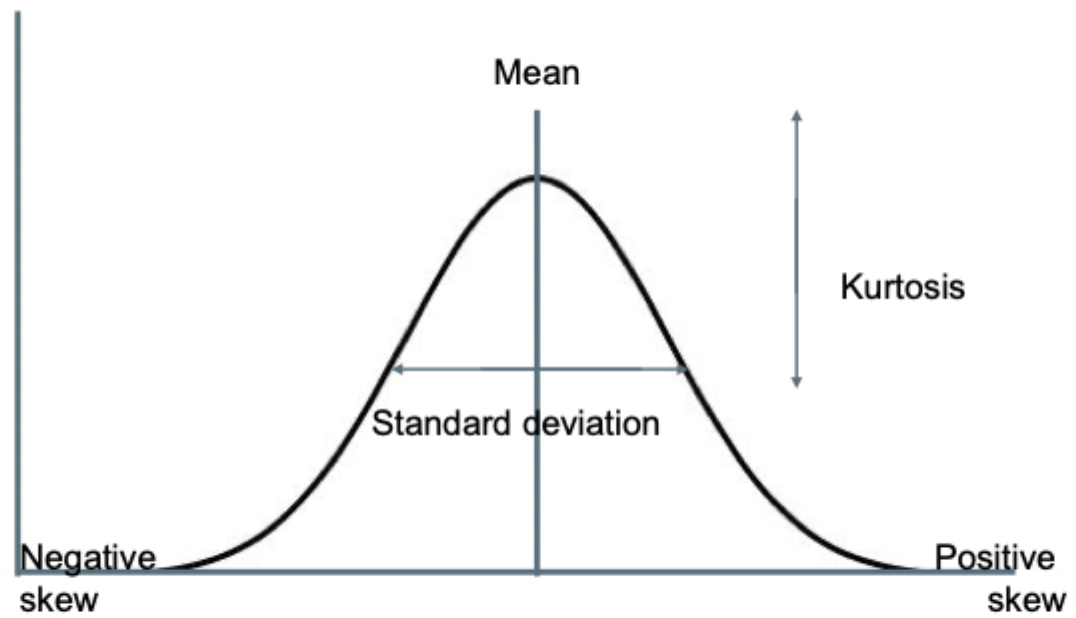
68-95-99.7 Rule
68% of the data are within 1 standard deviation of the mean.
95% of the data are within 2 standards deviations of the mean.
99.7% of the data are within 3 standard deviations of the mean.
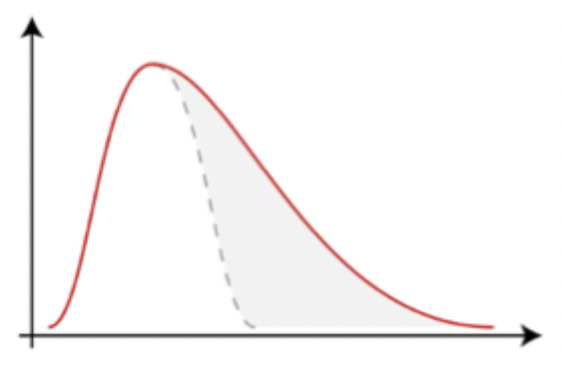
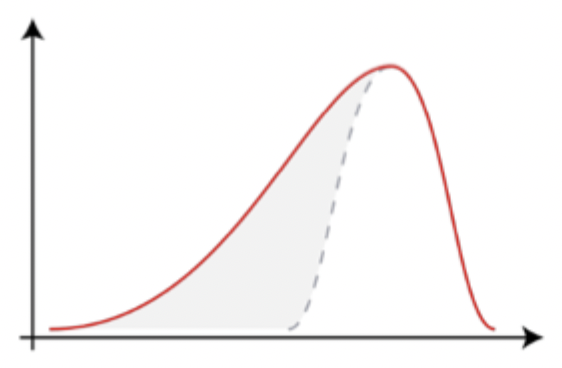
Skewness
A measure of the lean of the distribution.
Positive skew
Tail to the right
Negative skew
Tail to the left
What causes skew?
An outlier
Floor effects
Ceiling effects
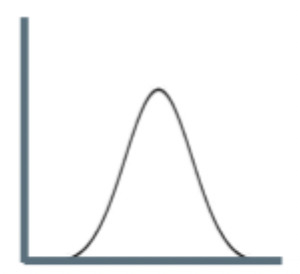
Kurtosis
How flat vs how peaked the distribution of data is.
Positive kurtosis
Peaked data
Negative kurtosis
Flat data

Examples of Kurtosis
Leptokurtic - narrow, skinny, peaked
Mesokurtic - moderate
Platykurtic - flat
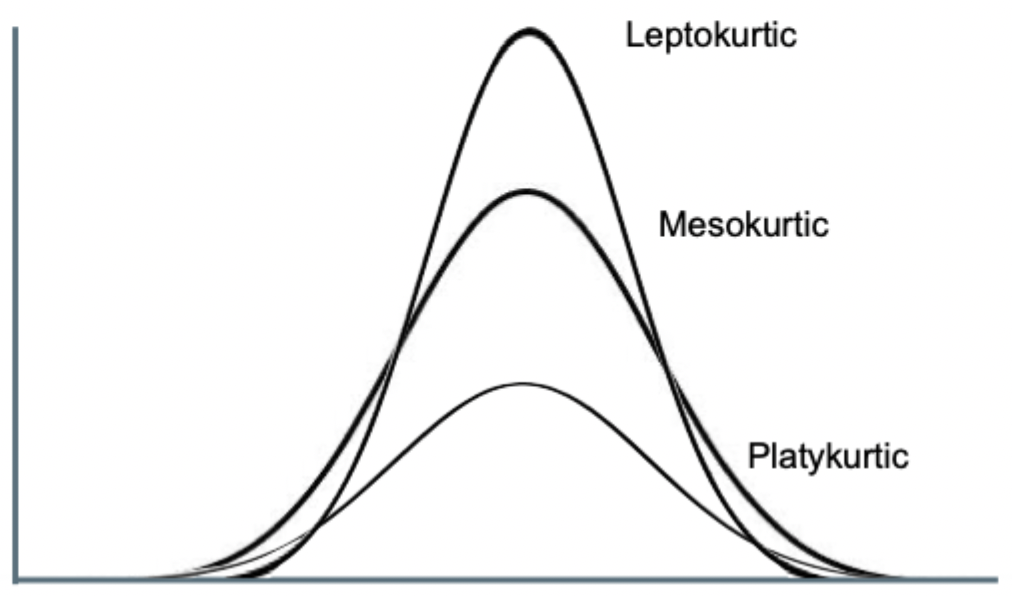
Things to look at on non-normal distributions
How many peaks are there?
One peak = unimodal
Two peaks = bimodal
More than two peaks = multi-modal
Is there a tail? (skewness)
To the right = positive skew
To the left = negative skew
How peaked or flat is it? (kurtosis)
Flat = platykurtic
Peaked = leptokurtic
How does skew effect measures of central tendency?
In a normal distribution (symmetrical), the mean = median = mode.
If there is positive skew, then mode < median < mean.
If there is negative skew, then mean < median < mode.
Statistics to describe a non-normal distribution
Use non-parametric descriptive statistics:
Minimum and maximum value
The range of values (maximum - minimum)
Percentiles
Quartiles:
Q1
Q2 (median)
Q3
Interquartile ratio (Q3 - Q1)
Steps to take when graphing
Ask yourself, what is the purpose of the graph?
Select the type of graph to use.
Draw and modify graph to be clear, non-distorting, and well-labelled.
Non-parametric (nominal or ordinal) graphs
Bar graph
Pie chart
Parametric (normally distributed interval or ratio) graphs
Histogram
Stem and leaf plot
Box plot
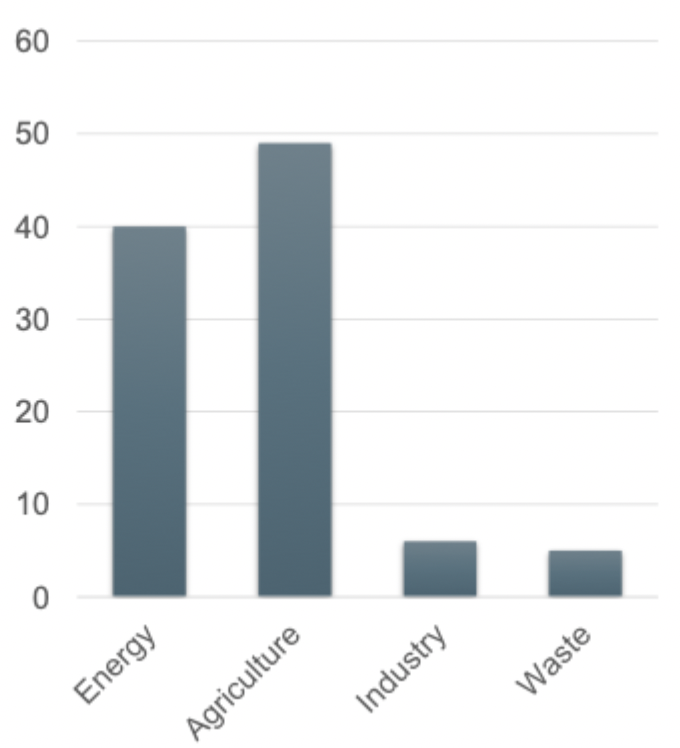
Bar chart/bar graph
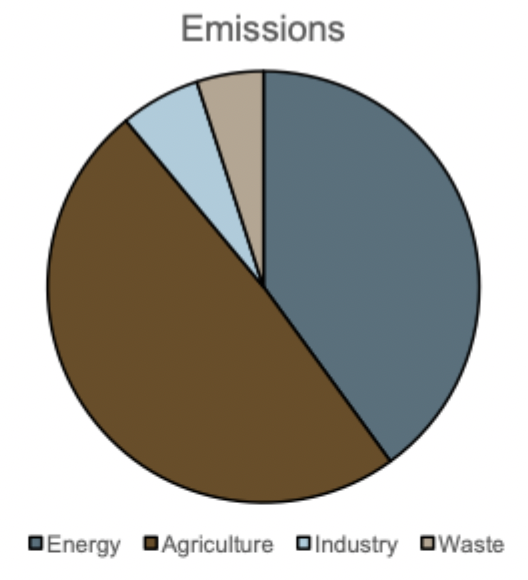
Pie chart
Histogram
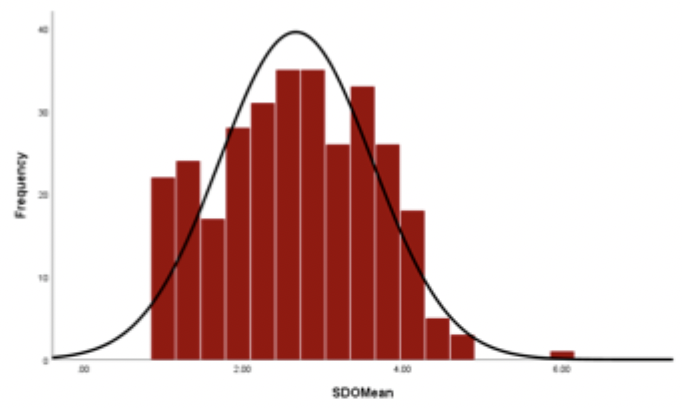
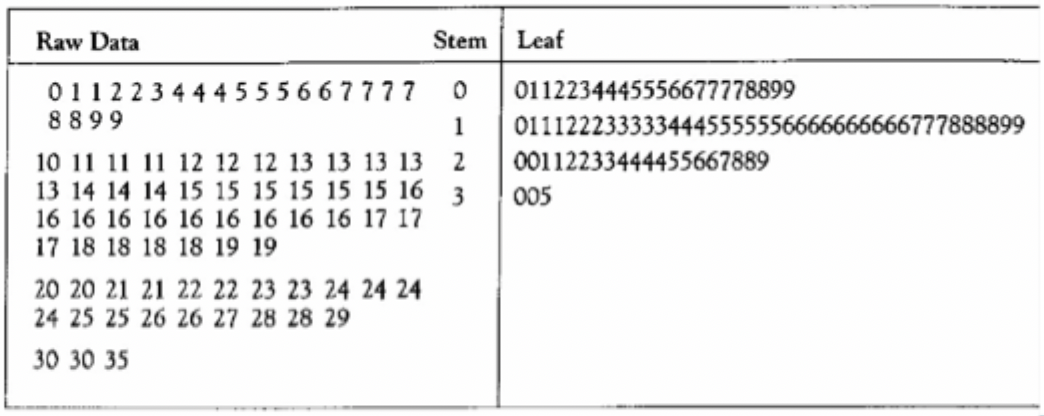
Stem and leaf plots
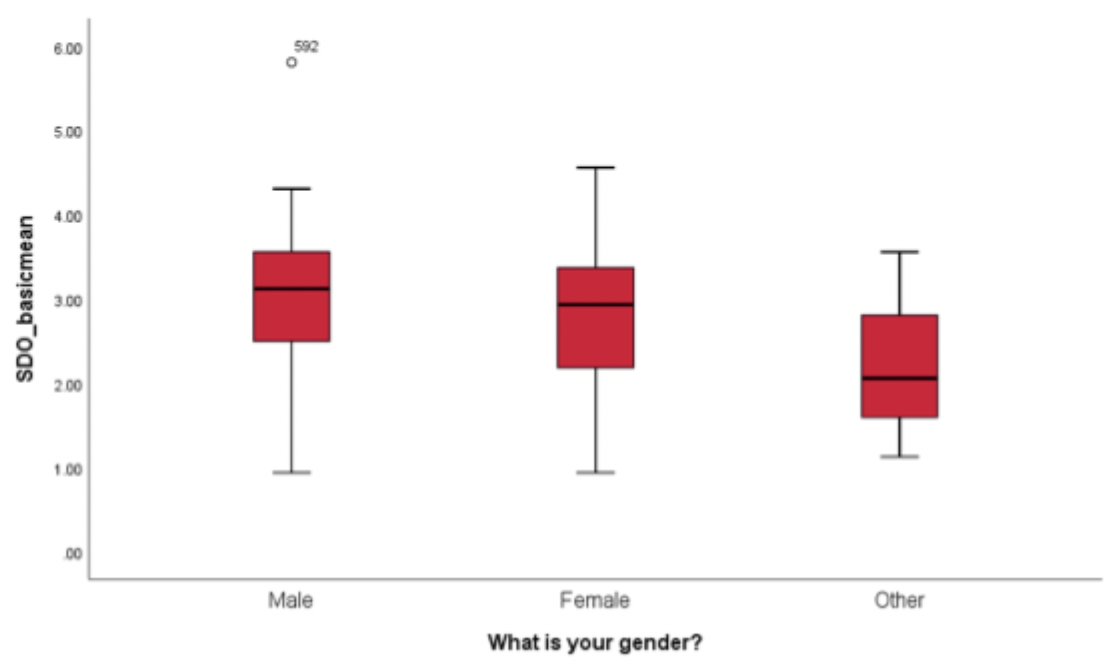
Box plot
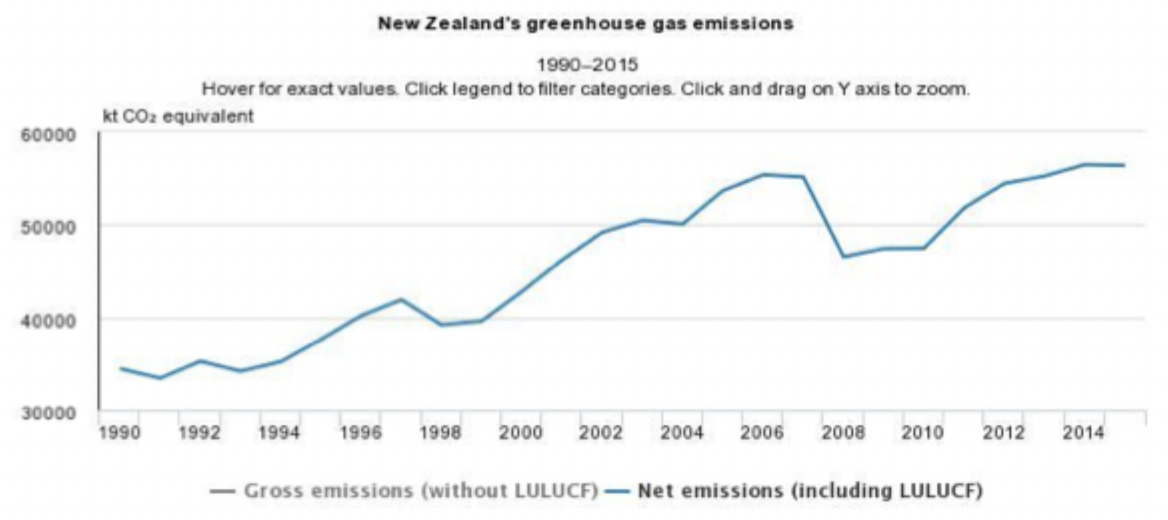
Line graph
Tufte (1983) on graphical integrity

Misleading graphs
Graphs that:
Use area of perspective in misleading ways.
Leave out important context.