Experiment
1/11
Earn XP
Description and Tags
Name | Mastery | Learn | Test | Matching | Spaced | Call with Kai | Chat |
|---|
No analytics yet
Send a link to your students to track their progress
12 Terms
Measuring personal power apparatus
meter ruler
stop clock
newton scales
Measuring personal power method
First find your weight in newton's by finding your mass in kilograms using bathroom scales, then use the fact that 1kg has a weight of 10N
Next find height of staircase, by measuring average height of stair using metre ruler and multiplying by total number of stairs in the staircase.
Finally, you need to have someone who will time you as you run up the stairs using a stopwatch.
For reliability experiment should be repeated and average power of pupil determined
Measuring personal power measurements
Measurements: some typical measurements that might be obtained are:
o Mass of student in kg: 45
• Weight of student in N: 450
• Height of risers in cm: 14.0, 13.8, 13.8, 14.0, 13.9
• Average riser height in cm 13.9
Number of risers: 30
• Staircase height: 13.9 x 30 =417cm = 4.17 m
o Average time taken in s = 5.0
Time to run upstairs in s: 5.2, 5.1, 4.9, 5.0, 4.8
Principle of moments apparatus
Metre ruler
Retort stand and clamp
Mass carrier
100g masses
Twine
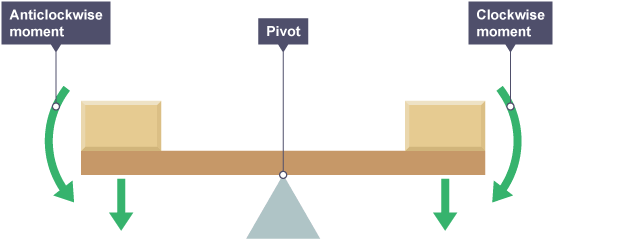
Principle of moments method
Suspend metre ruler at 50cm mark using twine. Adjust position of twine so rule does not rotate.
Hang unequal masses, mı, and m2 (100g slotted masses), from either side of metre ruler as shown. •
Adjust position of masses until metre ruler is balanced (in equilibrium) again.
Gravity exerts forces F₁ and F2 on the masses m, and m2. Remember that a 100g slotted mass is equivalent to IN.
Record results in table as shown below and repeat for other loads and distances.
Principe of moments results
Force Fi is trying to turn the metre ruler anticlockwise, and its moment is F₁ x di.
Force F₂ is trying to turn the metre ruler clockwise - its moment is F2 x d2.
When the metre ruler is balanced (i.e. in equilibrium), the results should show that the anticlockwise moment F₁ x d₁ equals the clockwise moment F2 x d2.
Hookes law apparatus
Record stand and clamp
Metre ruler
Spring
Mass carrier
100g masses
Safety googled
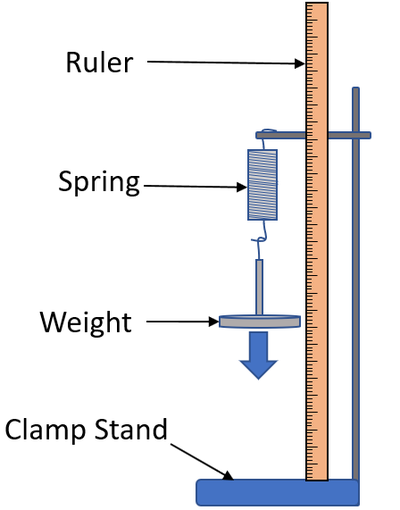
Hookes law method
Measure natural length of spring with metre ruler.
Add 100g (weight = 1.0 N) mass hanger.
Measure extended length of spring.
Calculate and record extension.
Add additional 100g mass (1.0N)
Repeat measurements and record results in table as shown below.
Draw graph of load/N on y-axis against extension/cm on x-axis.
Tuck in chair, take care not to overload spring to minimise risk.
Hookes law results
Graph produced. Straight line through origin. Part of region (AB) where Hooke's law is 4- obeyed. As you continued to add weights and take measurements of extension the graph will go beyond limit of proportionality and ceases to be straight line (linear) and begins to curve as shown
Average spreed apparatus
ramp
Wooden blocks
Ruler
Trolley
Stop clock
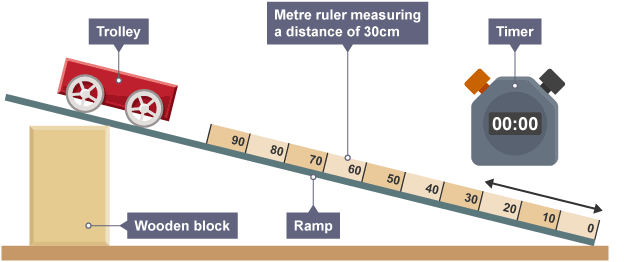
Average speed method
Set up ramp against small pile of wooden blocks.
With a ruler draw two pencil lines on ramp, one at top and other at bottom, 1.0m apart. This is distance, x.
Measure height of ramp, h. this is independent variable. The dependent variable is the average speed of trolley moving down the ramp.
Allow trolley to roll down ramp, starting from rest at upper pencil line and finishing as its wheels reach lower pencil line.
For each height, h, ranging from about 1cm to 5cm, time this motion a total of three times using stop clock and record results in table such as one shown below.
Calculate average time, t.
Plot average speed (y-axis) against height, h (x-axis). Line of best fit is a curve through the origin of decreasing gradient. Graph shows that average speed is not proportional to h, but it increases with h in some (unknown) linear way
Average speed results
Height | 1 | 2 | 3 | 4 | 5 |
|---|---|---|---|---|---|
Time | 8.2 | 5.9 | 4.6 | 4.1 | 3.5 |
Time | 8.2 | 5.8 | 4.7 | 4.1 | 3.7 |
Time | 8.1 | 5.8 | 4.8 | 4.2 | 3.9 |
Average time | 8.2 | 5.8 | 4.7 | 4.1 | 3.7 |
Average Speed | 12.2 | 17.2 | 21.3 | 24.4 | 27.0 |