Biostatistics exam 3 - Comparing Two Means
1/30
There's no tags or description
Looks like no tags are added yet.
Name | Mastery | Learn | Test | Matching | Spaced | Call with Kai |
|---|
No study sessions yet.
31 Terms
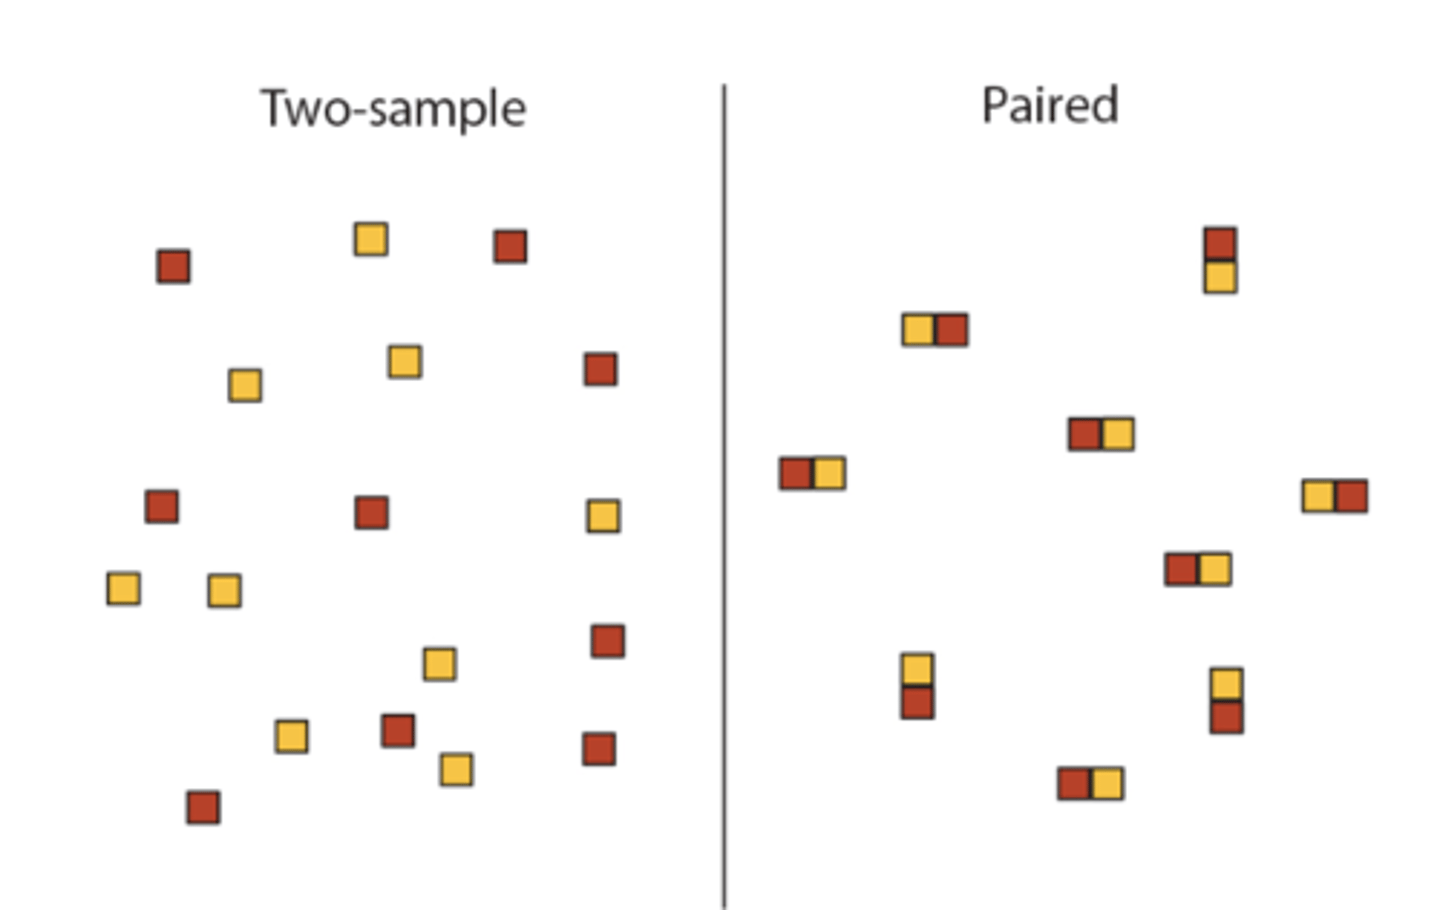
Different study designs for comparing two means
1. Two sample design
- two groups
- each group composed of independent sample of units (a sample in one group has no connection with individuals in the same group or other group)
2. Paired design
- two groups
- each sample unit receives both treatments
Paired design
Both treatments are applied to every sample unit
• paired designs are usually more powerful than a two-sample design
- control for variation among sampling units
- if you have the same sample units, you have the same spread
- two-sample → have two different spreads
• paired measurements are converted to a single measurement by taking the difference between them
- if there is no interaction, you expect the difference between the two measurements to be zero (mean difs should be 0)
two-sample design
Each treatment group is composed of an independent, random sample of units
• you have two different spreads
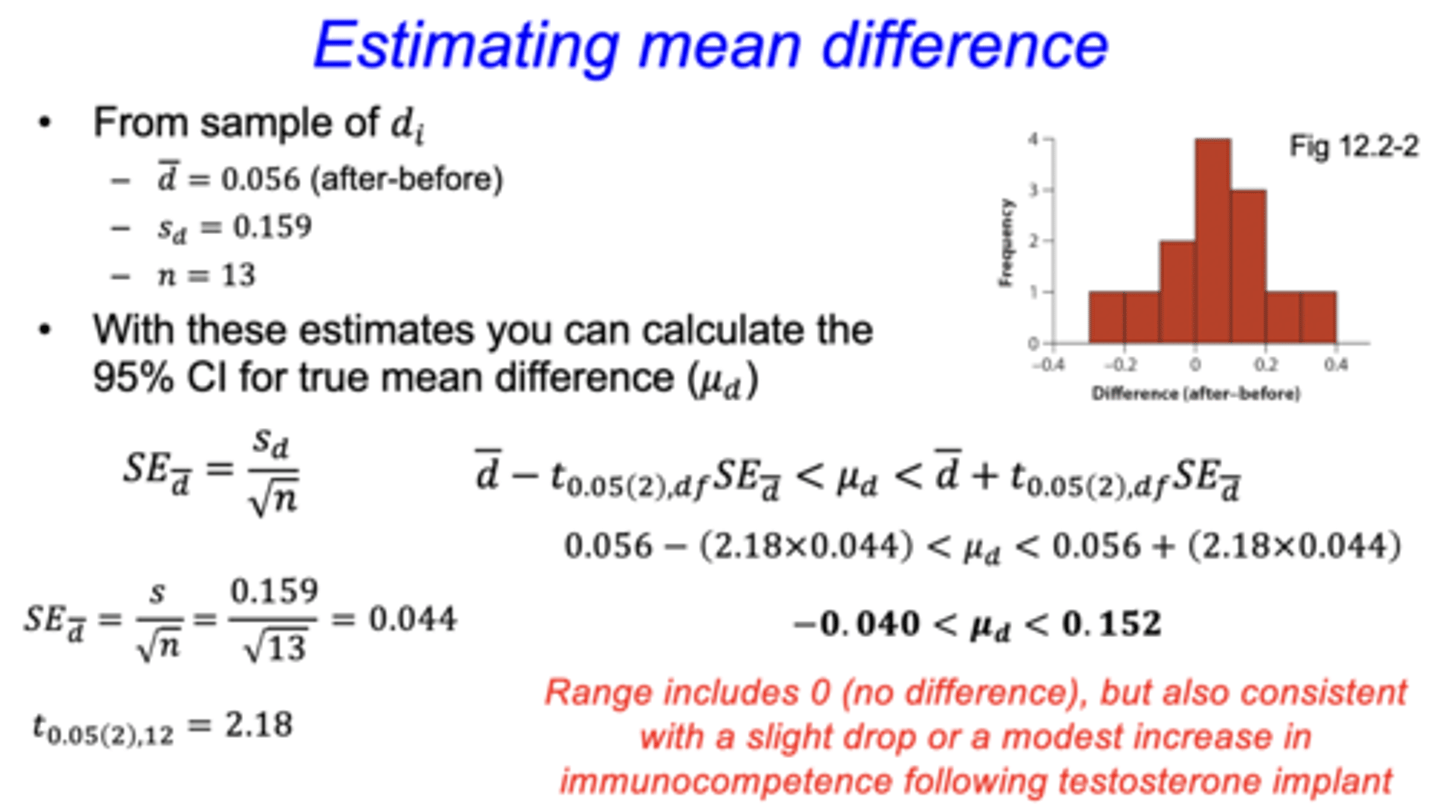
how to calculate the 95% confidence interval for the true mean of difference (µd) - paired design
d bar = mean of differences (i.e. after-before)
Sd = standard deviation of differences
n = sample size
• if the range includes 0, then there is no difference
- in the example, the range is consistent with a slight drop or a modest increase
Paired t-test
Used to test the null hypothesis that the mean difference of paired measurements equals a specific value
Paired t-test hypotheses
H₀: mean change in antibody production after testosterone implants was 0 (µd = 0)
Ha: mean change in antibody production after testosterone was not zero (µd ≠ 0)
*NOTE: some studies could do a ratio (A/B)
- if the study uses a ratio H₀=1
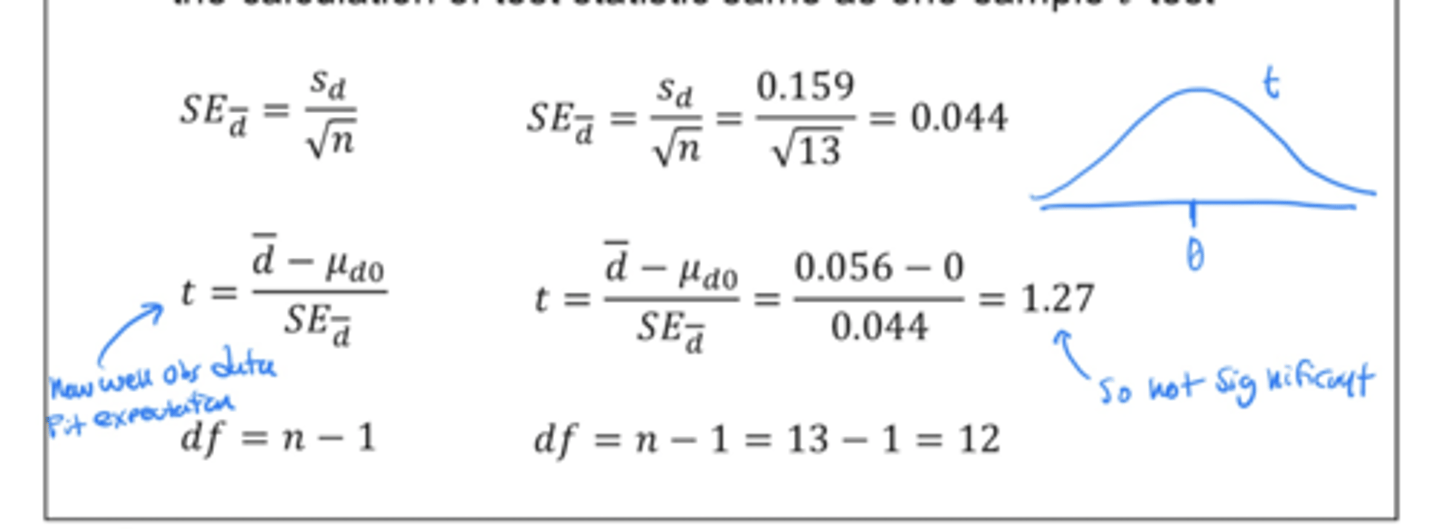
Paired t-test test statistic
when paired samples are reduced to a single measurement (d), the calculation of test statistic is the same as a one sample t-test
how do you determine p-value with a paired t-test?
1. with a computer
2. with a statistical table
Assumptions of paired t-test
1. sampling units are randomly sampled from the population
2. paired differences have a normal distribution in the population
Hypotheses for formal tests of normality
H₀: sample has normal distribution
Ha: sample does not have normal distribution
Why should formal tests of normality be used with caution?
1. small sample sizes lack power to reject a false null (Type II error)
2. large sample sizes can reject null when the departure from normality is minimal and would not affect methods that assume normality
Shapiro-Wilk test
evaluates the goodness-of-fit of a normal distribution to a set of data randomly sampled from a population
• most commonly used formal test of normality
•estimates mean and standard deviation using sample data
• tests goodness of fit between sample data and normal distribution (with the mean and standard deviation of the sample)
• p-val > 0.05 (normal/fail to reject), p-val<0.05 (reject normality)
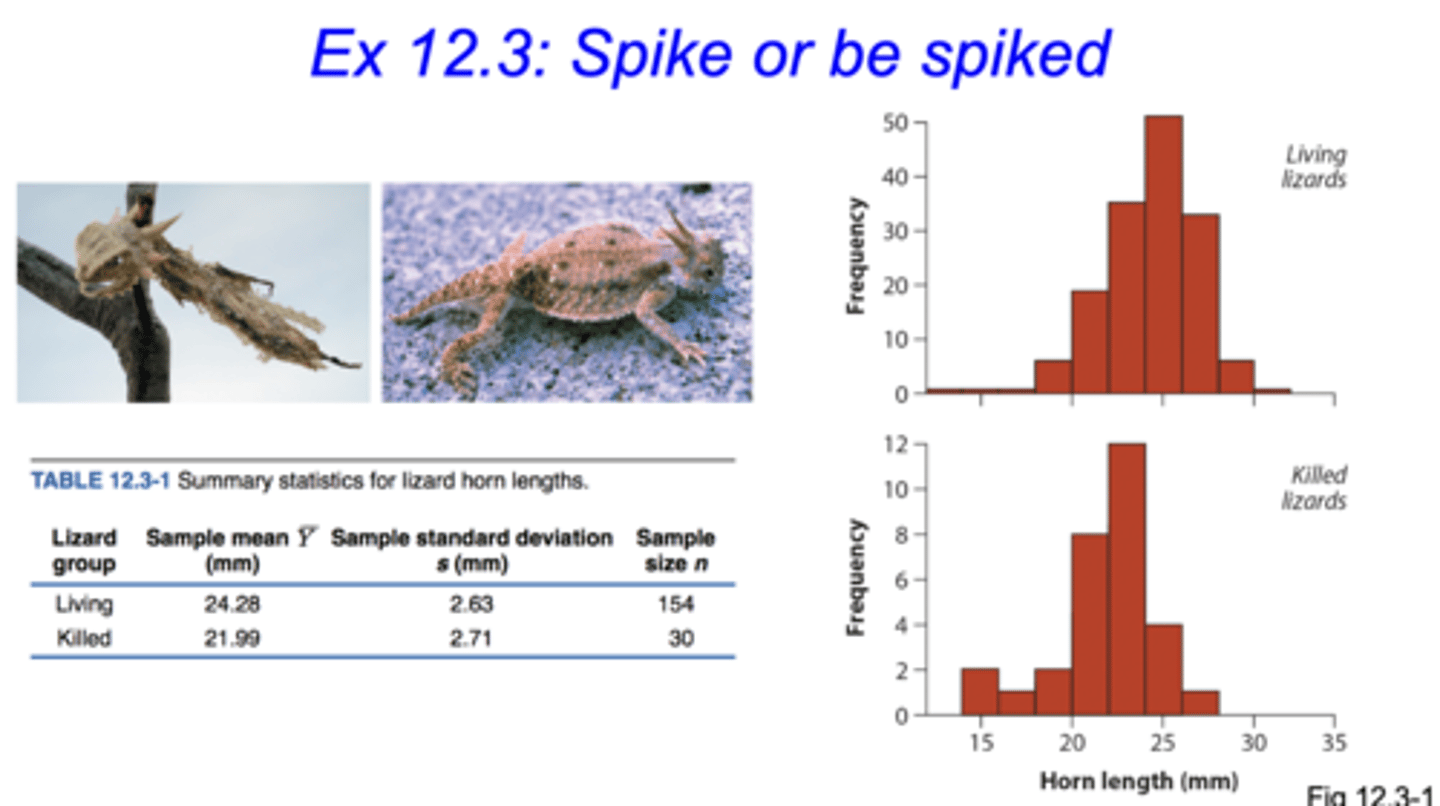
what type of graph should you use in a two sample design?
stacked histograms with the same x-axis
The two ways to analyze a two sample design
1. 95% confidence interval
2. two sample t-test
95% confidence interval for difference between two means (two sample design)
Statistic of Interest: Y₁bar - Y₂bar
• if there is no difference between means Y₁bar - Y₂bar = 0
•you need to take into account the pooled sample variance
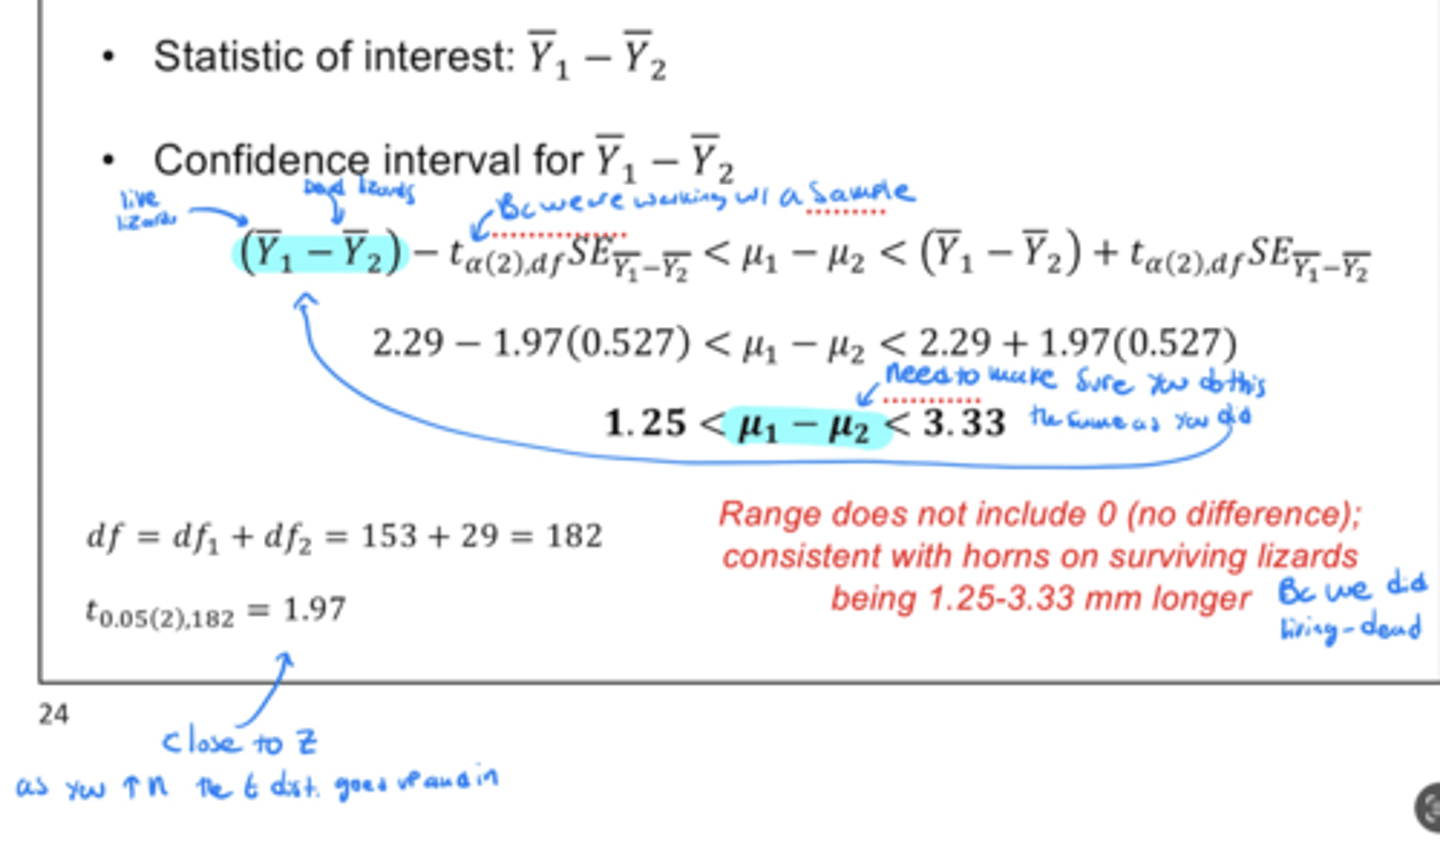
degrees of freedom for a 95% confidence interval of diff between two means
df = N - 2
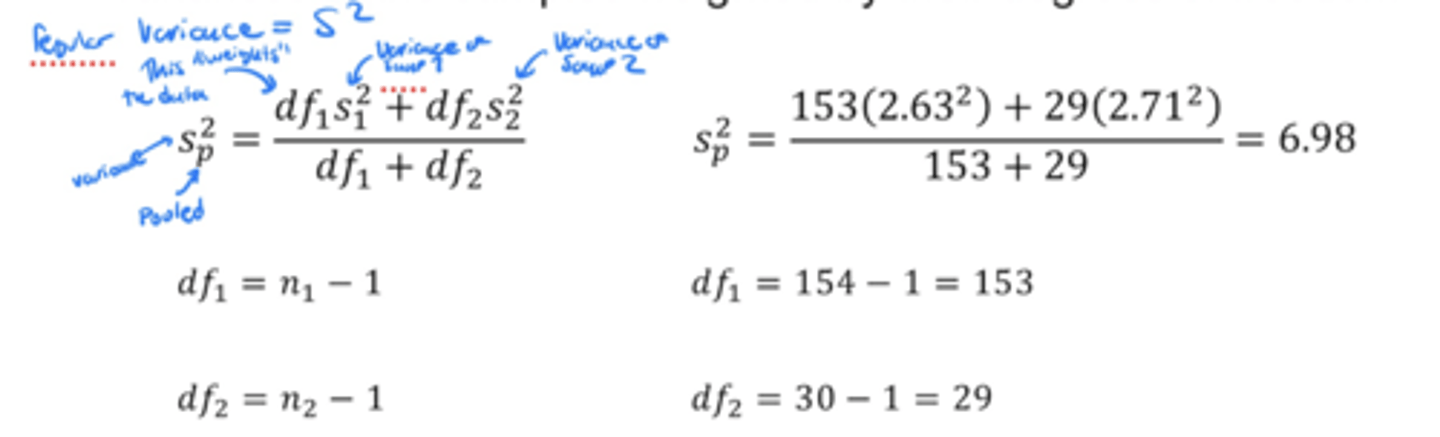
df = df₁ + df₂
df₁ = n-1
df₂ = n-1
calculating standard error of Y₁bar - Y₂bar
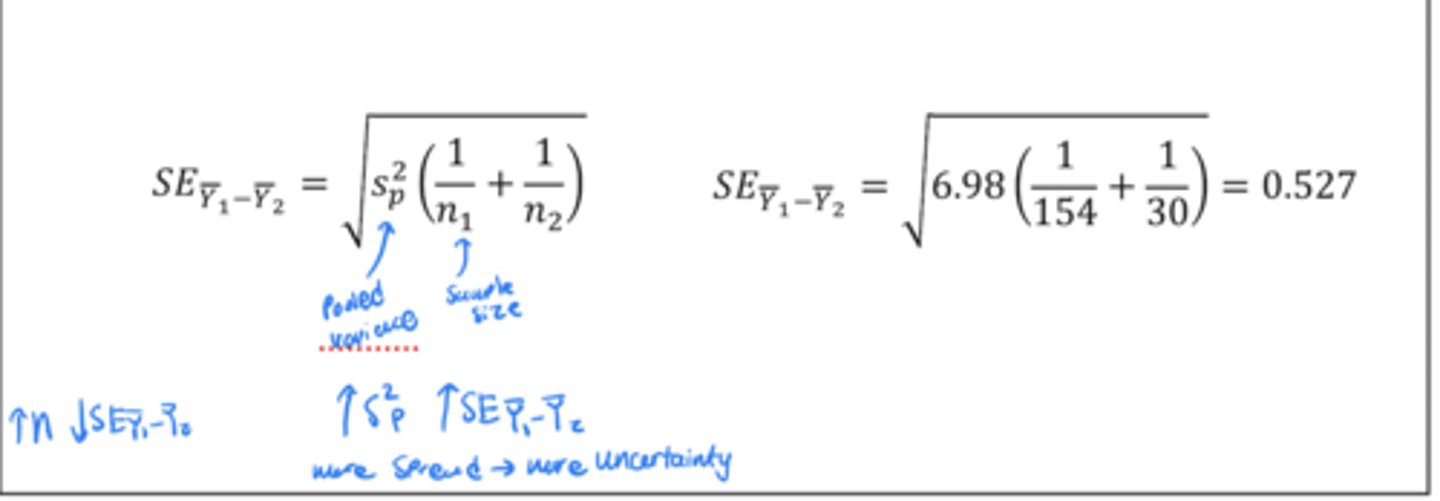
pooled sample variance Sp^2
The average of the variances of the samples weighted by their degrees of freedom
* NOTE: S=sd, V=S²
equation for pooled sample variance Sp^2
two sample t-test
Simplest test to compare the means of a numerical variable between two independent groups (usually means)
Hypotheses of a two sample t-test
H₀: µ₁ = µ₂
Ha: µ₁ ≠ µ₂
test statistic of a two sample t-test
t-value (diff equation!)
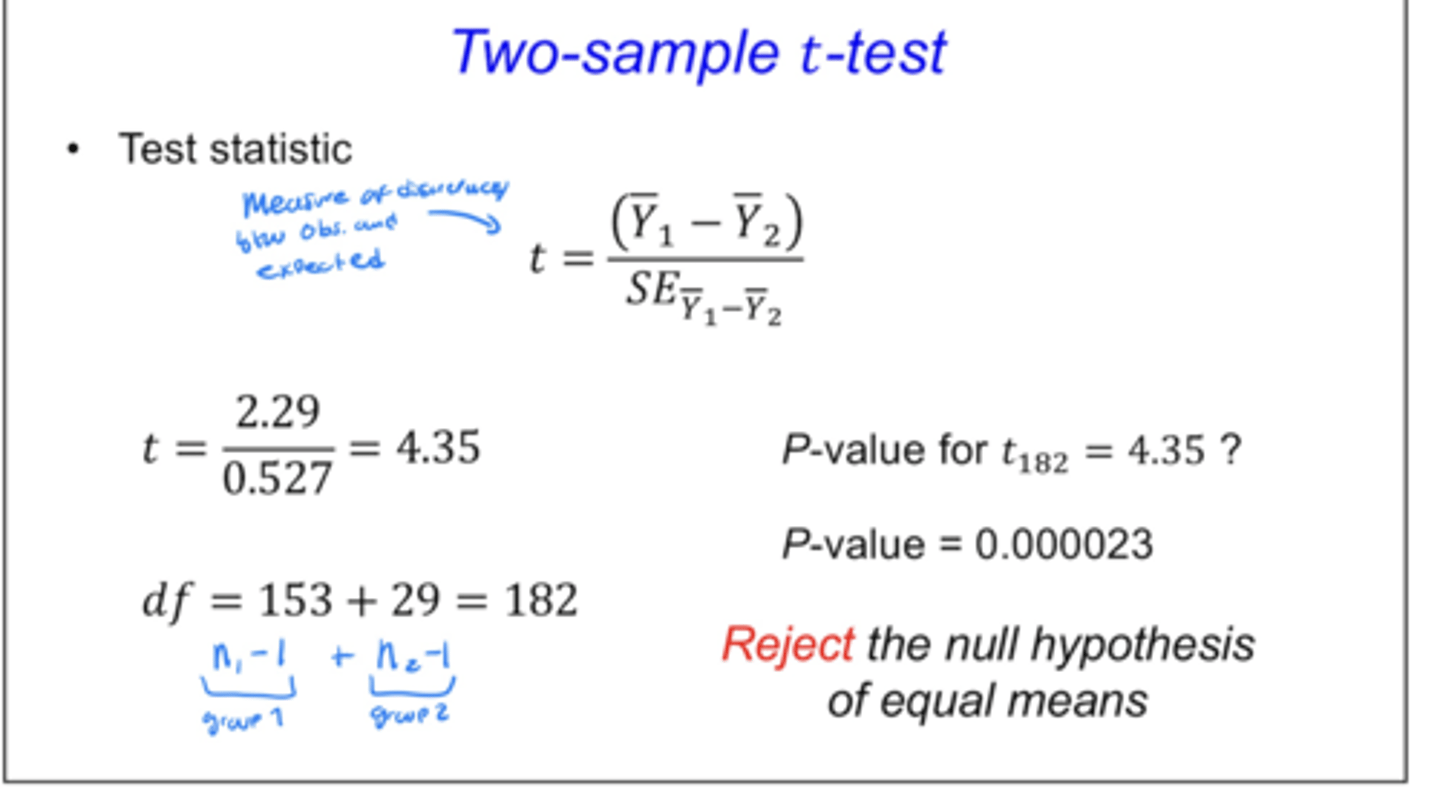
assumptions of a two sample t-test
1. each of the two samples is a random sample from its population
2. numerical variable is normally distributed in each population
- robust to minor deviations from normality
- need to run Shapiro Wilk test on both samples
3. standard deviation and variance of the numerical variable is the same in both populations (equal spread)
- robust to some deviation from this if sample sizes of two groups are approximately equal
- tested with Levine's test
formal tests of equal variance
• an F-test is sometimes used, but is highly sensitive to departures from the assumption that the measurements are normally distributed in the population
• Levine's test performs better and is recommended
hypotheses of Levine's test
H₀: variances of the two groups are equal
Ha: variances of the two groups are not equal
• NOTE: can be extended to more than two groups
what if variances in two groups are not equal?
• standard t=test works well if both sample sizes are greater than 30 and there is less than 3-fold difference in standard deviations (we and ignore Levene's test)
• Use a Welch's t-test
Welch's t-test
Compares the means of two groups and can be used even when the variances of the two groups are not equal
• slightly less power compared to standard t-test
correct sampling units
When comparing the means of two groups and] assumption is that the samples being analyzed are random samples (individuals have an equal probability and independent chance of being sampled)
• often repeated measurements are taken on each sampling unit
- this makes the identification of independent units more challenging
correct sampling units - salmon in the stream example
• individual salmon are not a random sample
• grouped by stream
• stream is the independently sampled unit
• salmon within streams should be summarized by single measurement
- proportion surviving
•NOTE: if you treated the salmon as the sampling unit:
- these samples are not independent because they are caught in the same stream
- you are inflating n to get a significant P
fallacy of indirect comparison
Comparisons between two groups should always be made directly, not indirectly by comparing both to the same hypothesized value
• common error: compare each group mean to hypothesized Value rather than comparing group means to each other
• ex: since group 1 is significantly different then zero, but group 2 is not, then groups 1 and 2 are significantly different from each other
- PROB: you never actually compared the two groups to each other
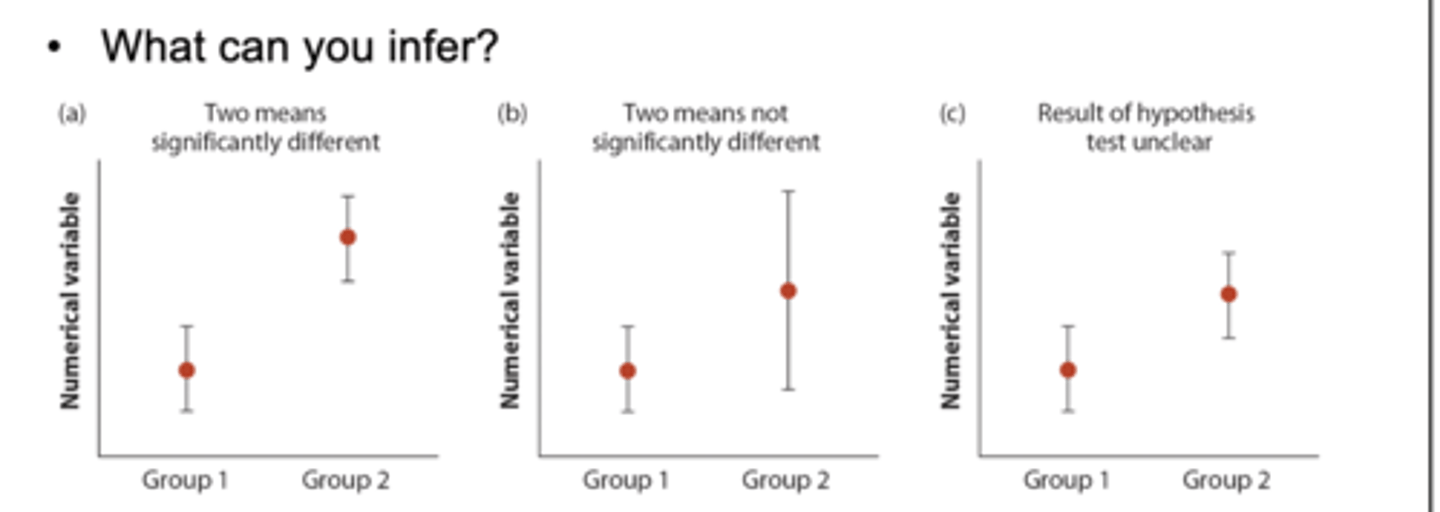
interpreting overlap in confidence intervals
1. two means significantly different: 95% CI don't overlap
2. two means not significantly different: 95% CI overlap and at least one error bar overlaps with a mean
3. results of hypothesis test unclear: error bars overlap but doesn't include me of a group