Stats level 3 (Midterm 1)
1/200
There's no tags or description
Looks like no tags are added yet.
Name | Mastery | Learn | Test | Matching | Spaced | Call with Kai |
|---|
No analytics yet
Send a link to your students to track their progress
201 Terms
Statistical analysis doesn’t eliminate uncertainty, but it allows us to
quantify it so we can decide how much we’re willing to live with
Descriptive Statistics
describe the
properties of a
sample
Inferential statistics
uses properties
of the sample to make conclusions
about the population
Examples of descriptive statistics
Sample statistic mean and we calculate M from our sample data
A representative sample is a useful for
inferring population parameters
Random sampling is the best technique to obtain
Representative samples
We are using data from a sample to estimate the truth about a
much larger population
The Estimation Approach
Samples are not a perfect guide to the population; therefore, we
express our uncertainty by reporting a
point estimate and a
confidence interval
The point estimate is our
best single guess about the population, it is
exactly what we found in the sample
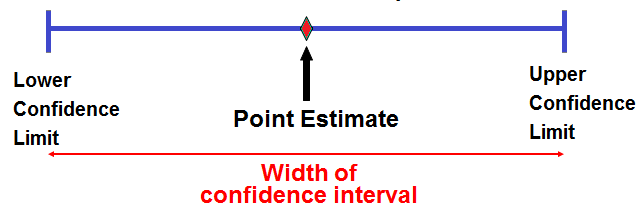
The Margin of Error (MoE) is the
likely largest error in the point
estimate

The Confidence Interval (CI) is the
point estimate +/- the MoE
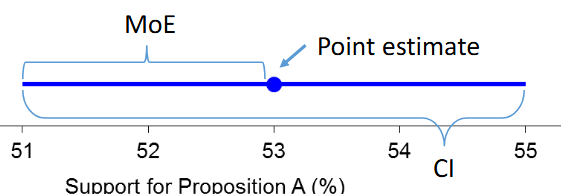
The Confidence Interval (CI) quantifies our
uncertainty about the population. It gives the range of population values which are plausible or likely given the sample data
When we have a Short CI
-> Precise estimate -> Little uncertainty
When we have a Long CI
-> Not a precise estimate -> Lots of uncertainty
What counts as a short and long CI is a
Matter of judgement
How do we get more certainty in our CI
Collect more data! 4x the sample size typically cuts the CI by ½
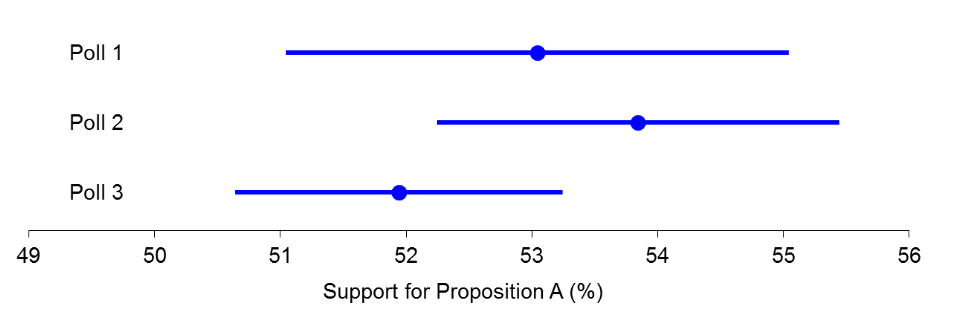
If you replicated a poll with a new sample, would you reach
exactly the same result?
Probably not! There is sampling variability—differences due to using
different samples to draw conclusions about the population.
• It will probably be close, though! The most likely result of the
replication is an answer within the CI of the original study!
Sampling variability:
Each sample gives somewhat
different results
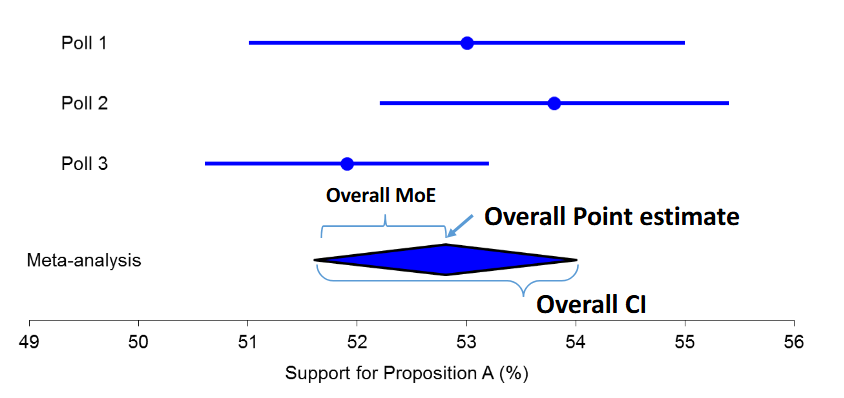
The Estimation Approach: A simple
example
• If we conduct replications, we can conduct a
meta-analysis to synthesize or integrate the results
What does a meta-analysis ensure?
we are examining the whole story, and it gives us an overall estimate more precise than any one study
How are the results of a meta analysis summarized?
in a forest plot and the diamond indicates the overall point estimate and CI.
What are the basic principles of a research design
1: Random sampling
2:Experimental vs non-experimental studies
3: Measurement
Random sampling is the
• Fundamental Assumption in statistical inference
Measurement include
• Operational definitions
• Reliability/Validity
• Levels of Measurement
• Every member of the population has an equal probability of
being chosen.
• All members of the sample are chosen independently.
Random Sampling
• Statistical inference, including the use of Confidence
Intervals, assumes
the data are from a random sample.
In practice, random samples can be difficult to obtain:
• Most psychology research is conducted with young university-
educated adults between 17 and 30 years of age
• Experiments include
• One or more variables are manipulated or assigned by the researcher
• Independent Variable (IV): the variable that is manipulated
• Dependent Variable (DV): the outcome that is observed
• Can justify causal conclusions; confounds controlled (random assignment)
• Describe with causal language: affects/effects, produces, causes, makes
In experiments, the independent variable is the variable that is
being manipulated
In experiments, the dependent variable is the variable that is
the outcome being observed
In experiments, they can justify
causal conclusions; confounds controlled (random assignment)
• Non-Experiments:
• No manipulation or assignment
• Can not justify causal conclusions; cannot rule out confounds
• Describe with association language: relates to, associated with, correlated with
Non-experiments do not have
manipulation or assignments
Non-experiments cannot
justify causal conclusions; cannot rule out confounds
What is the language used in non-experiments
association language: relates to, associated with, correlated with
What is the language used in experiments
causal language: affects/effects, produces, causes, makes
What is a construct
• The abstract concept we are interested in
What is an operational definition
• A precise procedure for measuring values that represent a construct
What is a measured variable
• The actual variable measured
The measured variable should be
Reliable and Valid
Reliable is
Repeatable;
similar results on repeated
measurement
Valid is
Accurate, true,
measuring what it is meant to
measure
In NOIR, the N is
Nominal
In NOIR, the O is
Ordinal
In NOIR, the I is
Interval
In NOIR, The R is
Ratio
Nominal is the
Numbers represent characteristics according to a simple
code
a level of measurement in statistics that categorizes data into distinct, non-ordered groupsa level of measurement in statistics that categorizes data into distinct, non-ordered groups
Ordinal is the
Numbers are assigned based on rank amount of
characteristic:
Interval is the
• Numbers are assigned based on relative quantity of
characteristic, with no true 0 point
• Examples: year, longitude, latitude, temperature
Ratio is the
• Numbers are assigned based on the absolute
magnitude of a characteristic. The scale has a
true zero point.
What are the two ways a variable can be classified?
Continuous & Discrete
A continuous Variable is a
variable that can take any of
the unlimited number of values in some range.
What are examples of continuous variables
Height & time spent on a task
A discrete variable is a
variable that can take only distinct or separated values.
What are examples of discrete variables
Number of eggs in a basket, Children in a family,
Toys in a box
Continuous variables can take values
along a smooth curve
discrete variables cannot
take values along a smooth curve
The probability distribution of a continuous variable is a
smooth curve—like this normal distribution you may
remember seeing
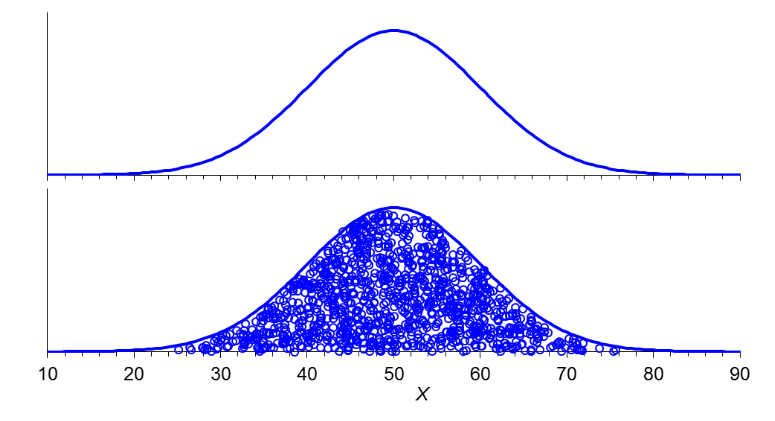
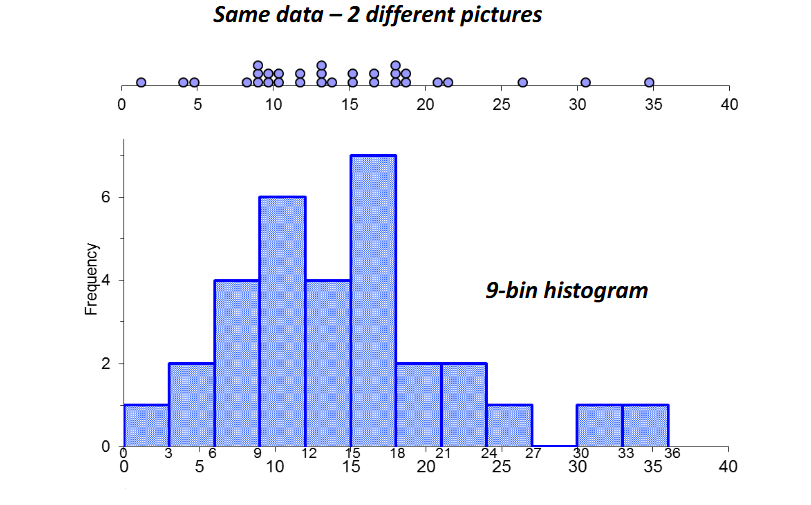
• Histograms depict
the data sorted into bins – each bin contains
X observations of values contained within that bin
What is included in the measure of central tendency?
Mean, Median, and Mode
What is included in a spread?
Standard deviation, Variance, Range, Inter-quartile range
What is the symbol for summation
Σ
What is the mean formula
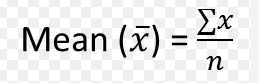
The mean is also known as the
average
M is for the
Sample
μ is for the
population
The mean represents the
balancing point for the distribution
Is the mean influenced by outliers?
Yes, especially in small data sets
The median is the
middle point in the distribution, the score at which half the others are above and the other half below (50th
percentile)
Only requires interval scaling; can be used for any type of data
except nominal
Median
The median is not
as sensitive to outliers as the mean
The mode is
whatever response is most frequent.
Requires only nominal scaling; can be used for any type of
data and is Not very sensitive to outliers
The mode
• Characteristics of the normal distribution:
• Smooth, symmetrical bell shape with most data points near center
• Normal curve defined by two parameters: mean and SD
Normal distributions are not always the same
• Some are much narrower, some wider
• Mean and SD can vary between distributions
The range is
-The distance from the minimum score to the maximum score
• Easy to understand, but can change dramatically with outliers
or even just with some new data.
The better way then the range is the
SD
What is the formula for the sample SD
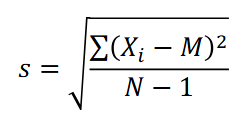
For the SD
—Each data point, there is a possible deviation from the mean (X-M)
• Think of the standard deviation as the average or typical deviation from the mean
s is the symbol for the
Sample SD
σ is the symbol for the
Population SD
The SD is sensitive to
outliers
The Standard Deviation is the square root of
the variance,
another measure of spread
What is the formula for the variance
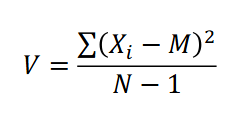
• Variance is useful, but
expressed spread in squared units,
which are a bit difficult to understand.
• Interquartile Range (IQR) only requires
Ordinal scaling and is not very sensitive to outliers
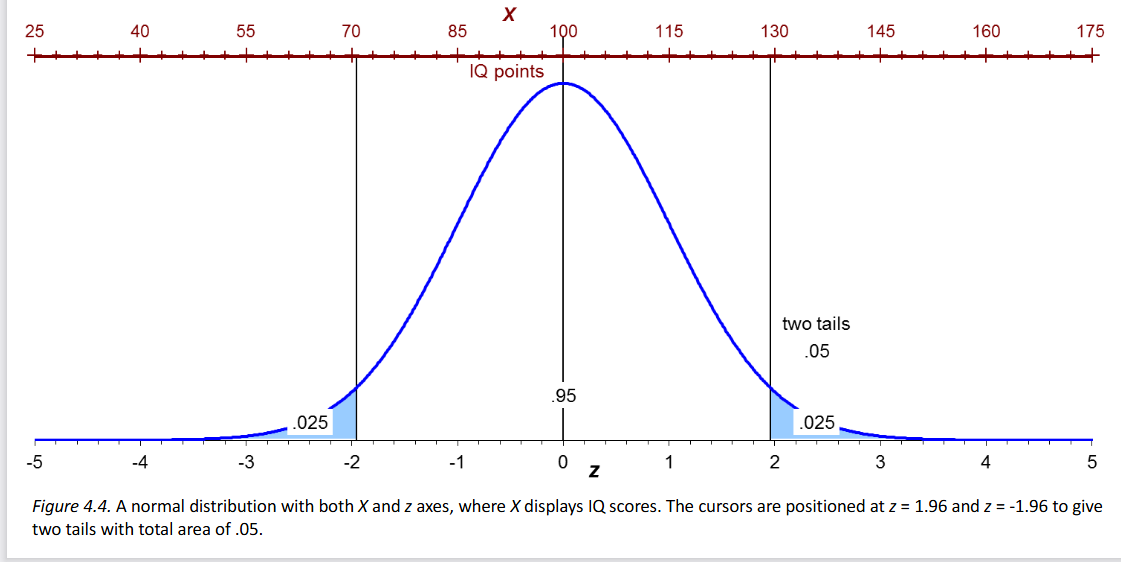
The z score at the mean is 0, as labeled.
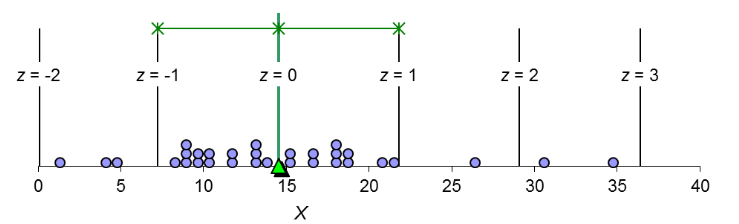
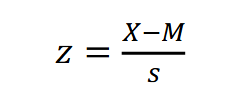
• A z score expresses an individual’s score in
standard
deviation units.
What is the z-score formula
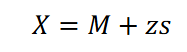
What is the formula for turning a z-score back into a raw score
z scores provide standardization
once expressed in z scores, no
need to worry about range of measurement (1 to 10 scale, 1-7 scale,
etc.) or units (inches, feet, etc.)
• z scores allow comparisons across
different measures with different
scales
Percentile% is the
% of data below a score, X
• Only requires ordinal scaling
If we transform each observation from a population into a z-
score and then examine how these z-scores are distributed, we
get the standard normal distribution always has a mean
of
0 and standard deviation of 1
Mean uses
Interval or Ratio scaling
Median uses
Ordinal, Interval, or ratio scaling
The mode uses
NOIR scaling
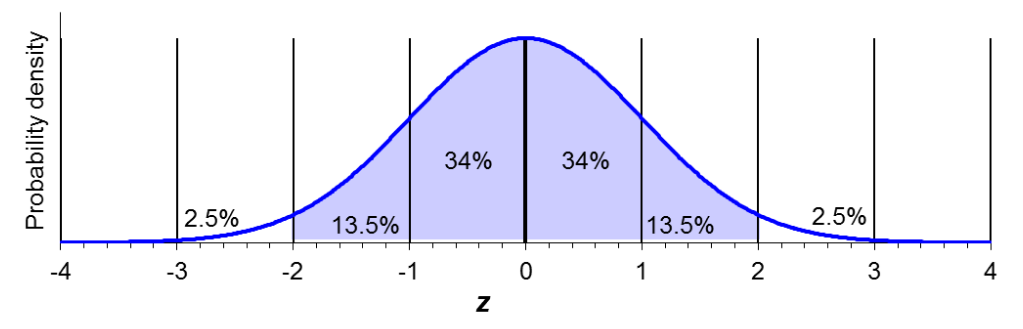
The distribution is labeled with z scores and
corresponding percentages—these represent how much of the
distribution falls between any two z scores
We know M and s for our
Sample
• M and s are expected to change
from
Sample to Sample