Unit 3 Stat - Normal distributions
1/10
There's no tags or description
Looks like no tags are added yet.
Name | Mastery | Learn | Test | Matching | Spaced | Call with Kai |
|---|
No analytics yet
Send a link to your students to track their progress
11 Terms
Ogive
Shows cumulative relative frequency
Can’t be negative slope
Horizontal slope = gap in the data bc no values
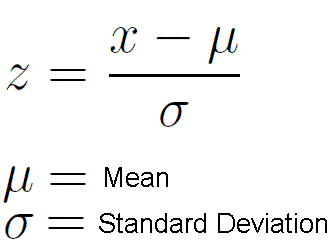
z-score formula
Z-score = how many standard deviations above the mean the value is
Transforming data
Adding & multiplying changes measures of position (min, Q1, med, mean, max, basically single points etc)
Only multiplying changes measures of spread (SD, IQR, range)
Density curves
Area under curve always = 1
The area under the curve btwn 2 points gives the proportion of all observations that fall within that range
< is the same as <= sign
P(x < 1) means what is the % probability that x is less than 1 (use normalcdf)
mean, SD symbols
x̄ = sample mean
μ = population mean
Sx = sample SD
σ = population SD
note: use population mean & SD for normal curves & stuff
Normal distribution curve empirical rule
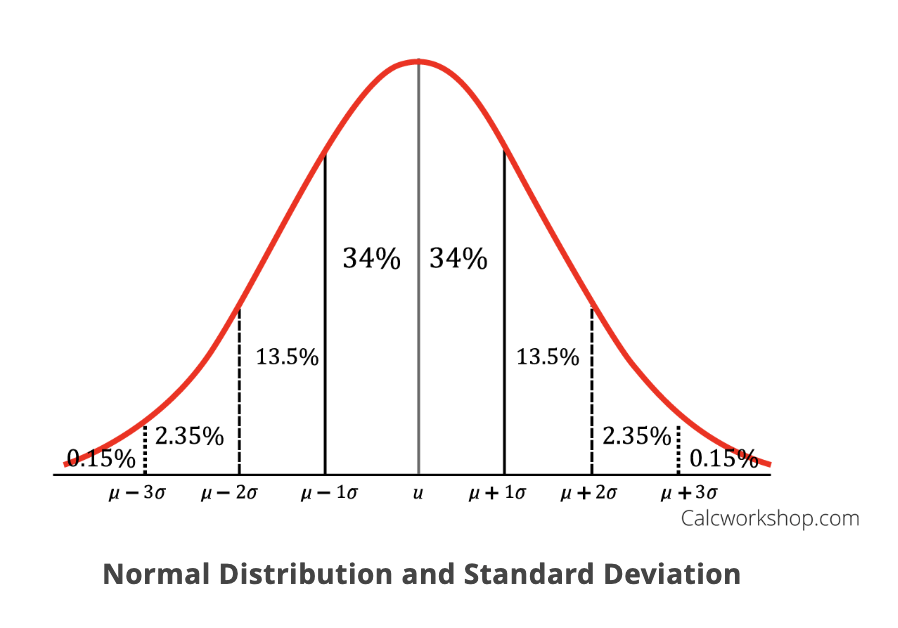
68, 95, 99.7, 100
If the question asks “what is the % at exactly -3 standard deviations?” what is the answer
This is a line segment, not an area. so no percentage
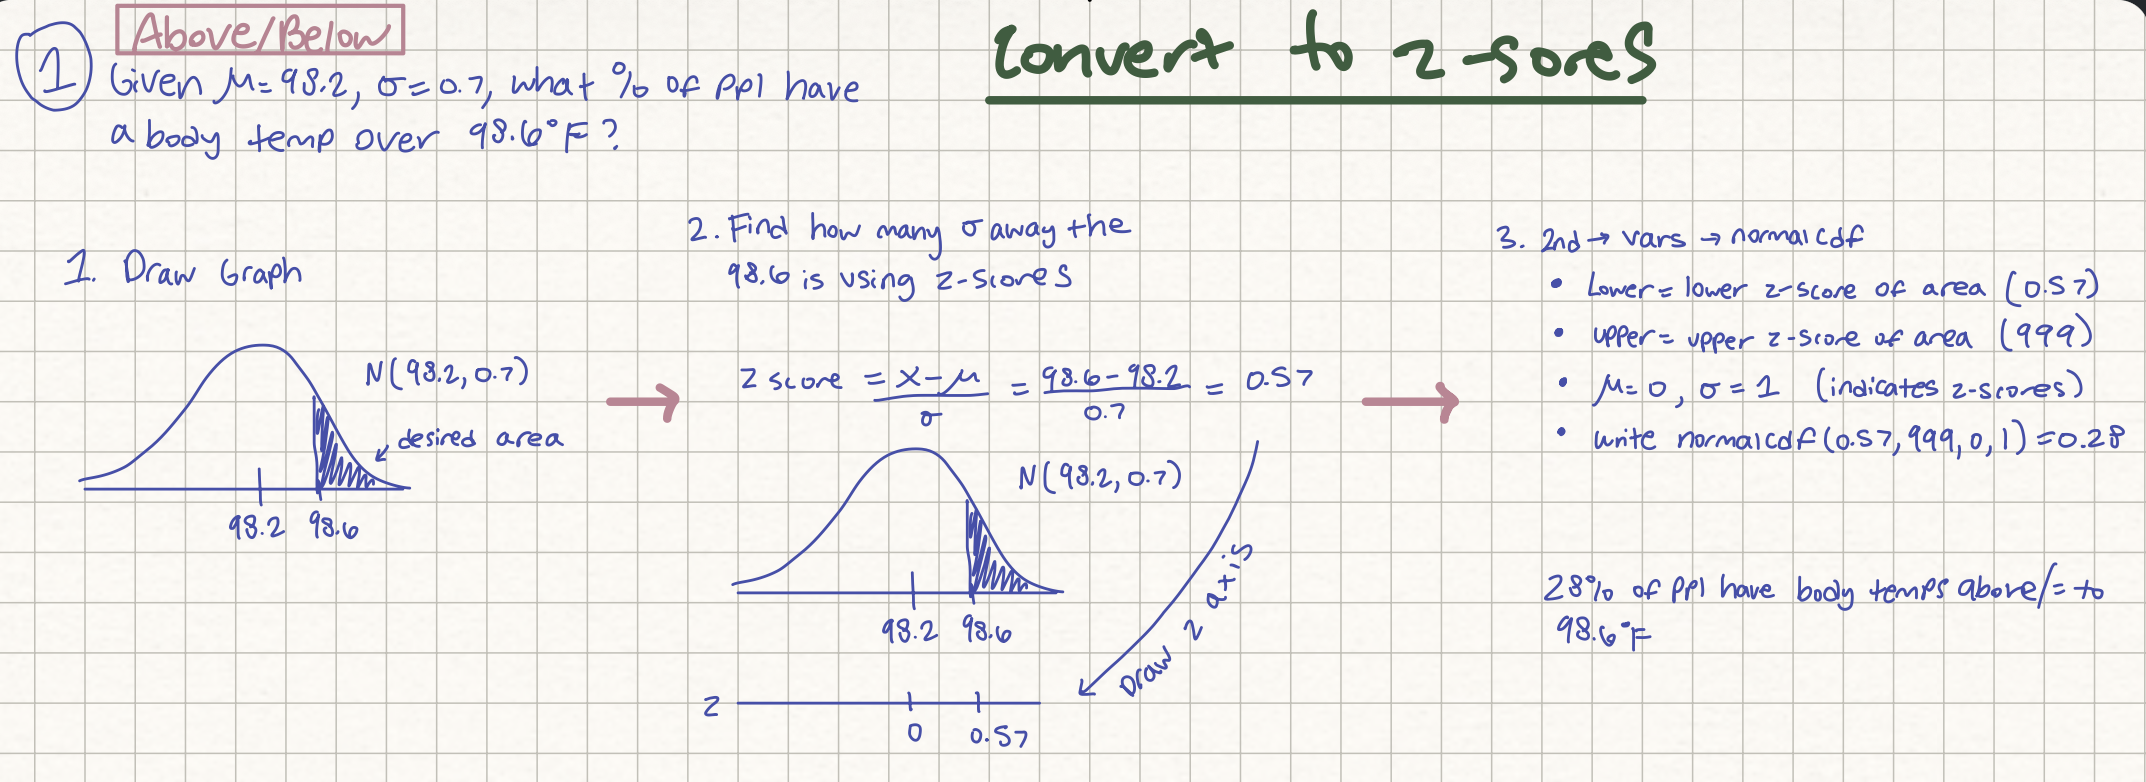
Normal distribution question; find the % above/below a value
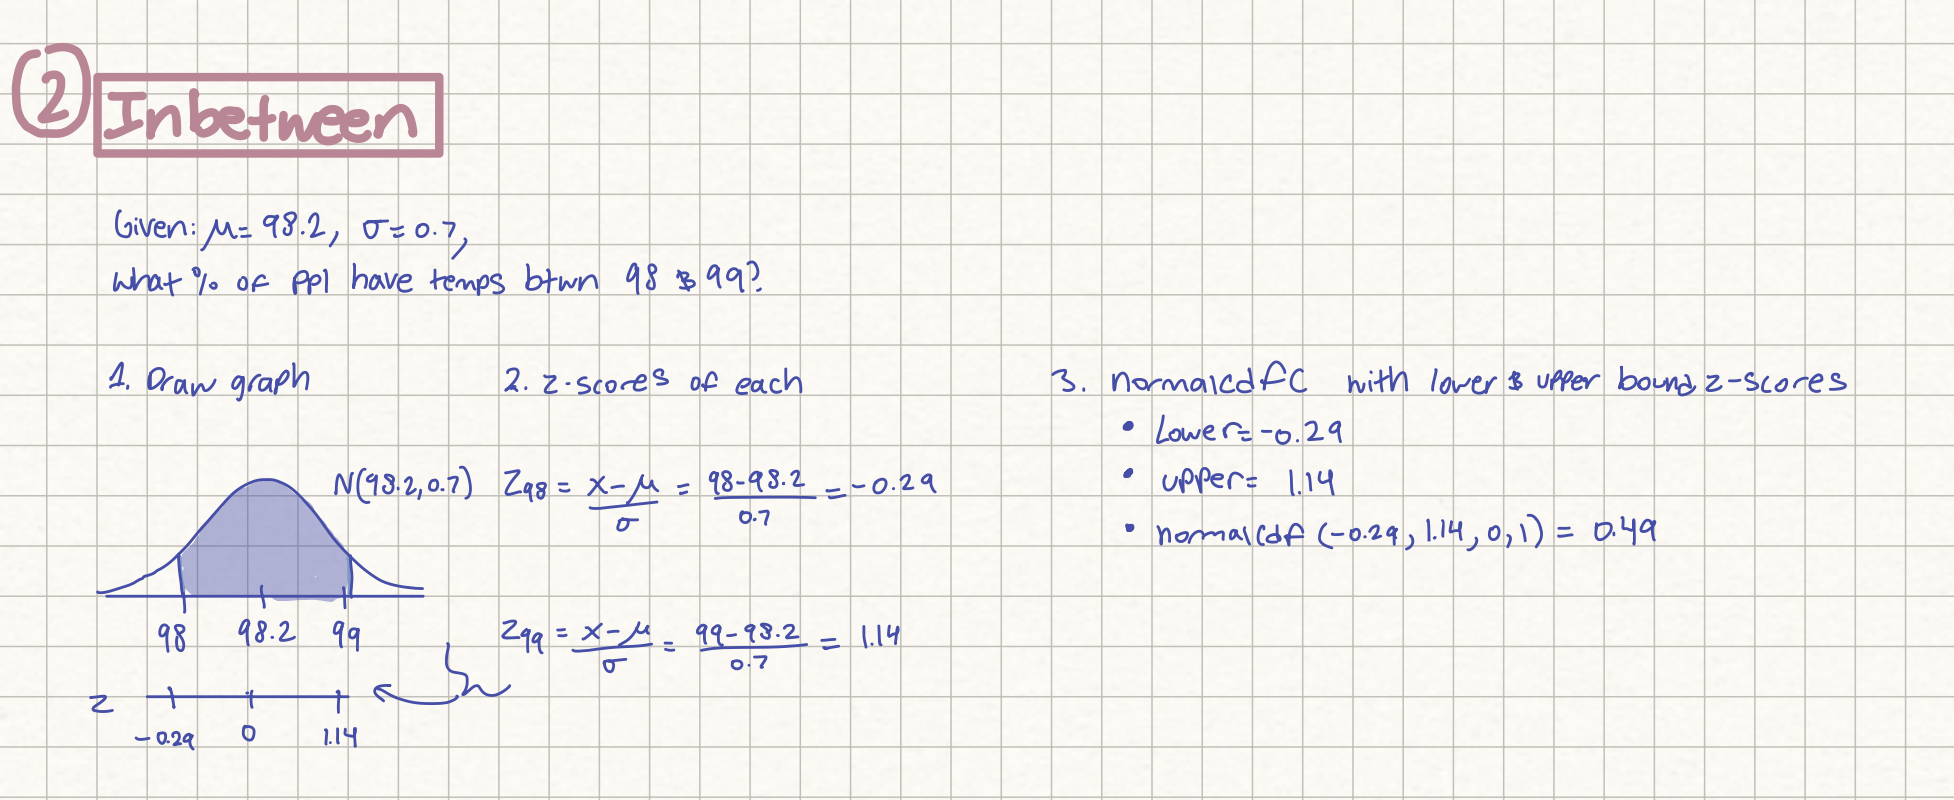
Normal distribution question; find the % btwn values
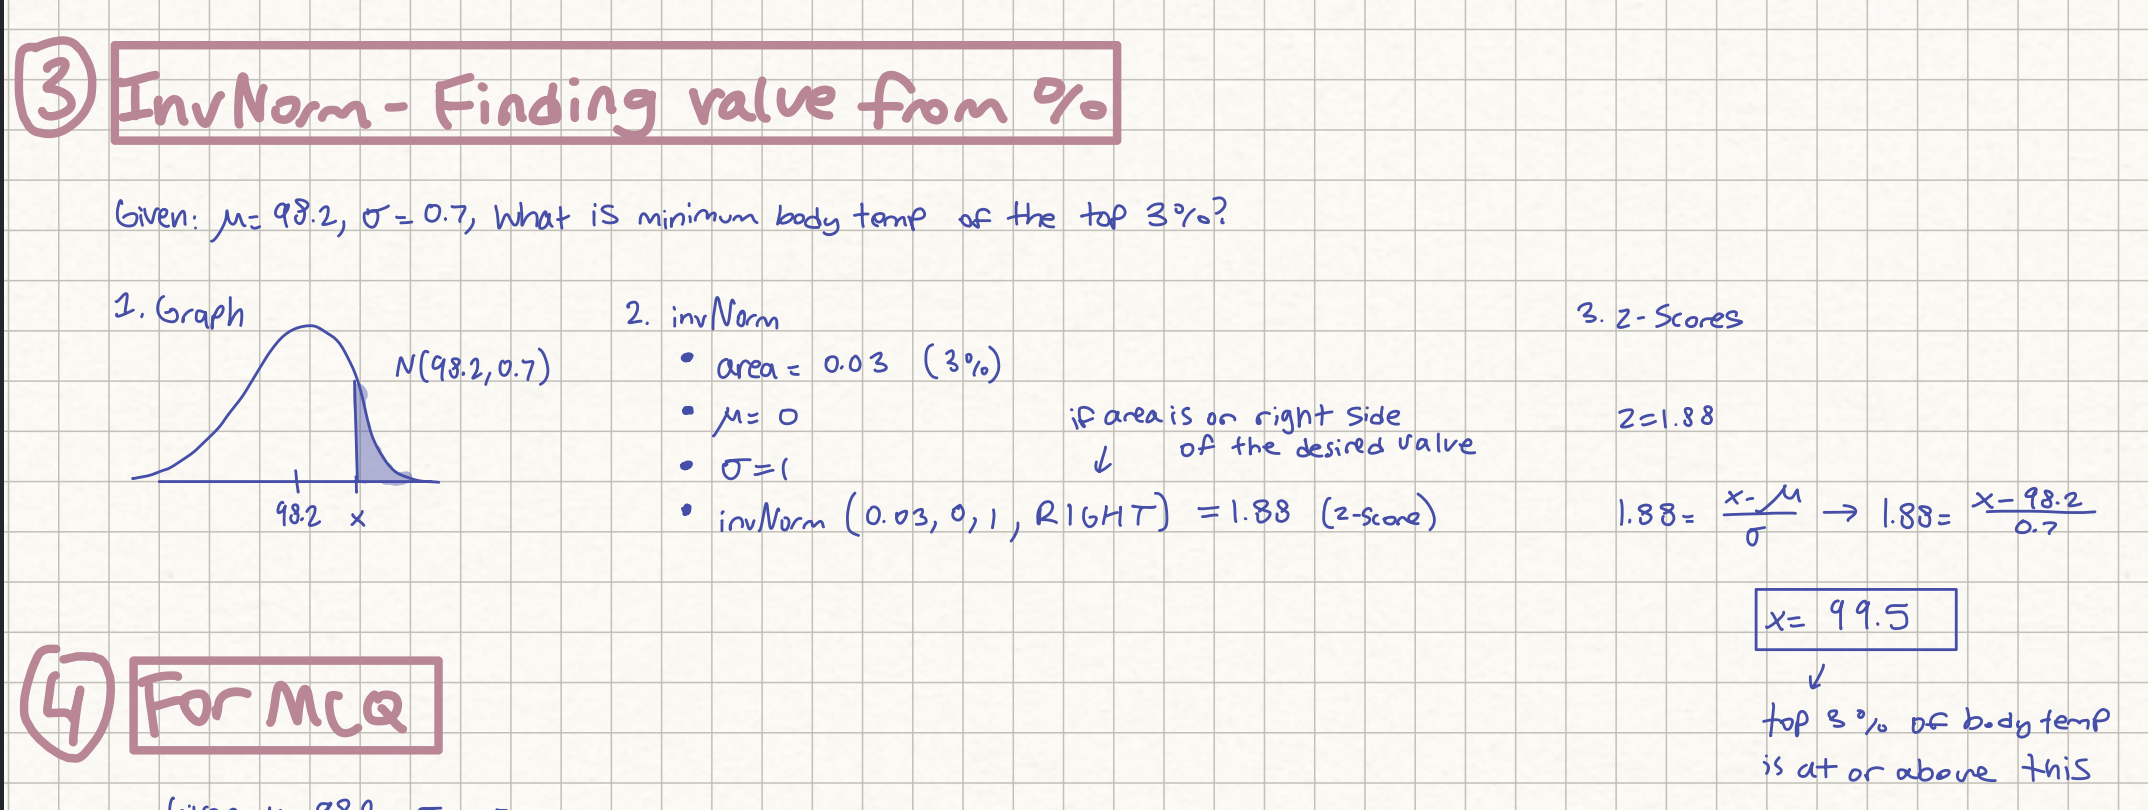
Normal distribution question; finding value from %
How to assess normality
Enter data into calc
2nd → y= → plot 1 → select scatterplot, the one all the way on the right
Draw a sketch, write a sentence
If line is linear + not much space inbetween dots, say “since the normal probability plot” is roughly linear, the data are approximately normally distributed
If there is a cluster of data values on the right, then its skewed left, and vice versa
you CANT assess normality using a boxplot - only shows a summary, not the actual values