AP Psych - Unit 2: Research Methods
1/56
Earn XP
Description and Tags
Covers content from textbook and lesson slides. Modules 4 to 8
Name | Mastery | Learn | Test | Matching | Spaced | Call with Kai |
|---|
No analytics yet
Send a link to your students to track their progress
57 Terms
Hindsight Bias
The tendency to believe, after learning an outcome, that one would have foreseen it (aka the I-knew-it-all-along phenomenon)
Overconfidence
The tendency to think we know more than we do and to exaggerate the correctness or accuracy of our beliefs and predictions
Perceiving Order in Random Events
In our natural eagerness to make sense of an unpredictable world, we are prone to perceive patterns, even when there might not be any
Theory
An explanation using an integrated set of principles that organizes observations and predicts behaviours or events
Part of the scientific method, explains behaviors or events by offer ideas that organize observations
Hypothesis
A testable prediction, often implied by a theory, part of the scientific method
Operational Definition
A carefully worded statement of the exact procedures (operations) used in a research study; precise measurements of concepts, part of the scientific method
Replication
Repeating the essence of a research study, usually with different participants in different situations, to see whether the basic finding can be reproduced; others can repeat the experiment, part of the scientific method
Descriptive Methods
Describe behaviours, often by using case studies, surveys, or naturalistic observations; a way to test hypotheses and refine theories
Correlational Methods
Associate different factors, or variables; a way to test hypotheses and refine theories
Experimental Methods
Manipulate variables to discover their effects; a way to test hypotheses and refine theories
Variable
Anything that can vary and is feasible and ethical to measure; refers to anything that contributes to a result
Case Study
A descriptive technique in which one individual or group is studied in depth in the hope of revealing universal principles
Naturalistic Observation
A descriptive technique of observing and recording behaviour in naturally occurring situations without trying to manipulate or control the situation; recording the natural behaviour of many individuals
Does not explain behavior but rather describes it
Agreement between the observers (called interrater reliability) is crucial
You must blend in
Survey
A descriptive technique for obtaining the self-reported attitudes or behaviours of a particular group, usually by questioning a representative, random sample of the group; asking people questions
Representative Sample
A subset of a population that seeks to accurately reflect the characteristics of the larger group; has the same distribution of demographic qualities in it as the population as a whole.
Hawthorne Effect
When subjects of an experimental study attempt to change or improve their behavior simply because it is being evaluated or studied; Sometimes just knowing you are being observed can alter behaviour
Wording Effect
The effect that subtle changes in the words or order of words can have on a study participant; Subtle changes in the wording of questions can have major effects
Random Sample
A sample that fairly represents a population because each member has an equal chance of inclusion
Every person in the entire group has an equal chance of participating, typically generates a representative sample
Sampling Bias
A flawed sampling process that produces an unrepresentative sample
Population
All those in a group being studied, from which samples may be drawn
*(except for national studies, this does not refer to a country’s whole population)
Correlation
Correlation does not equal causation
A measure of the extent to which two factors vary together, and thus of how well either factor predicts the other
the degree to which two variables are related/change together, and how well one predicts the other
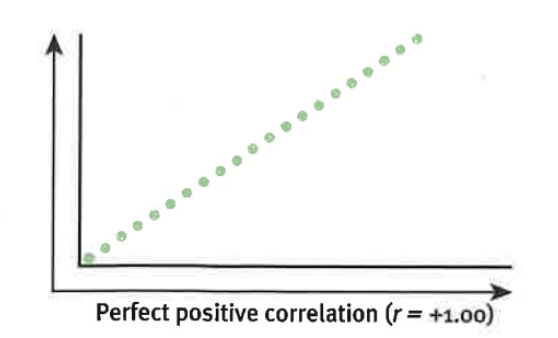
Positive Correlation
When two factors increase or decrease together (move in tandem)
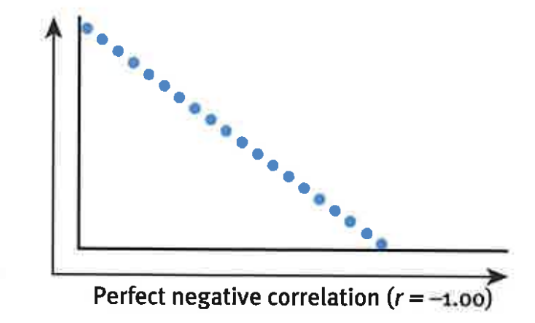
Negative Correlation
When one variable increases as the other decreases
Association
A co-occurrence of two events, factors, characteristics, or activities such that when one happens, the other is likely to occur as well
many statistics measure this
correlations do not show causation
cause, effect and correlation
Correlation Coefficient
A statistical index of the relationship between two things/variables (from -1.00 to +1.00); describes the strength and direction of a relationship between two variables
Scatterplot
A graphed cluster of dots, each of which represents the values of two variables. The slope of the points suggests the direction of the relationship between the two variables. The amount of scatter suggests the strength of the correlation (little scatter indicates high correlation)
Illusory Correlation
Perceiving a relationship where none exists, or perceiving a stronger-than-actual relationship; are random events that we notice and falsely assume are related
Regression Toward the Mean
The tendency for extreme or unusual scores or events to fall back (regress) toward the average; extraordinary happenings tend to be followed by more ordinary ones
Experiment
A research method in which an investigator manipulates one or more factors (independent variables) to observe the effect on some behavior or mental process (the dependent variable). By random assignment of participants, the experimenter aims to control other relevant variables; manipulating one or more variables of interest and controlling other variables
Experimental Group
In an experiment, the group exposed to the treatment, that is, to one version of the independent variable
Control Group
In an experiment, the group not exposed to the treatment; contrasts with the experimental group and serves as a comparison for evaluating the effect of the treatment
Random Assignment
Assigning participants to experimental and control groups by chance, thus minimizing preexisting differences between the different groups
Double-Blind Procedure
An experimental procedure in which both the research participants and the research staff are ignorant (blind) about whether the research participants have received the treatment or a placebo. Commonly used in drug-evaluation studies; used to avoid the placebo effect and researcher or subject bias
Placebo Effect
Experimental results caused by expectations alone; any effect on behavior caused by the administration of an inert substance or condition, which the recipient assumes is an active agent
Independent Variable
In an experiment, the factor that is manipulated; the variable whose effect is being studied; is the factor manipulated to study its effect
Dependent Variable
In an experiment, the outcome that is measured; the variable that may change when the independent variable is manipulated
Is measured to discover any changes occurring in response to the manipulation of the independent variable.
Confounding Variable
A factor other than the factor being studied (independent variable) that might influence or produce an effect in an experiment and results
Validity
The extent to which a test or experiment measures or predicts what it is supposed to; an experiment has this if it measures what it is supposed to measure.
Informed Consent
The ethical principal of giving potential participants enough information about a study to enable them to choose whether they wish to participate
Debriefing
The postexperimental explanation of a study, including its purpose and any deceptions, to its participants; when temporary deception is necessary to the research, it must be fully explained at the conclusion of the experiment.
Descriptive Statistics
Numerical data used to measure and describe characteristics of groups. Includes measures of central tendency and measures of variation
Histogram
A bar graph depicting a frequency distribution
Mode
The most frequently occurring score(s) in a distribution
Mean
The arithmetic average of a distribution, obtained by adding the scores and then dividing by the number of scores; The mathematical average of a set of numbers
Median
The middle score in a distribution; half the scores are above it and half are below it
Skewed Distribution
A representation of scores that lack symmetry around their average value; most of the scores or data fall on one side of the scale and there are very few scores on the other side
When one data point is extremely different from the others, this is called an outlier and can skew the results.
Range
The difference between the highest and lowest scores in a distribution
Standard Deviation
A computed measure of how much scores vary around the mean score
Normal Curve (aka Normal Distribution)
A symmetrical, bell-shaped curve that describes the distribution of many types of data; most scores fall near the mean (about 68 percent fall within one standard deviation of it) and fewer and fewer near the extremes
Inferential Statistics
Numerical data that allow one to generalize--to infer from sample data the probability of something being true of a population
Statistical Significance
A statistical statement of how likely it is that an obtained result occurred by chance
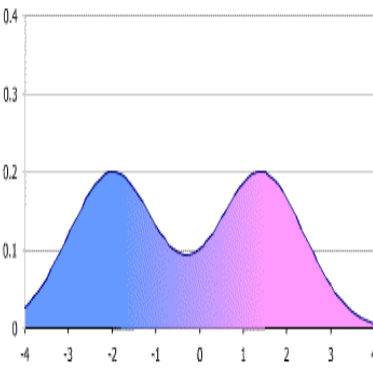
Bimodal Distribution
Two different modes, distinct peaks in probability density
Null Hypothesis
Averages based on more cases, of course, will be more reliable. Psychologists typically do not interpret a difference as meaningful unless the odds of it occurring by chance are less than 5%
Group Matching
Refers to a technique used in experimental research where the participants are paired based on specific characteristics (variables) they “match on”, and then divided into groups (conditions).
The purpose of this technique is to reduce the chances of individual differences skewing the obtained results; attempts to use data that has been collected previously
Counterbalancing
When the participant sample is divided in half, with one half completing the two conditions in one order and the other half completing the conditions in the reverse order
Positively Skewed Distribution
A distribution where the data's mean, median, and mode are greater than zero. It indicates that the data is concentrated more toward one side of the scale, with a long tail on the right side
Negatively Skewed Distribution
A longer or fatter tail on the left side of the distribution