ecology test 3 (copy)
0.0(0)
Card Sorting
1/157
Earn XP
Description and Tags
Study Analytics
Name | Mastery | Learn | Test | Matching | Spaced |
|---|
No study sessions yet.
158 Terms
1
New cards
life table
age or stage specific account for mortality
2
New cards
cohort
group of individuals born in the same period of time
3
New cards
nx
abundance at age X
4
New cards
dx
individuals dying between stages
nx-(nx+1)
nx-(nx+1)
5
New cards
lx
survivorship (probability)
Nx/N0
Nx/N0
6
New cards
qx
mortality rate
dx/nx
dx/nx
7
New cards
type 1 survivorship curve
low death rates during early and middle life and an increase in death rates among older age groups
-humans many mammals
-humans many mammals
8
New cards
type 2 survivorship curve
fairly constant death rate at all ages
-birds, rodents, reptiles, perennial plants
-birds, rodents, reptiles, perennial plants
9
New cards
type 3 survivorship curve
a pattern of survival over time in which there is low survivorship early in life with few individuals reaching adulthood
-fish, inverts, many plants
-fish, inverts, many plants
10
New cards
fecundity
rate of production of young by females
11
New cards
bx
average number of female offspring produced by an individual at age x
12
New cards
lxbx
mean number of females born in each age group, adjusted for survivorship
13
New cards
R0
Lxbx added across all age groups,
R0>1= population is growing
R0
R0>1= population is growing
R0
14
New cards
exponential population growth
Nt+1=Nt+(births-deaths)
dN/dT-rNt
r= instantaneous per capita rate of growth
dN/dT-rNt
r= instantaneous per capita rate of growth
15
New cards
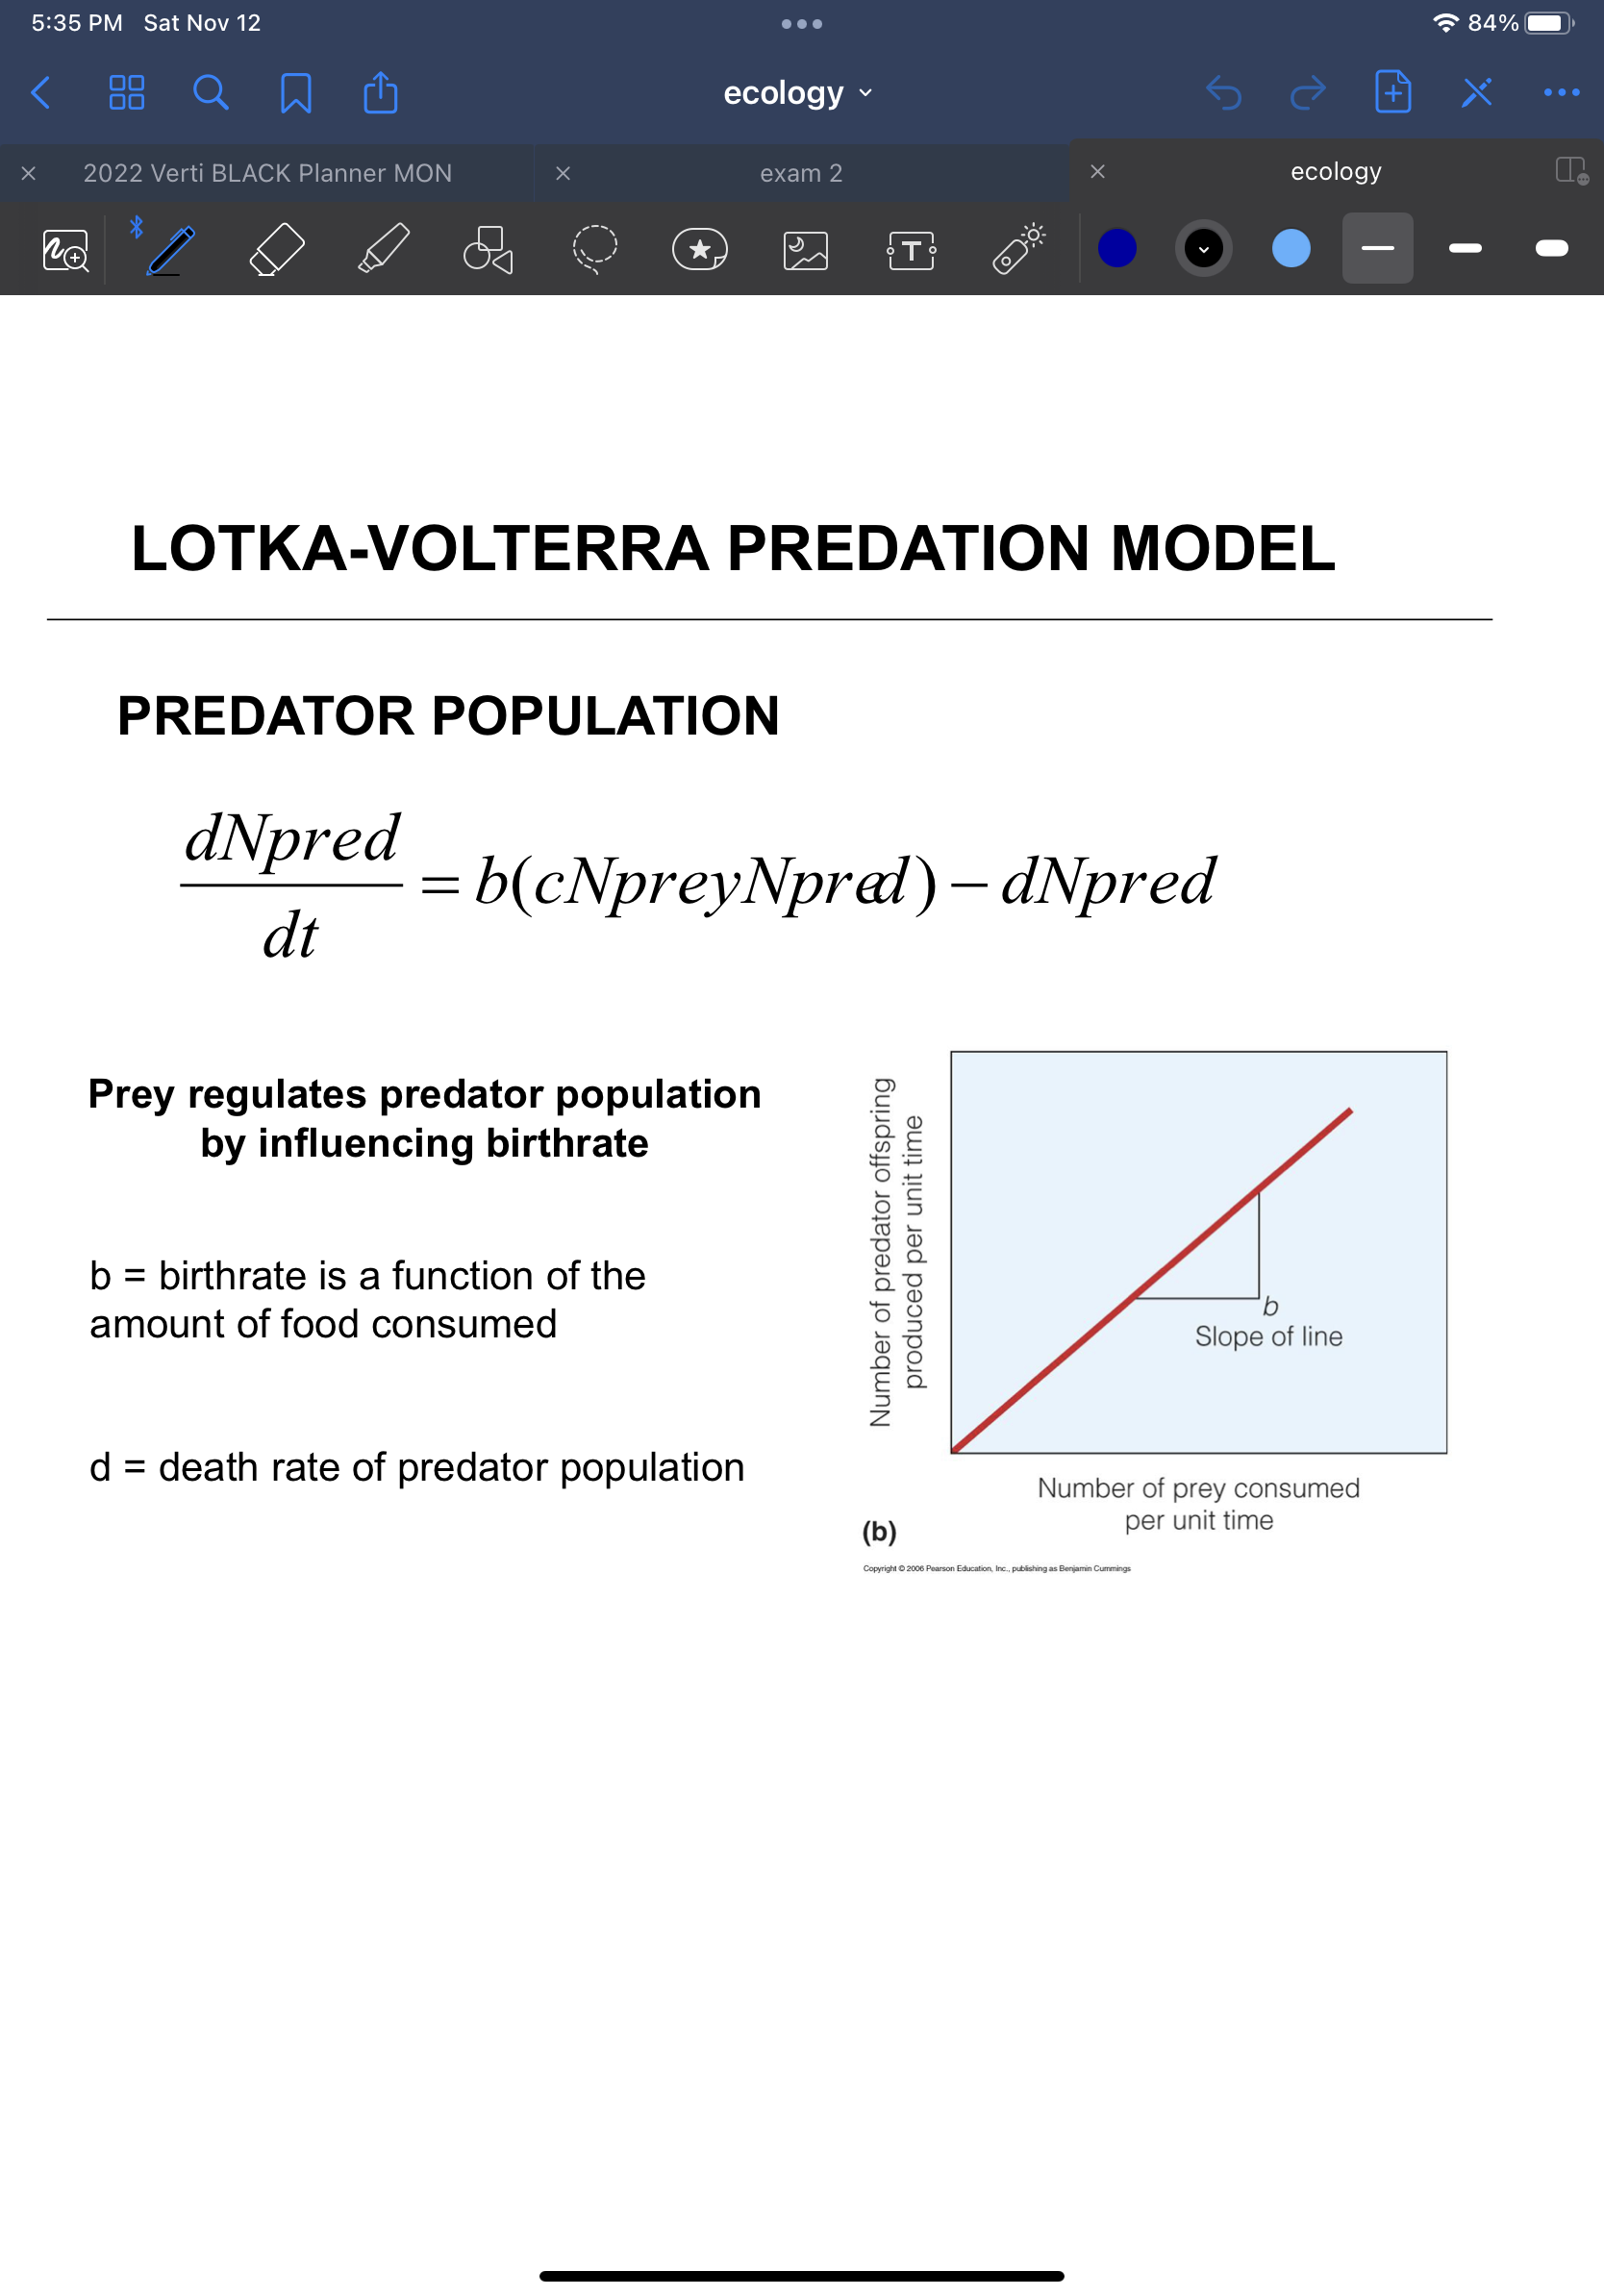
influence on birth rates
-natality: number of young per breeding attempt
-age at sexual maturity
-reproductive span:# of breeding years
-interbirth interval
-age of female
-nutritional state of females
-age at sexual maturity
-reproductive span:# of breeding years
-interbirth interval
-age of female
-nutritional state of females
16
New cards
maximum rate of growth
is determined by a species life history
(Births-deaths)
(Births-deaths)
17
New cards
sx
the survival rate from one age class to the next age class
sx=1-qx
-can be used to project population growth
sx=1-qx
-can be used to project population growth
18
New cards
age distribution
The proportion of individuals of different ages within a population
19
New cards
Projecting population growth
N(t+1)=N(t)λt
λ>1: increasing population
λ
λ>1: increasing population
λ
20
New cards
logistic growth
dN/dt=rN(1-N/K)
-rate of population growth maximized halfway to carrying capacity
-rate of population growth maximized halfway to carrying capacity
21
New cards
density dependent factors affecting population dynamics
-environmental factor whose effects on a population change as the population density changes
-growth declines as N increases (usually)
-density dependent mortality
-density dependent fecundity
-growth declines as N increases (usually)
-density dependent mortality
-density dependent fecundity
22
New cards
density independent factors affecting population dynamics
-environmental factor that affects the size of a population but is not influenced by changes in density
-ex. weather events, pollutants
-ex. weather events, pollutants
23
New cards
competition
-interaction among individuals where both attempt to use a common essential resource; mutually detrimental to both participants
-intraspecific (individuals of same species)
-interspecific (individuals of different species)
-intraspecific (individuals of same species)
-interspecific (individuals of different species)
24
New cards
individuals compete for
food, space (enemy free space), light, water
25
New cards
scramble competition
growth and reproduction are depressed equally across individuals in a population as the resource declines
-herbivores and available forage (exploitation)
-herbivores and available forage (exploitation)
26
New cards
contest competition
some individuals control sufficient resources while others in the population suffer
-carnivores and prey base (interference)
-carnivores and prey base (interference)
27
New cards
effects of intraspecific competition
-increased stress
-slowed growth and development
-reduced reproduction
-slowed growth and development
-reduced reproduction
28
New cards
Territoriality
Defense of a space against encroachment by other individuals
29
New cards
demographic stochasticity
random variation in birth and death rates from year to year
30
New cards
environmental stochasticity
variation in environmental conditions can greatly affect birth and death rates
31
New cards
deterministic population model
-birth and death rates assumed constant
-use averages to incorporate range of possible outcomes
-use averages to incorporate range of possible outcomes
32
New cards
stochastic models
-incorporate probability
-use simulations to get a range of potential outcomes
-use simulations to get a range of potential outcomes
33
New cards
landscape ecologists
-study the structure, function, and/or changes of a landscape
-they study how the characteristics of a landscape influence: dispersal, disease, propagation, energy flow, etc.
-they focus on spatial heterogeneity and detecting patterns at large scales
-they study how the characteristics of a landscape influence: dispersal, disease, propagation, energy flow, etc.
-they focus on spatial heterogeneity and detecting patterns at large scales
34
New cards
populations are spatially structured
-not found in an uniform way
-elevation determined big horned sheep populations
-demonstrates metapopulations
-elevation determined big horned sheep populations
-demonstrates metapopulations
35
New cards
metapopulation
a network of subpopulations linked by individual movements
-populations are equivalent and extinction of local populations is stochastic (random) event
-populations are equivalent and extinction of local populations is stochastic (random) event
36
New cards
subpopulations
local populations determined by distribution of patches of suitable habitat
37
New cards
Abiotic landscapes
a non-living part of an ecosystem that shapes its environment
38
New cards
Biotic landscape
a living organism that shapes its environment
39
New cards
anthropogenic
Human-induced changes on the natural environment
40
New cards
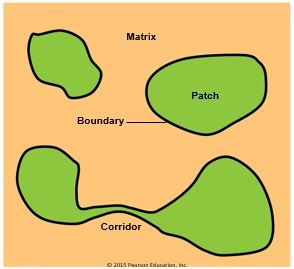
patch
area that is more homogenous than surroundings
41
New cards
matrix
dominant community in an area
42
New cards
boundary
location where patches meet
43
New cards
characterization of boundaries
-narrow border (abrupt boundary)
-wide border (ecotone)
-convoluted border (wavy)
-perforated border
-wide border (ecotone)
-convoluted border (wavy)
-perforated border
44
New cards
ecotone
The transition from one type of habitat or ecosystem to another, such as the transition from a forest to a grassland
-often contain high biological diversity
-contain patch species, matrix species, edge species
-often contain high biological diversity
-contain patch species, matrix species, edge species
45
New cards
fragmentation
degree of patch (dis)continuity
46
New cards
size of patch
increased size of patch= increased area= increased species able to be supported
47
New cards
shape of patch
more regular shape, less "edge"
-species that are edge species, interior species, and area-insensitive species
-species that are edge species, interior species, and area-insensitive species
48
New cards
corridors
relatively linear areas of habitat that connect patches
-increase connectivity in patches
-increases colonization rates
-increase connectivity in patches
-increases colonization rates
49
New cards
connectivity
the degree to which patches interact with one another
50
New cards
connecivity
structural and functional
51
New cards
island biogeography theory
A theory that was initially applied to oceanic islands to explain how species come to be distributed among them. Aspects of the theory include immigration and extinction rates,island size, and distance from the mainland.
52
New cards
Single Large or Several Small (SLOSS)
-refers to two different approaches to land conservation in order to protect biodiversity in a given region.
-The "single large" approach favors one sizeable, contiguous land reserve.
-The "several small" approach favors multiple smaller reserves of land whose total areas equal that of a large reserve.
-The "single large" approach favors one sizeable, contiguous land reserve.
-The "several small" approach favors multiple smaller reserves of land whose total areas equal that of a large reserve.
53
New cards
population growth affected by
births, deaths, immigration, emigration
54
New cards
metapopulation dynamics-genetics
local dynamics, landscape dynamics
55
New cards
metapopulation persistence
determined by local extinction and recolonization of subpopulations
56
New cards
source-sink theory
-assumes habitat quality varies from patch to patch
-models population dynamics in the context of heterogeneous habitats patches
-variation in habitat quality affects demographic rates (birth/death)
-there are intrinsic differences in habitat quality, so without immigration extinction in the sink is deterministic
-models population dynamics in the context of heterogeneous habitats patches
-variation in habitat quality affects demographic rates (birth/death)
-there are intrinsic differences in habitat quality, so without immigration extinction in the sink is deterministic
57
New cards
source
-good quality
-natality> mortality
-r>0
-demographic excess
-net emigration
-natality> mortality
-r>0
-demographic excess
-net emigration
58
New cards
sink
-lower quality
-mortality> natality
-r
-mortality> natality
-r
59
New cards
metapopulation dynamics
patch size, isolation, and location are not static (change over time due to environment)
-within-species interactions
-within-species interactions
60
New cards
metacommunity dynamics
between-species interactions
61
New cards
interspecific competition
-an interaction that negatively affects two or more species
-cornerstone of evolutionary ecology- the motivation for darwin's theory of natural selection
-driving force behind species divergence and phenotypic specialization
-cornerstone of evolutionary ecology- the motivation for darwin's theory of natural selection
-driving force behind species divergence and phenotypic specialization
62
New cards
mechanisms of competition
-exploitation
-interference
more specifically:
1. consumption
2. preemption
3. overgrowth
4. chemical interactions
5. territoriality
6. encounter
-interference
more specifically:
1. consumption
2. preemption
3. overgrowth
4. chemical interactions
5. territoriality
6. encounter
63
New cards
consumption competition (food exploitation)
when an individual of one species inhibits the growth of an individual of another species by consuming a shared resource
64
New cards
pre-emptive competition (space interference)
when an individual of one species occupies a given area and thereby precludes the establishment by others
-occurs primarily in sessile species
-occurs primarily in sessile species
65
New cards
overgrowth competition (light interference)
when one organism grows over top of another organism and prevents access to essential resources
66
New cards
chemical interactions
growth inhibitors or toxins released by one species inhibits growth or kills another
ex. allelopathy in spotted knapweed
ex. allelopathy in spotted knapweed
67
New cards
territorial competition (space interference)
the behavioral exclusion of other species form space that is defended as a territory
68
New cards
encounter competition
when non-territorial meetings between individuals negatively affects one or both participating species
69
New cards
Lotka-Volterra Model
A continuous-time model that calculates the influence of each of two populations (predator and prey, or competitors) on the abundance of the other
70
New cards
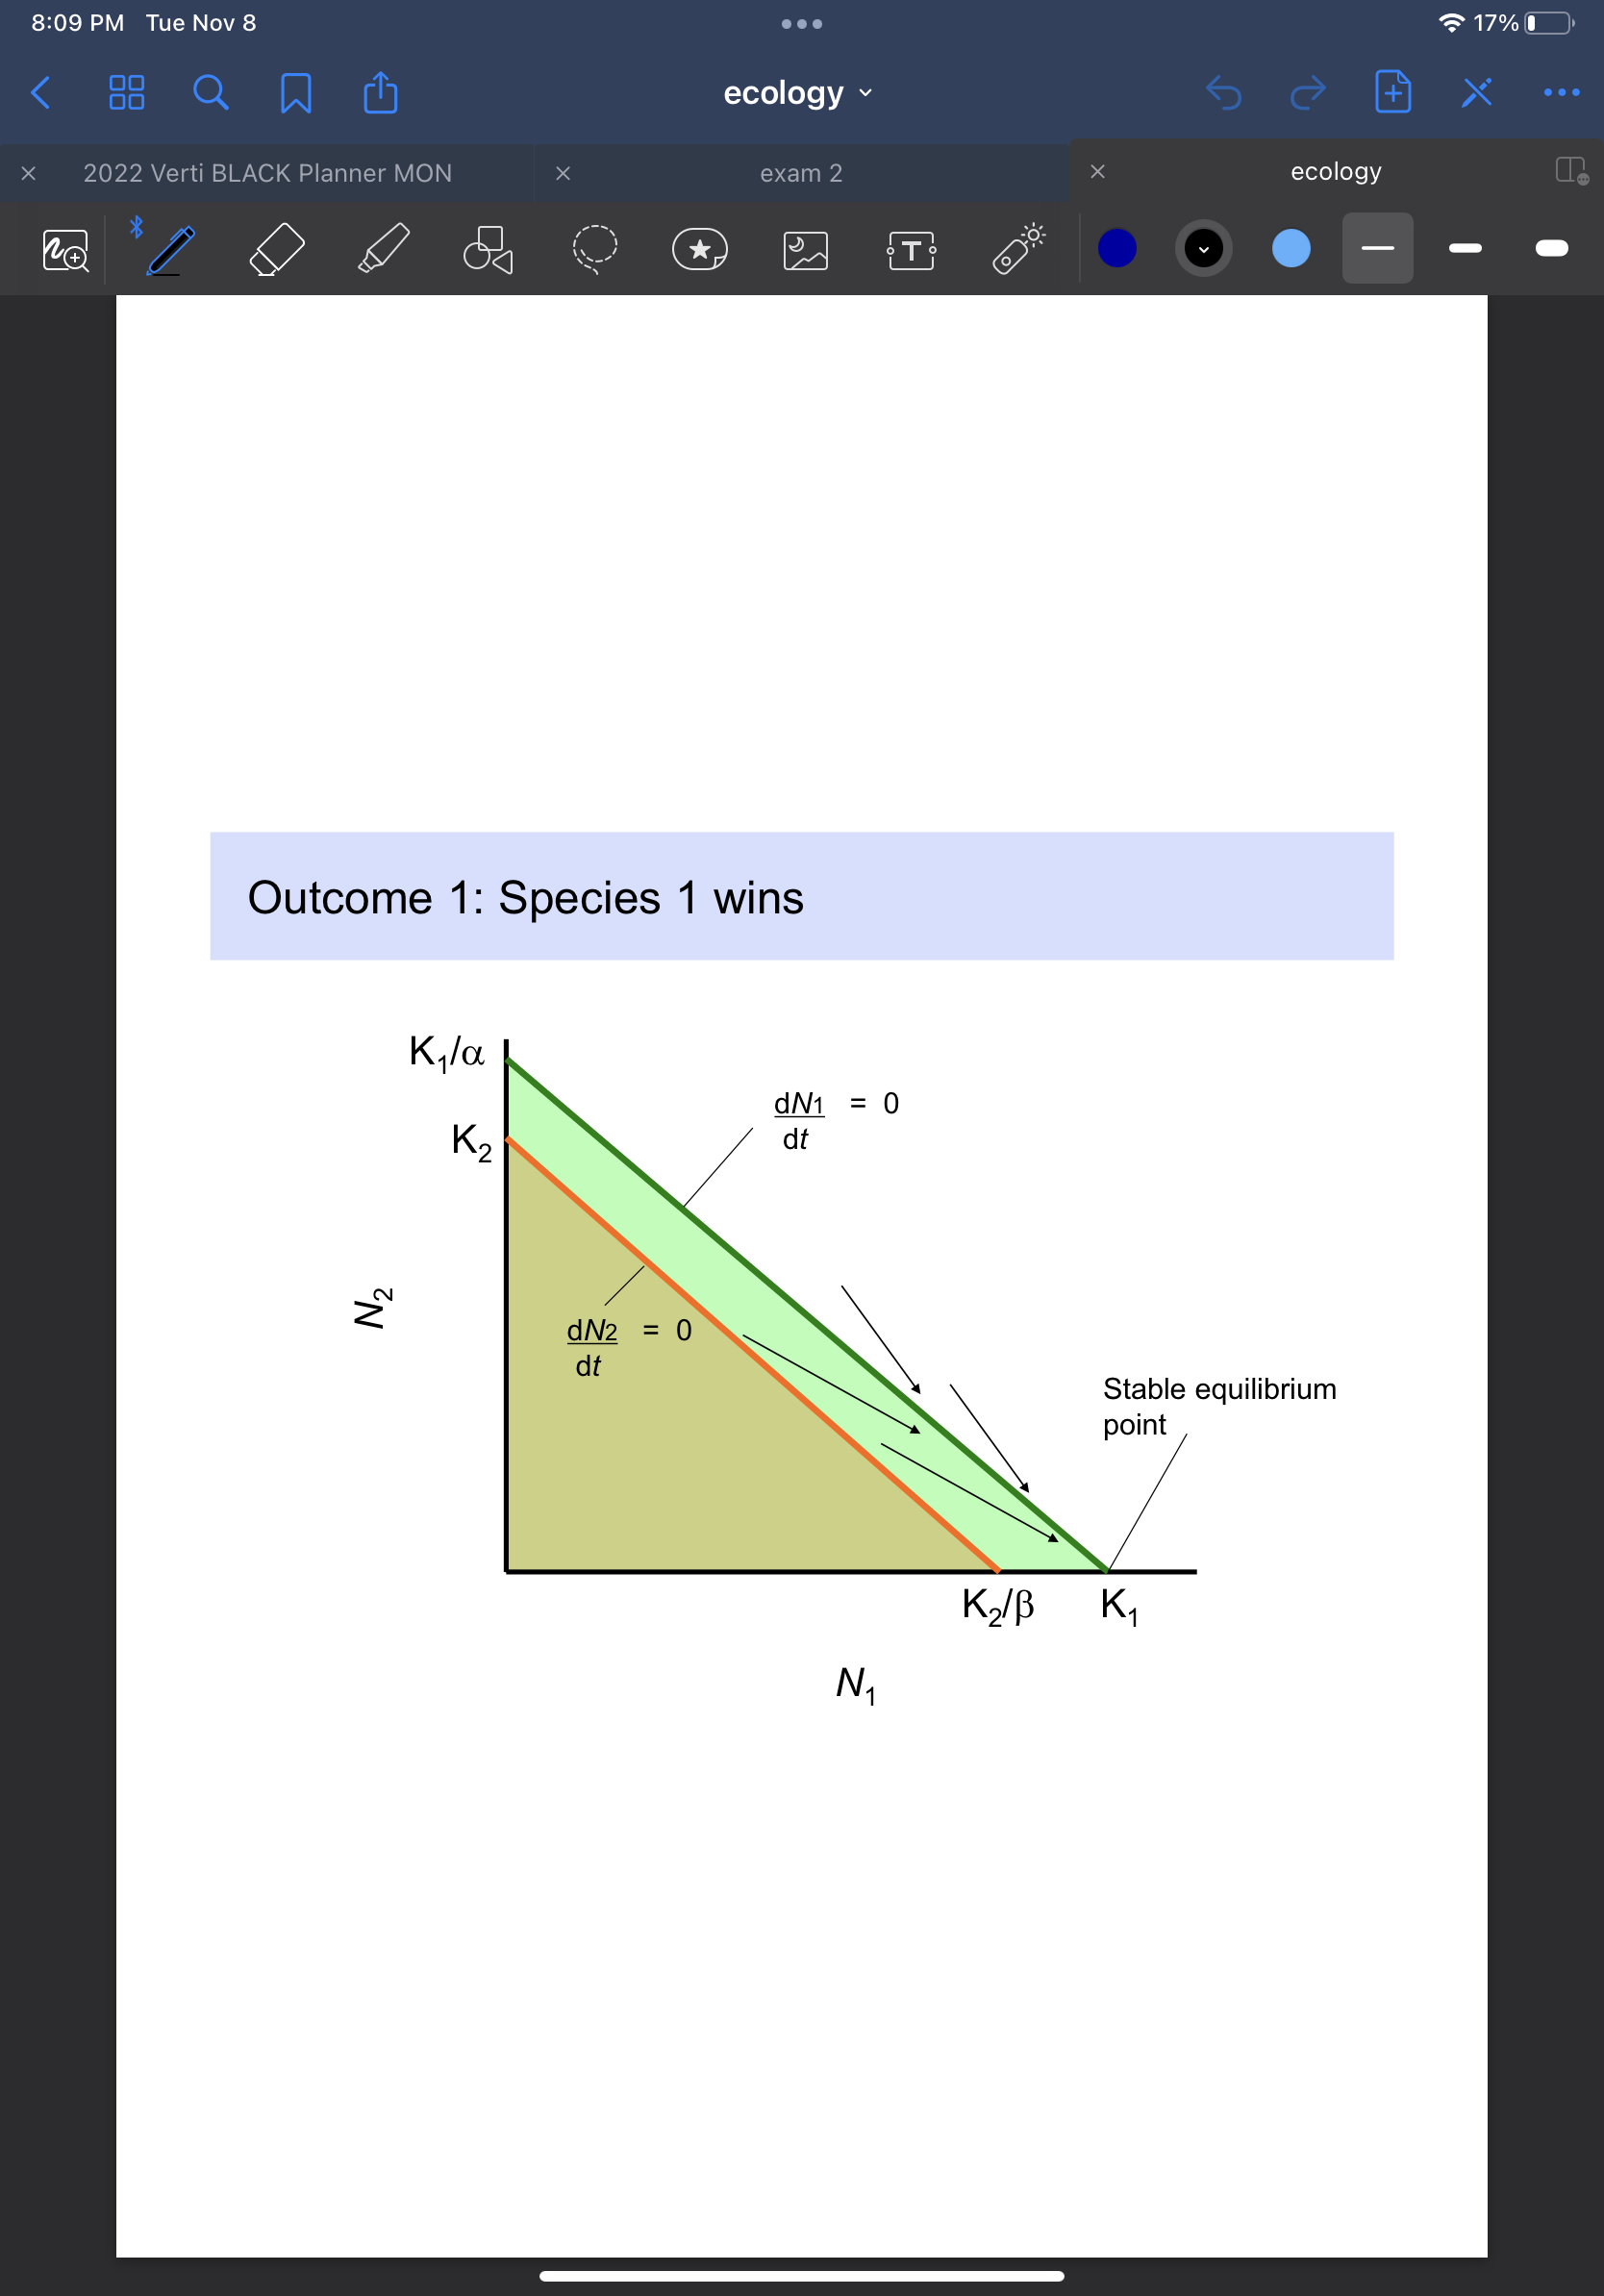
four possible outcomes of interspecific competition
1. species 1 wins
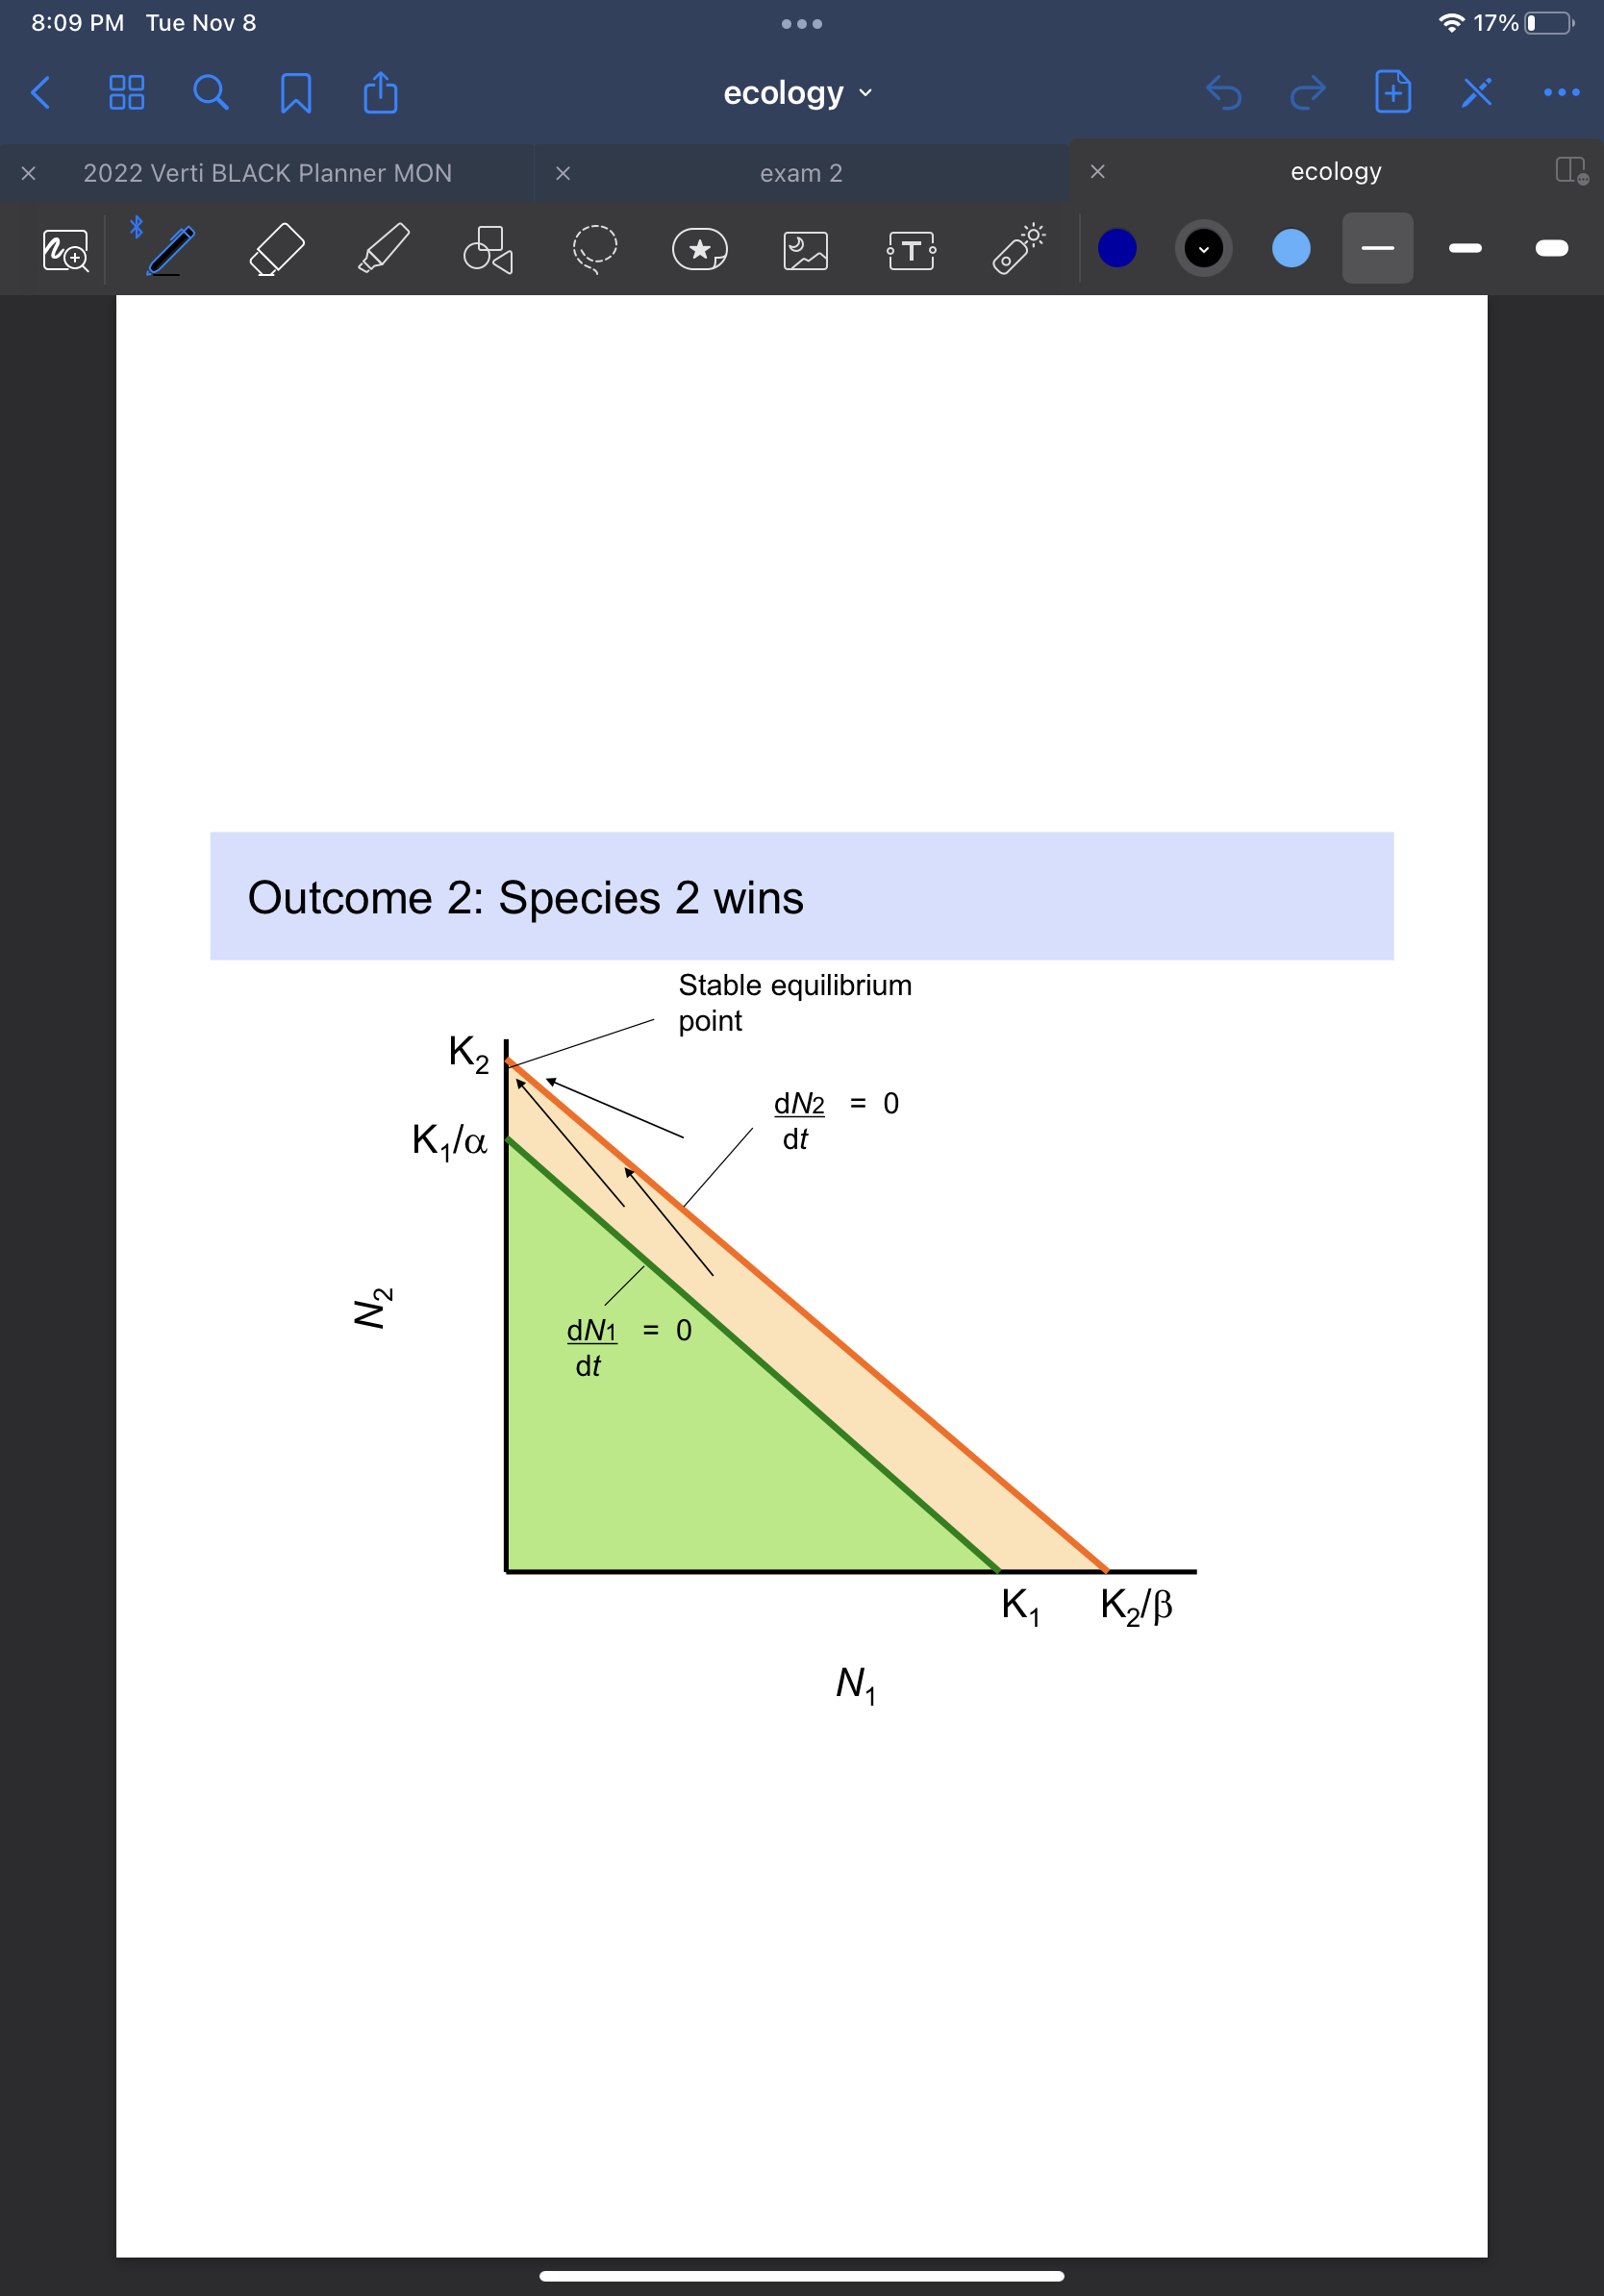
2. species 2 wins
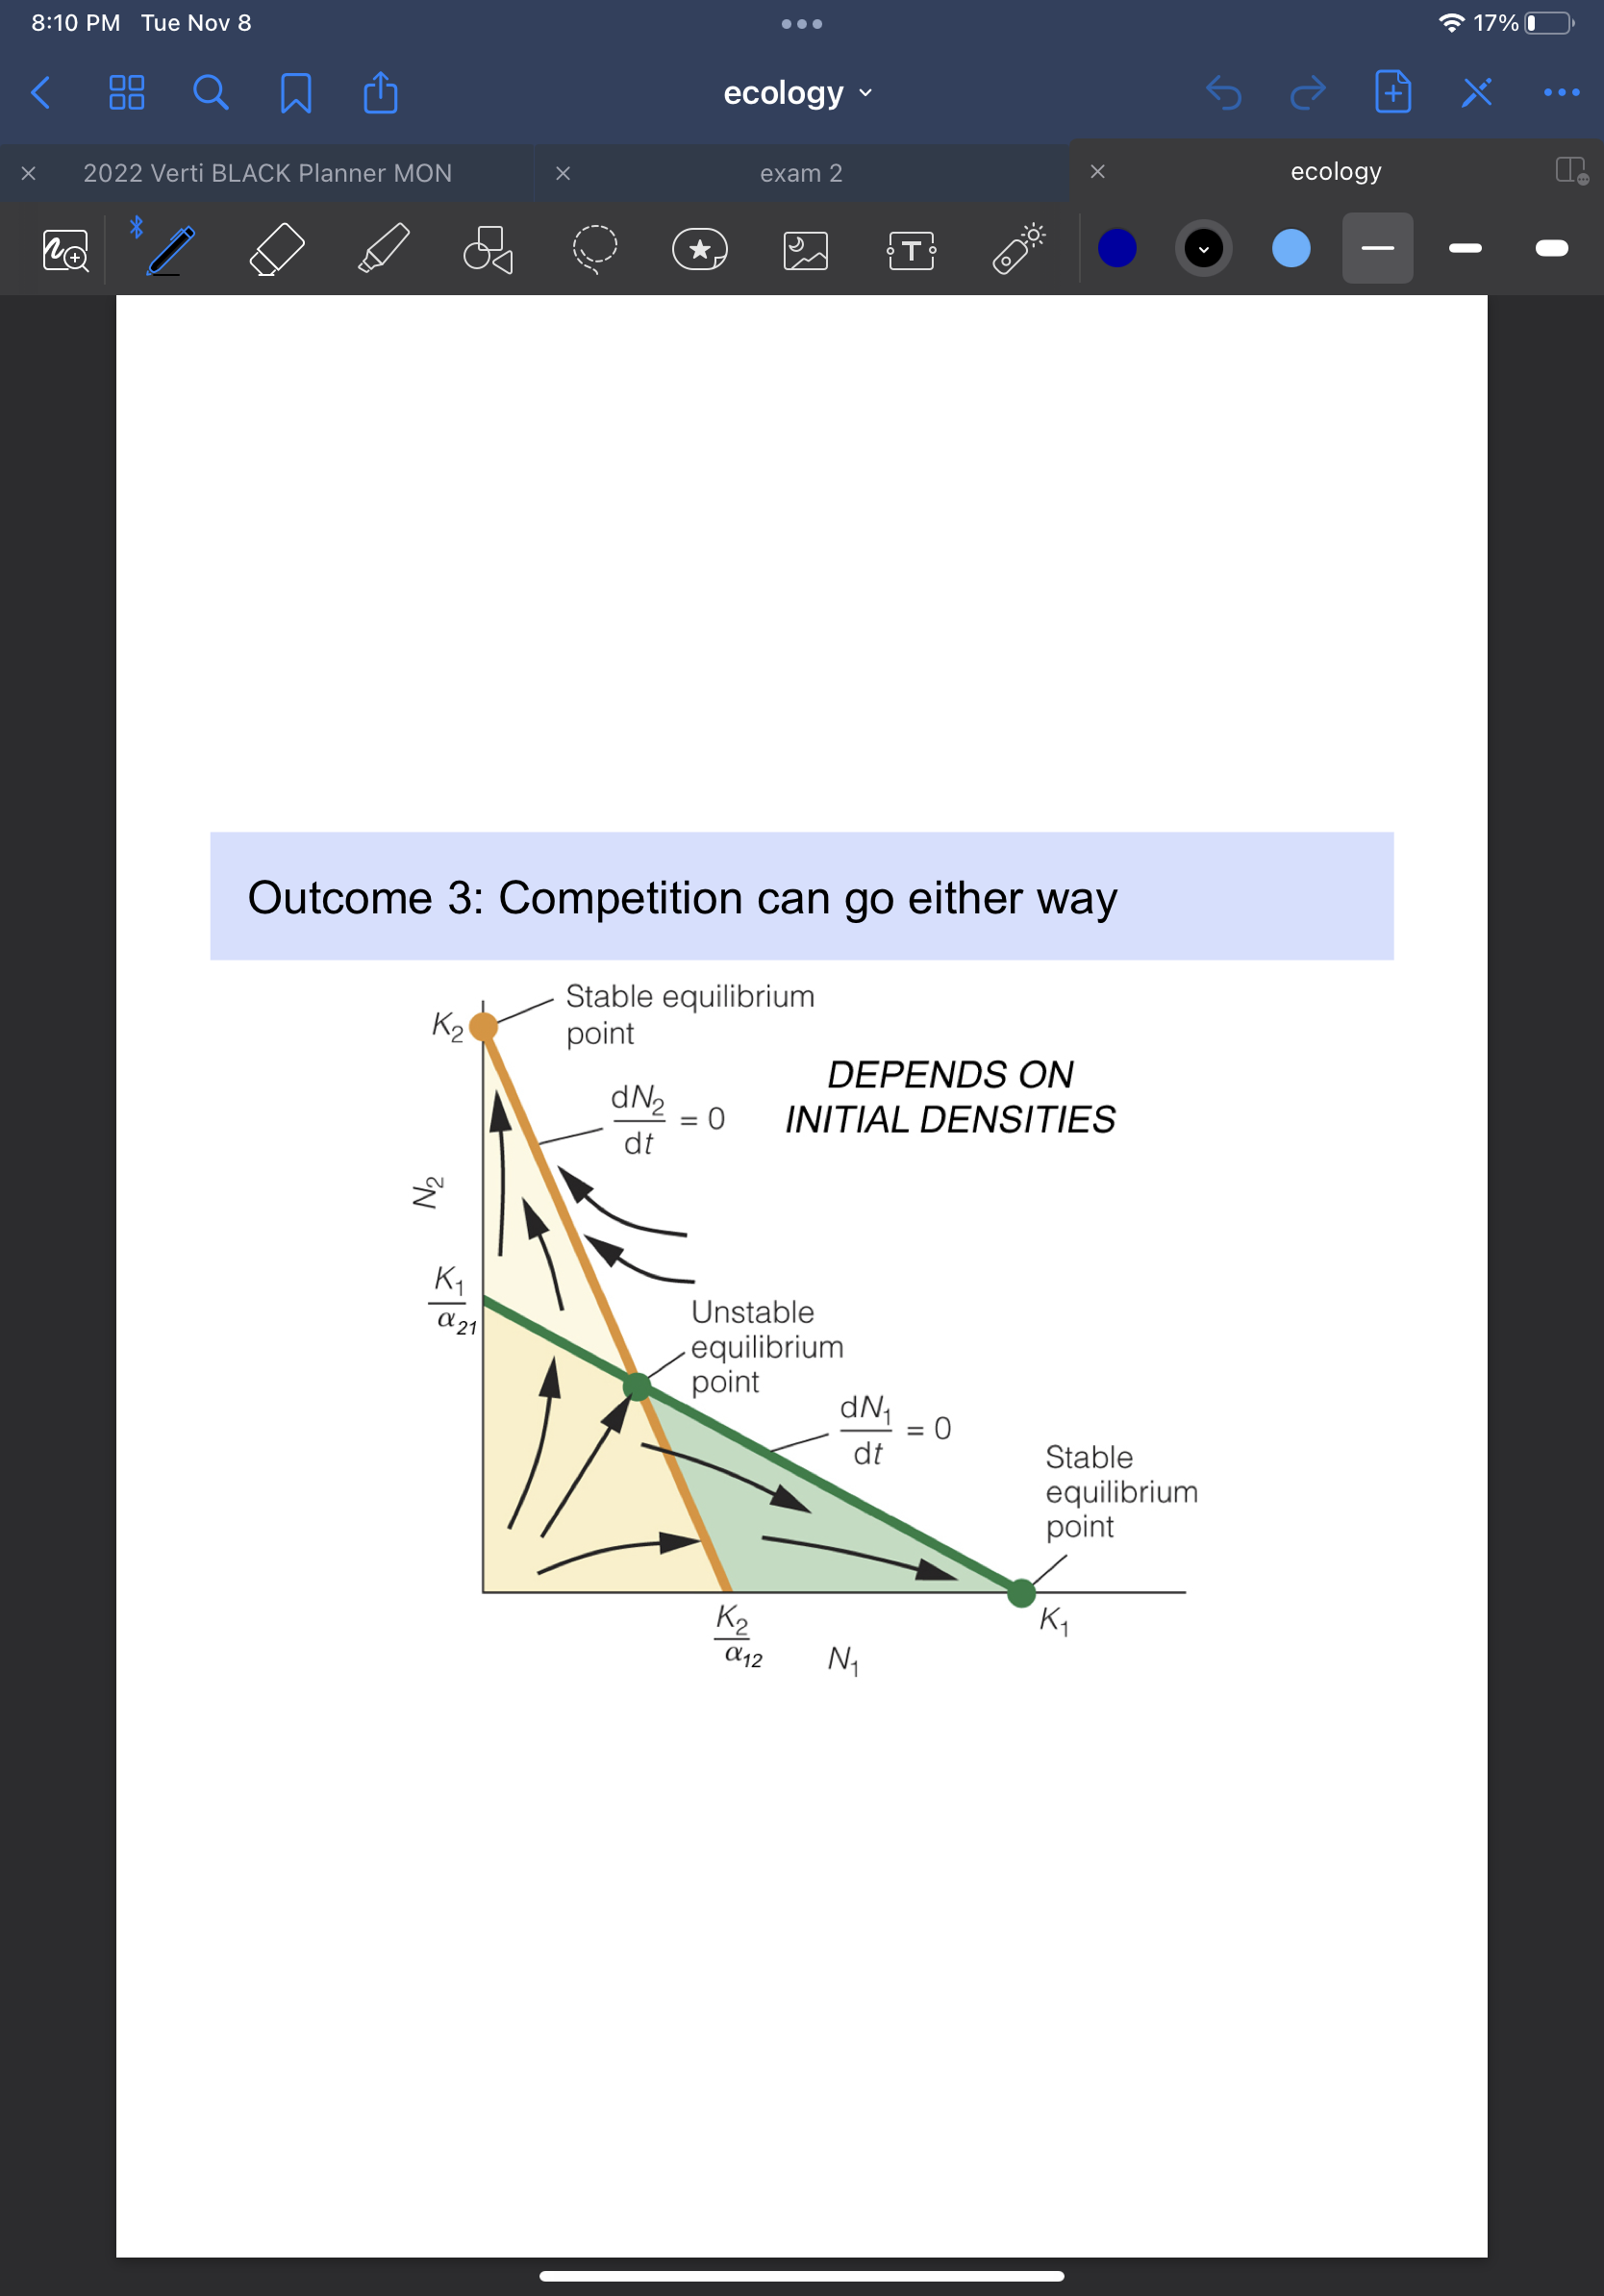
3. each species could outcompete each other
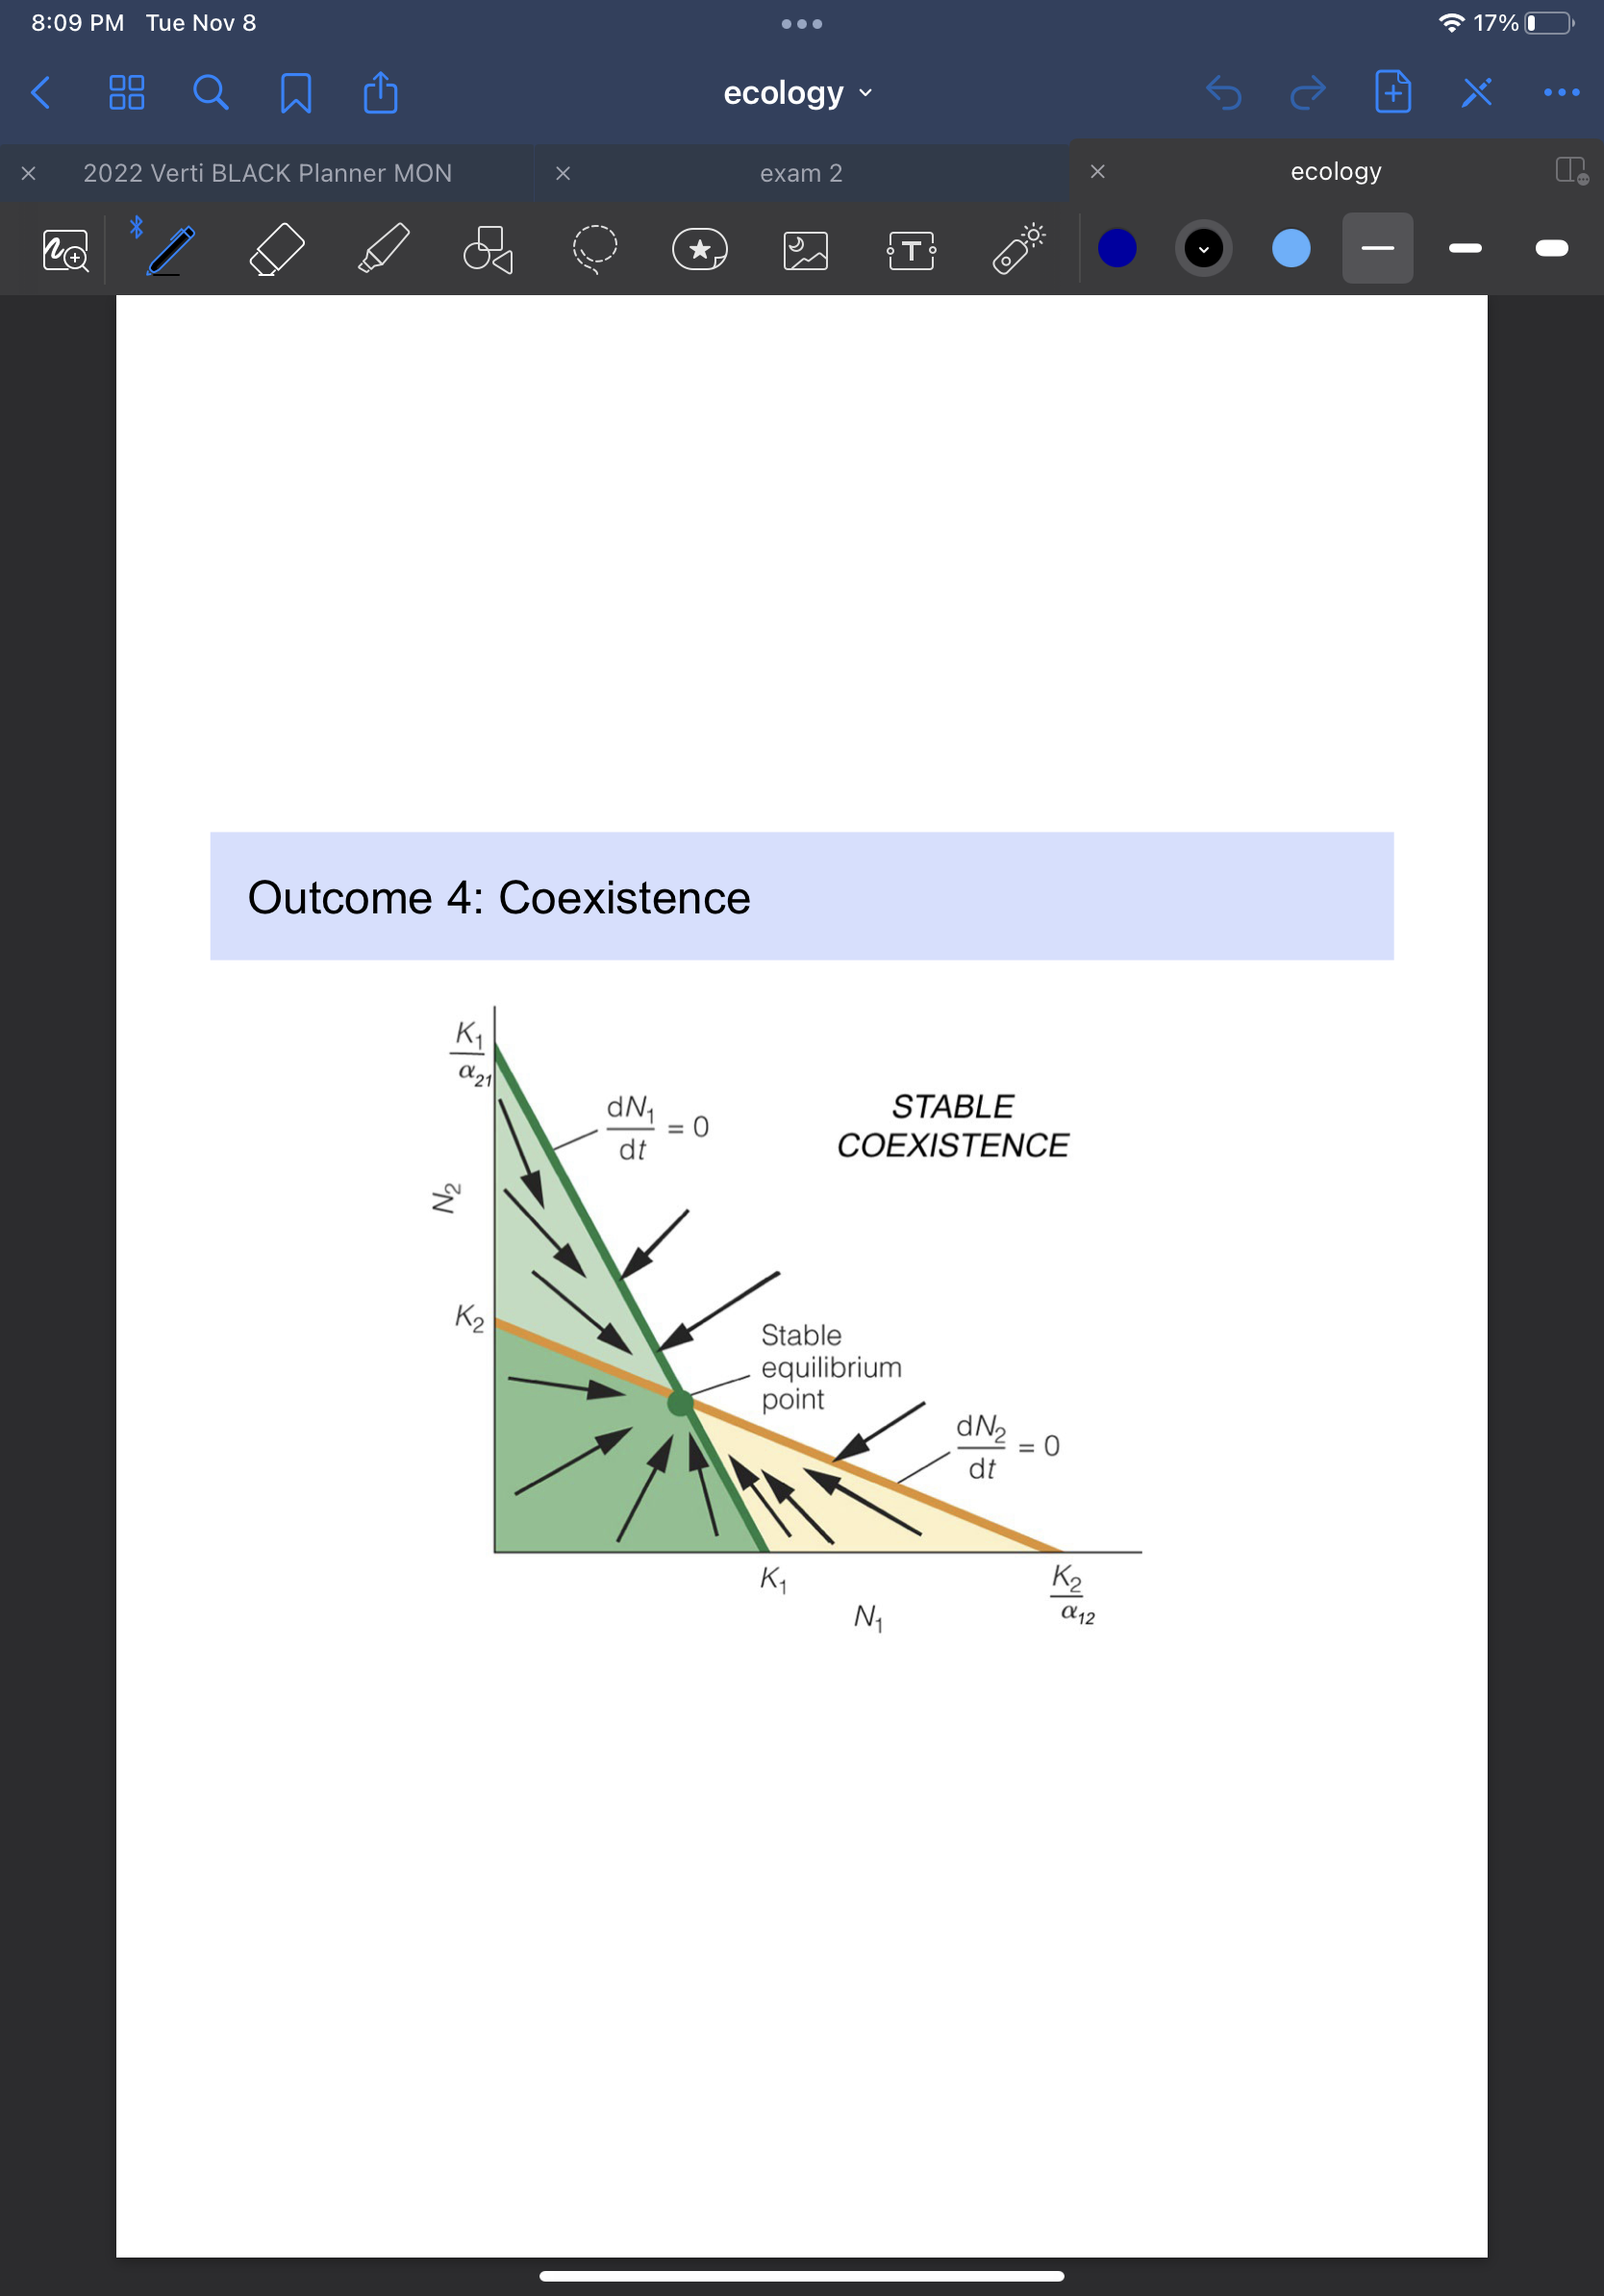
4. neither species can achieve the necessary density to out compete the other (coexistence)
2. species 2 wins
3. each species could outcompete each other
4. neither species can achieve the necessary density to out compete the other (coexistence)
71
New cards
the competitive exclusion principle
two species that live in the same place and have the same ecological requirements cannot coexist
72
New cards
assumptions of the competitive exclusion principle
1. Competitors have exactly the same resource requirement
2. Environmental conditions remain constant (rare)
2. Environmental conditions remain constant (rare)
73
New cards
factors that affect competition
-rapid growth increases a plant's ability to compete for space, nutrients in light
-however, non-resource factors also affect growth and germination (pH, temperature, relative humidity, salinity)
-temporal variation in the environment
-competitive ability varies with environmental gradients
-superior competitor depends on nutrient availability
-however, non-resource factors also affect growth and germination (pH, temperature, relative humidity, salinity)
-temporal variation in the environment
-competitive ability varies with environmental gradients
-superior competitor depends on nutrient availability
74
New cards
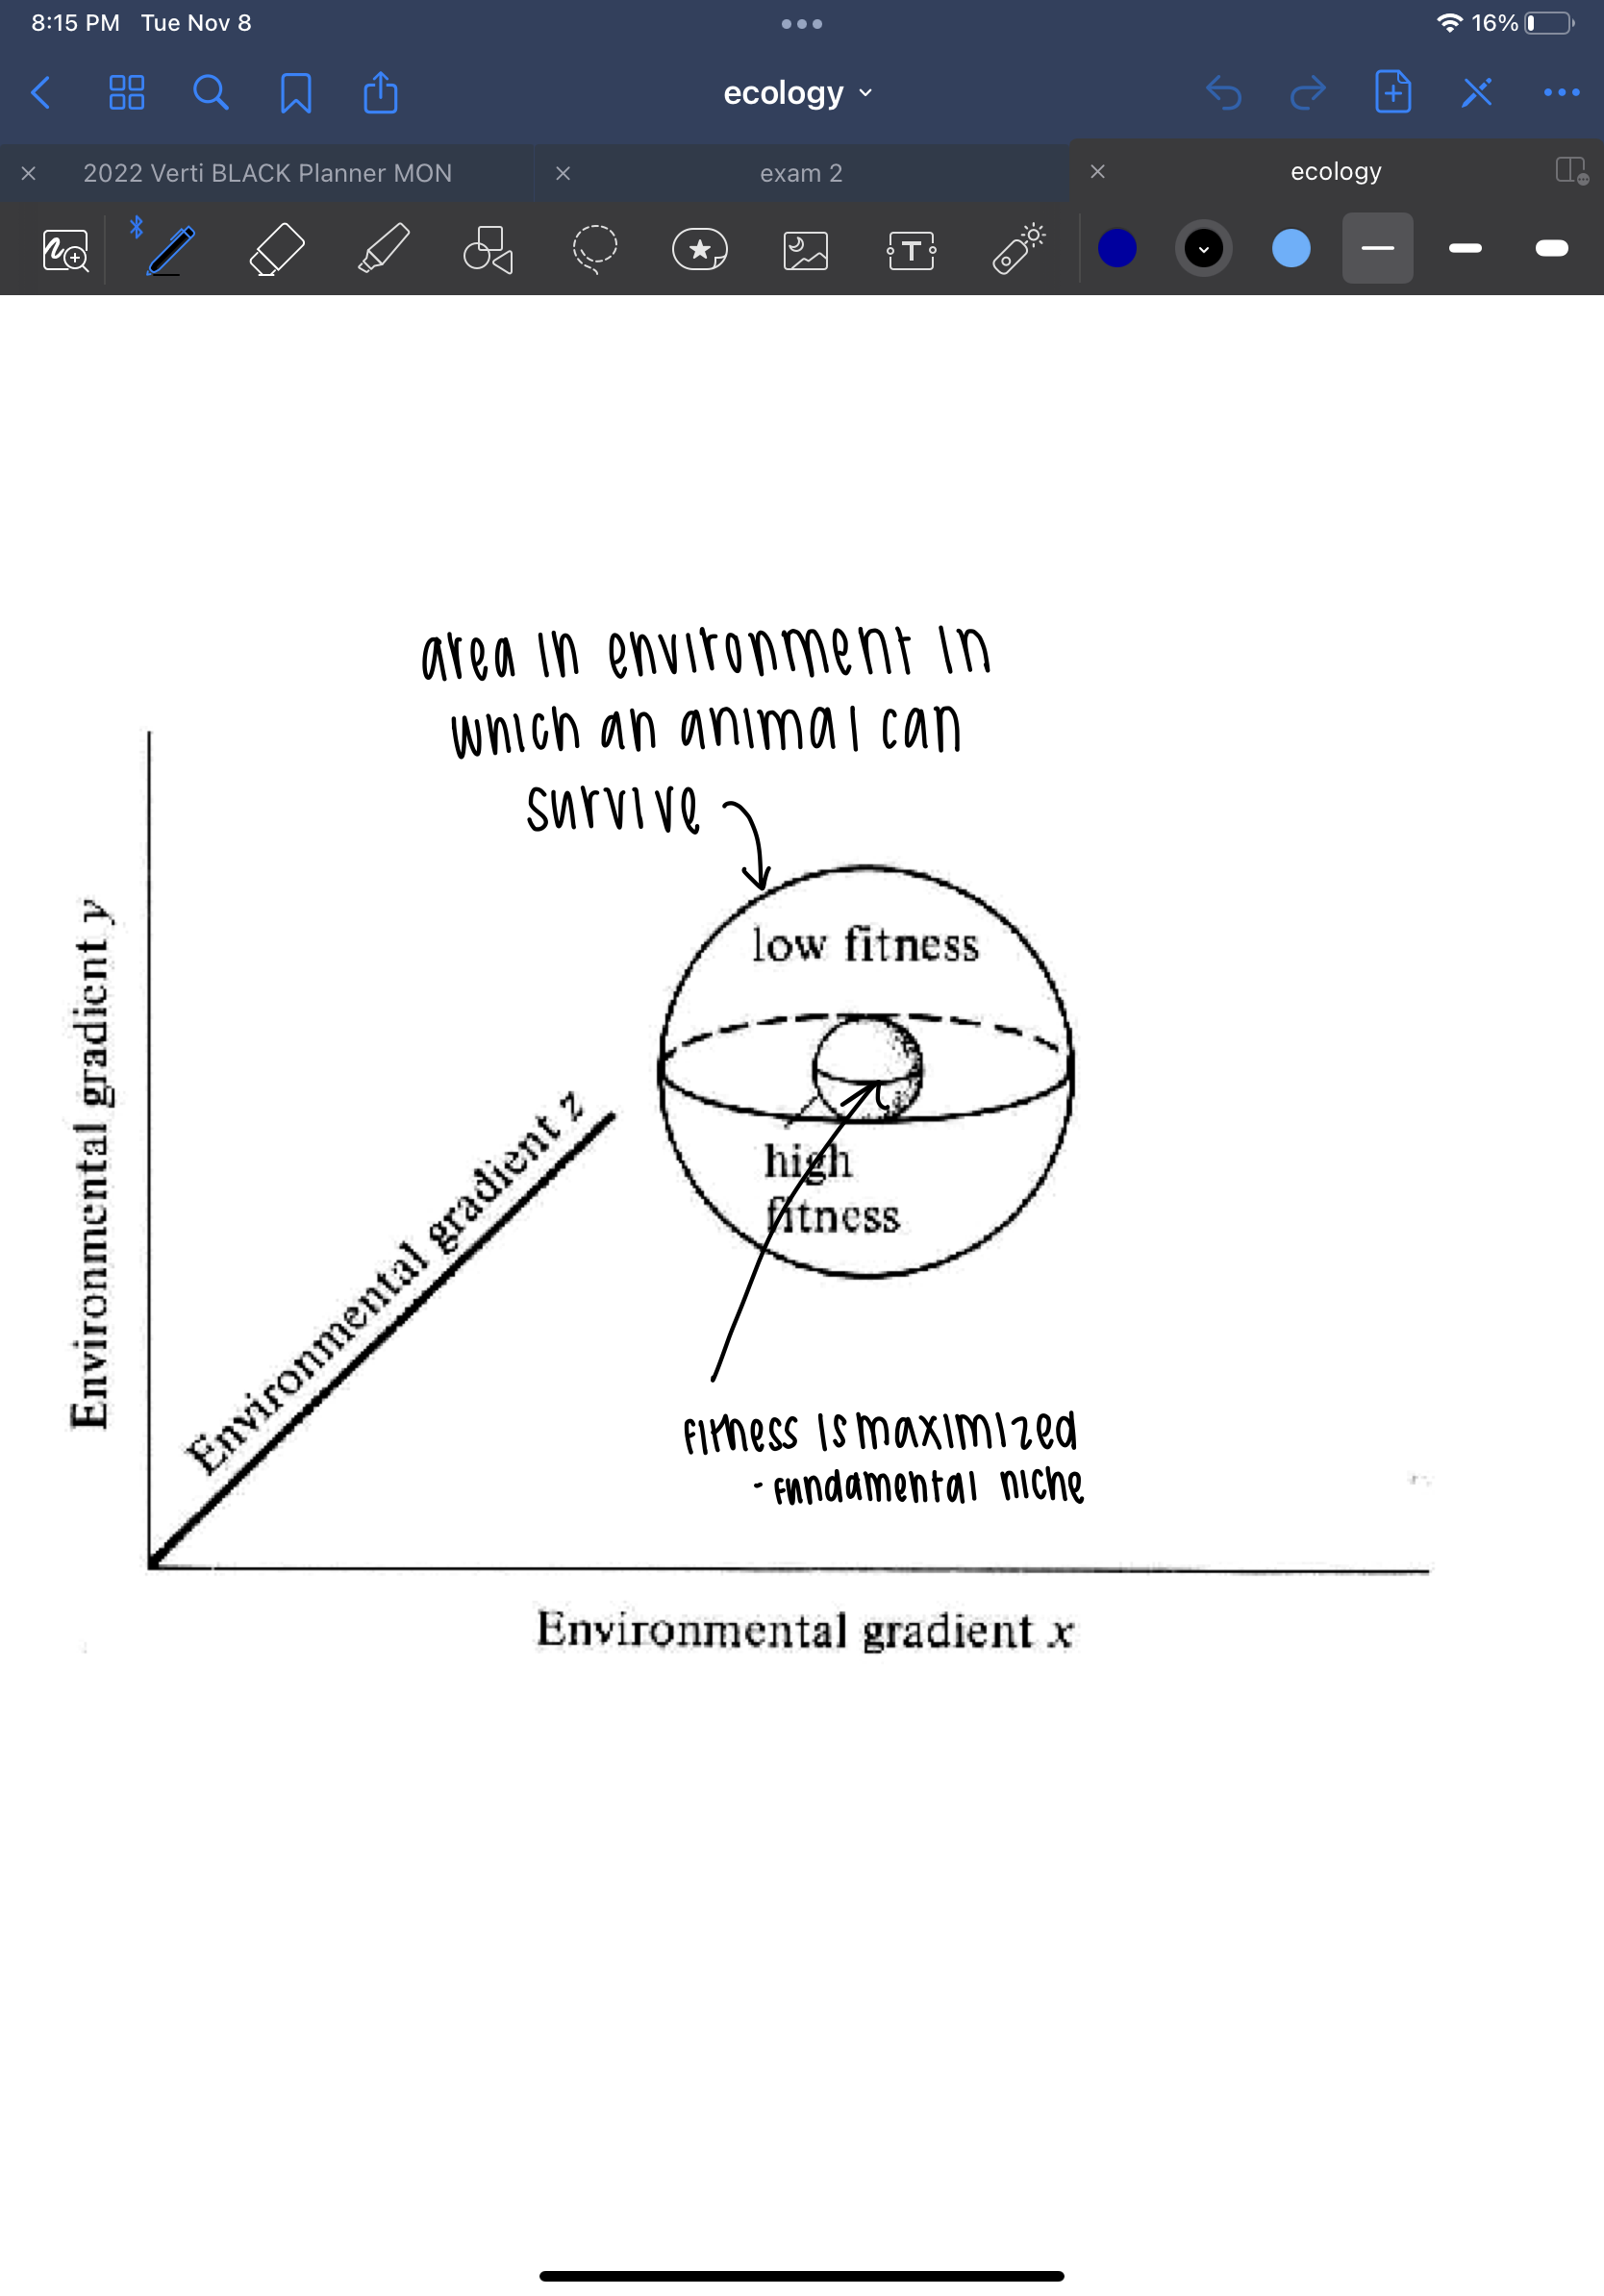
ecological niche
sum of a species' tolerance limits for all environmental factors
75
New cards
niche
consists of all the factors necessary for a species' existence in terms of time, space, and required resources
76
New cards
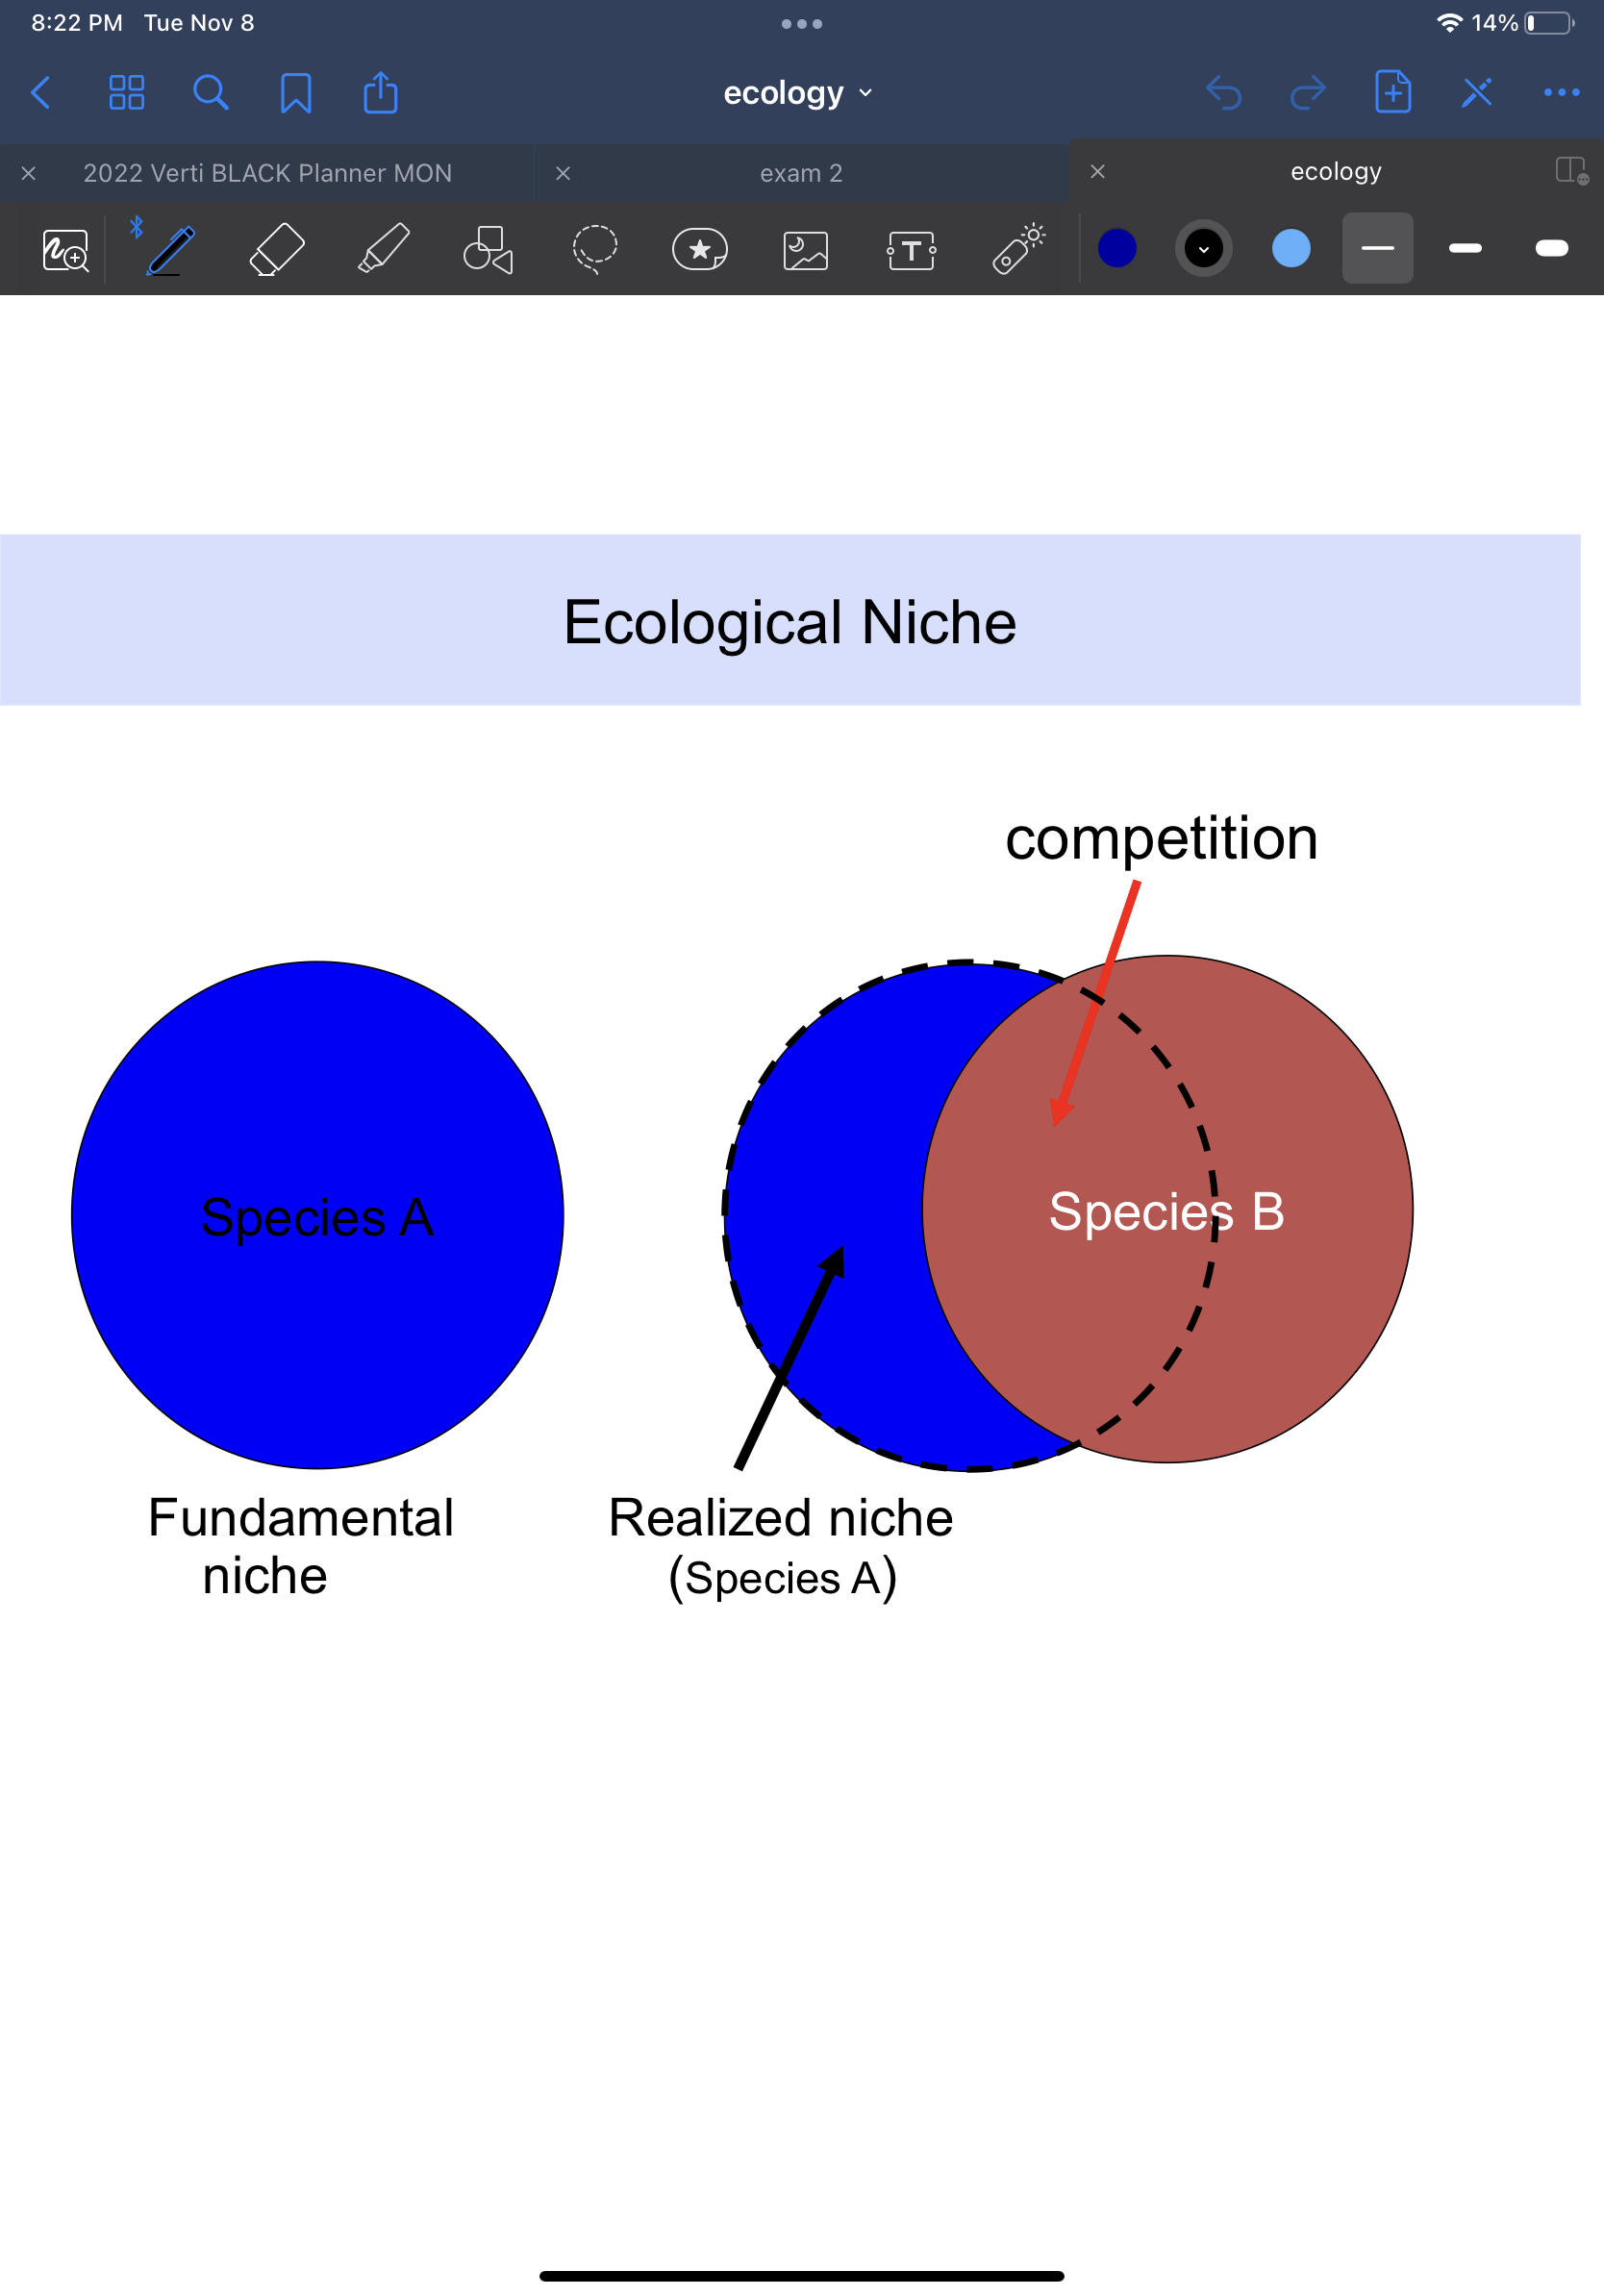
fundamental niche
all the possible dimensions in which species can survive
77
New cards
realized niche
the dimensions a species occupies after the effects of interspecific competition and other biotic interactions
78
New cards
species one wins
79
New cards
species 2 wins
80
New cards
competition can go either way
81
New cards
outcome 4: coexistence
82
New cards
evolutionary response to competition
-competitive interactions among species are not stable over evolutionary timescales
-populations should evolve to reduce negative effects of competition by minimizing interaction
-competition promotes the evolutionary divergence of tolerance ranges
-populations should evolve to reduce negative effects of competition by minimizing interaction
-competition promotes the evolutionary divergence of tolerance ranges
83
New cards
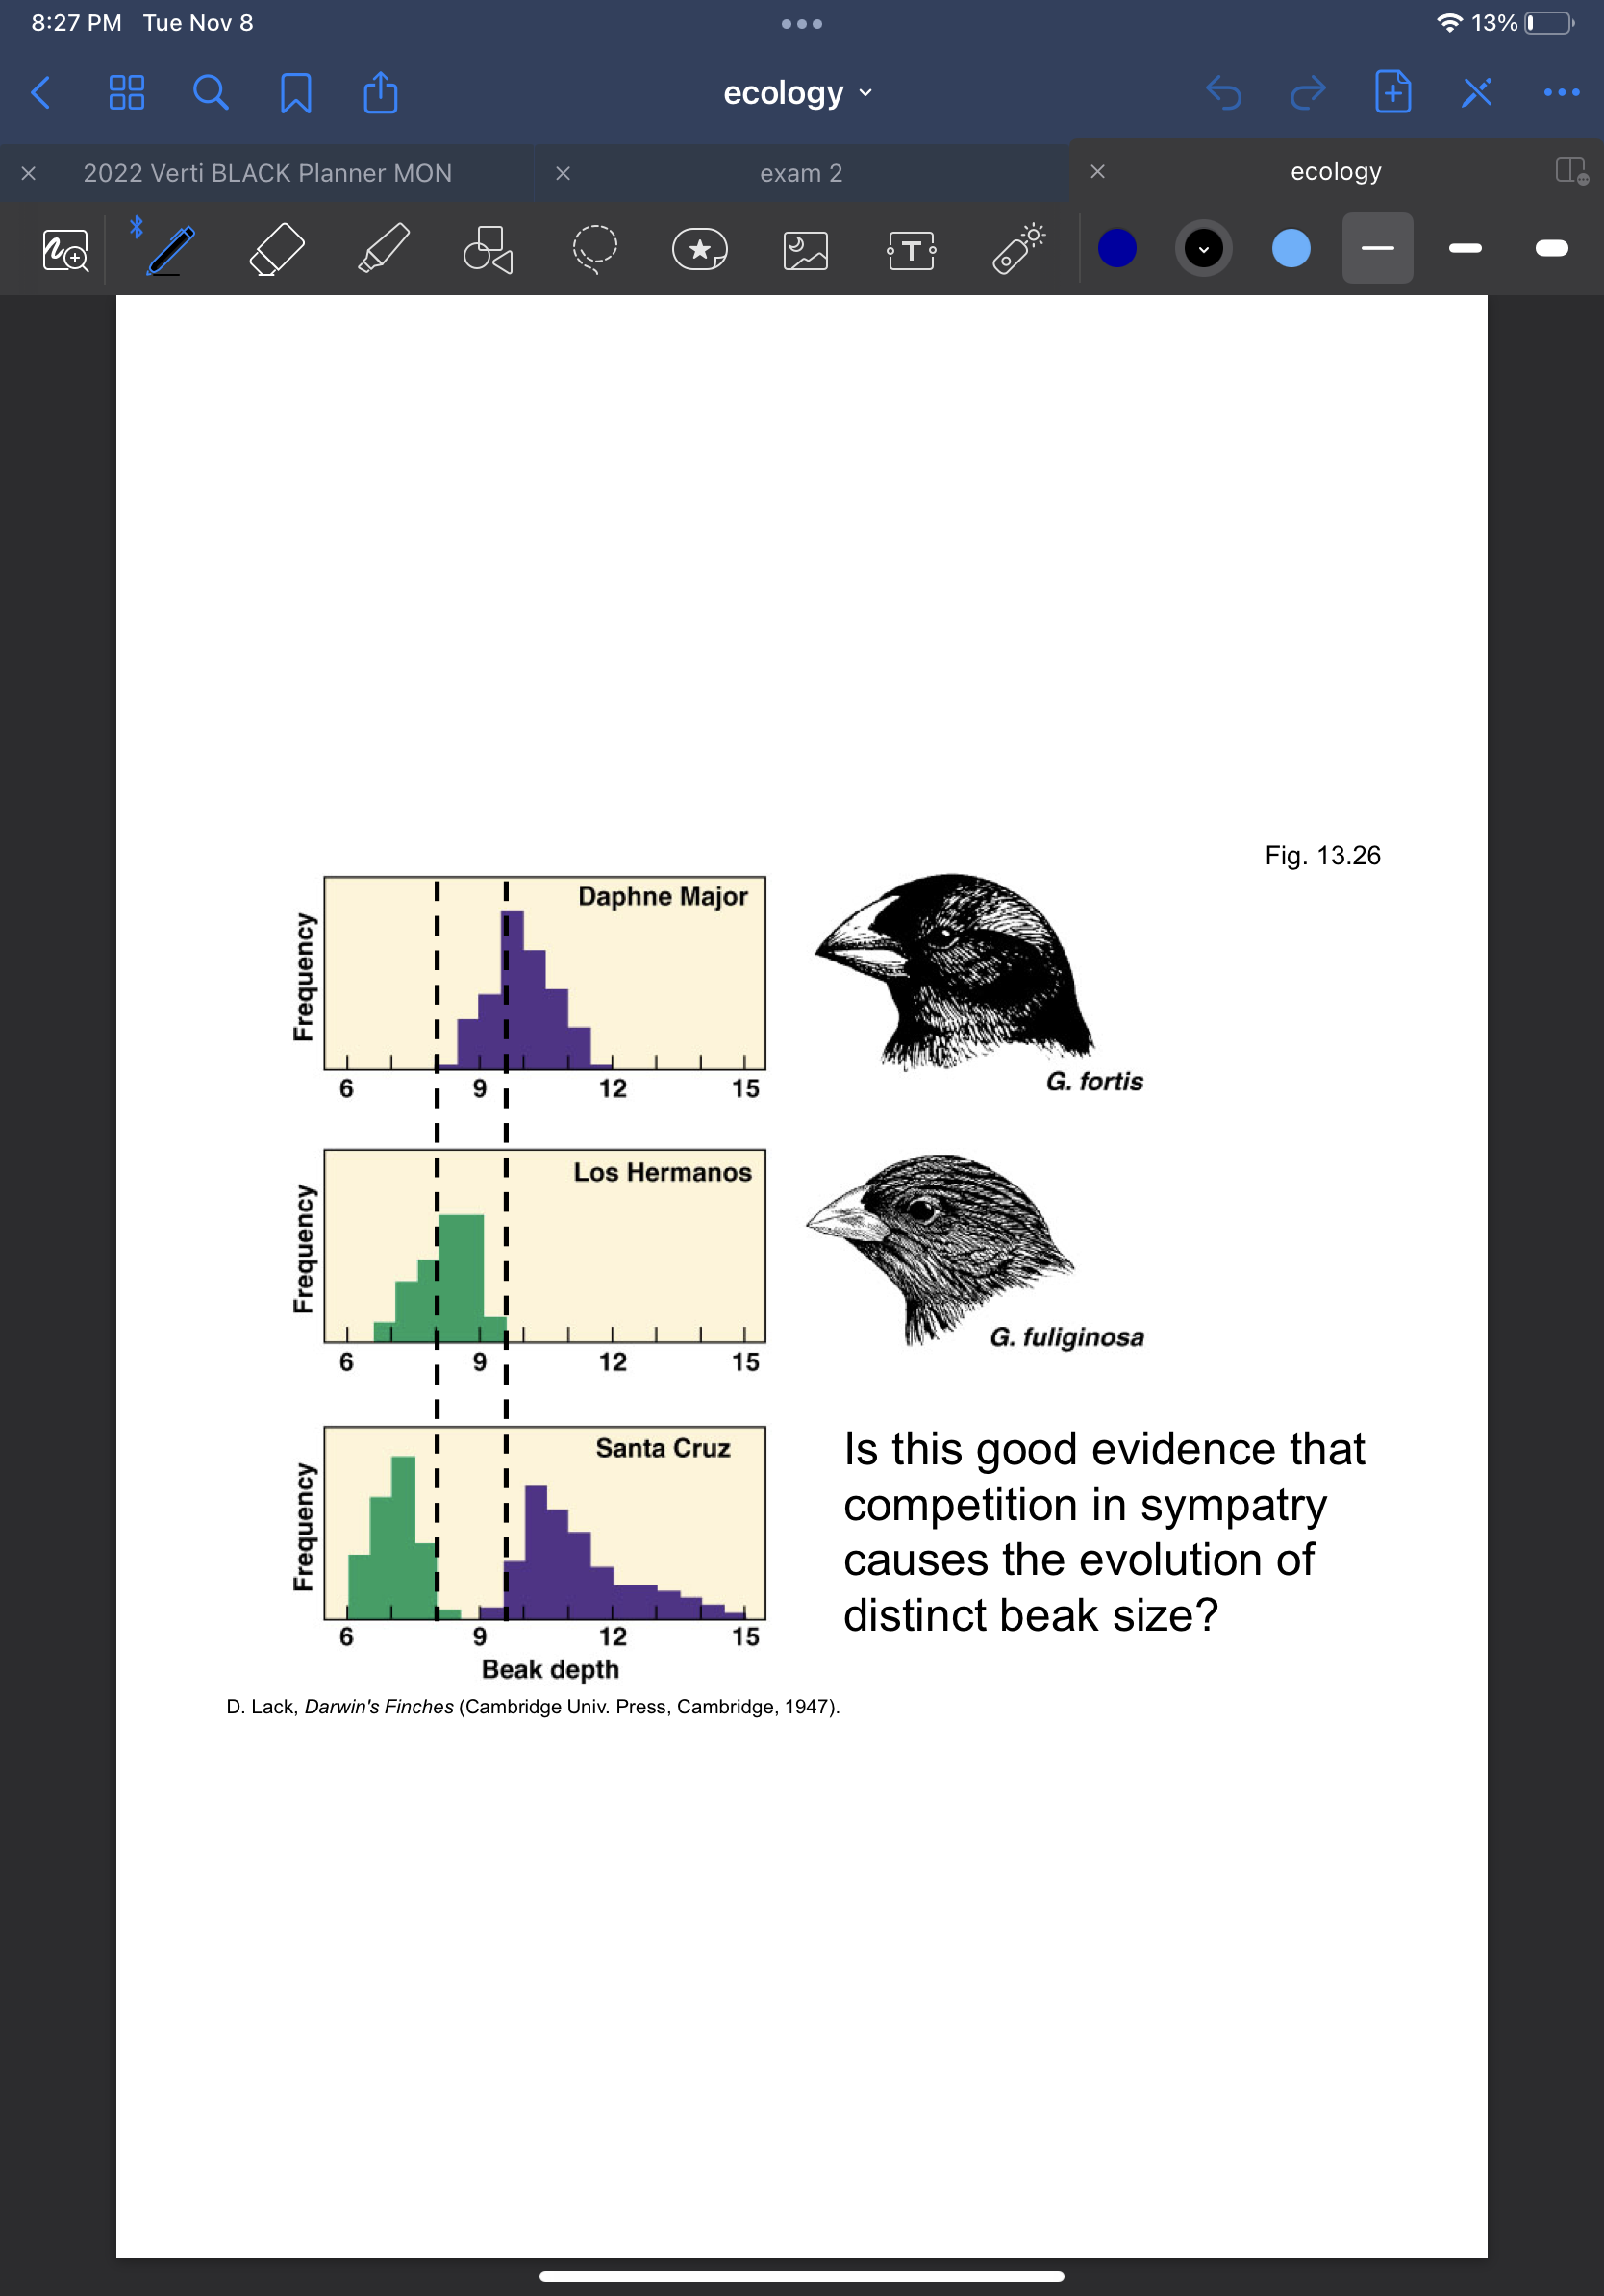
character displacement
when tolerance ranges differentiate to reduce interaction
ex. there is an overlap in beak size for Galapagos ground finches but in islands where they are together, there is no overlap in beak size
ex. there is an overlap in beak size for Galapagos ground finches but in islands where they are together, there is no overlap in beak size
84
New cards
resource partitioning
when two or more organisms use different portions of a common resource simultaneously
-ex. resource partitioning in prairie plants reduces competition for soil moisture
-ex. resource partitioning in prairie plants reduces competition for soil moisture
85
New cards
how different do species need to be?
-often species are competing for multiple resources
-multidimensional nature of resource requirements reduces niche overlap
-multidimensional nature of resource requirements reduces niche overlap
86
New cards
competition interacts with environmental factors
degree to which competition shapes communities varies along environmental gradients
-ex. one side of scale is community shaped by stress tolerance vs. other side is community shaped by competition for nutrients
-ex. one side of scale is community shaped by stress tolerance vs. other side is community shaped by competition for nutrients
87
New cards
disassociated injurious feeder
-interaction doesn't last long, prey isn't killed
-"grazer like"
-ex. rabbits eating plants
-"grazer like"
-ex. rabbits eating plants
88
New cards
intimate injurious feeder
-interaction is long lasting, prey not killed
-"parasite-like"
-ex. parasite on host
-"parasite-like"
-ex. parasite on host
89
New cards
intimate lethal feeder
-interaction is long lasting, prey killed
-"parasitoid-like"
-"parasitoid-like"
90
New cards
disassociated lethal feeder
-interaction doesn't last long, prey killed
-"predator like"
-ex. lion and antelope
-"predator like"
-ex. lion and antelope
91
New cards
Predator population equation
92
New cards
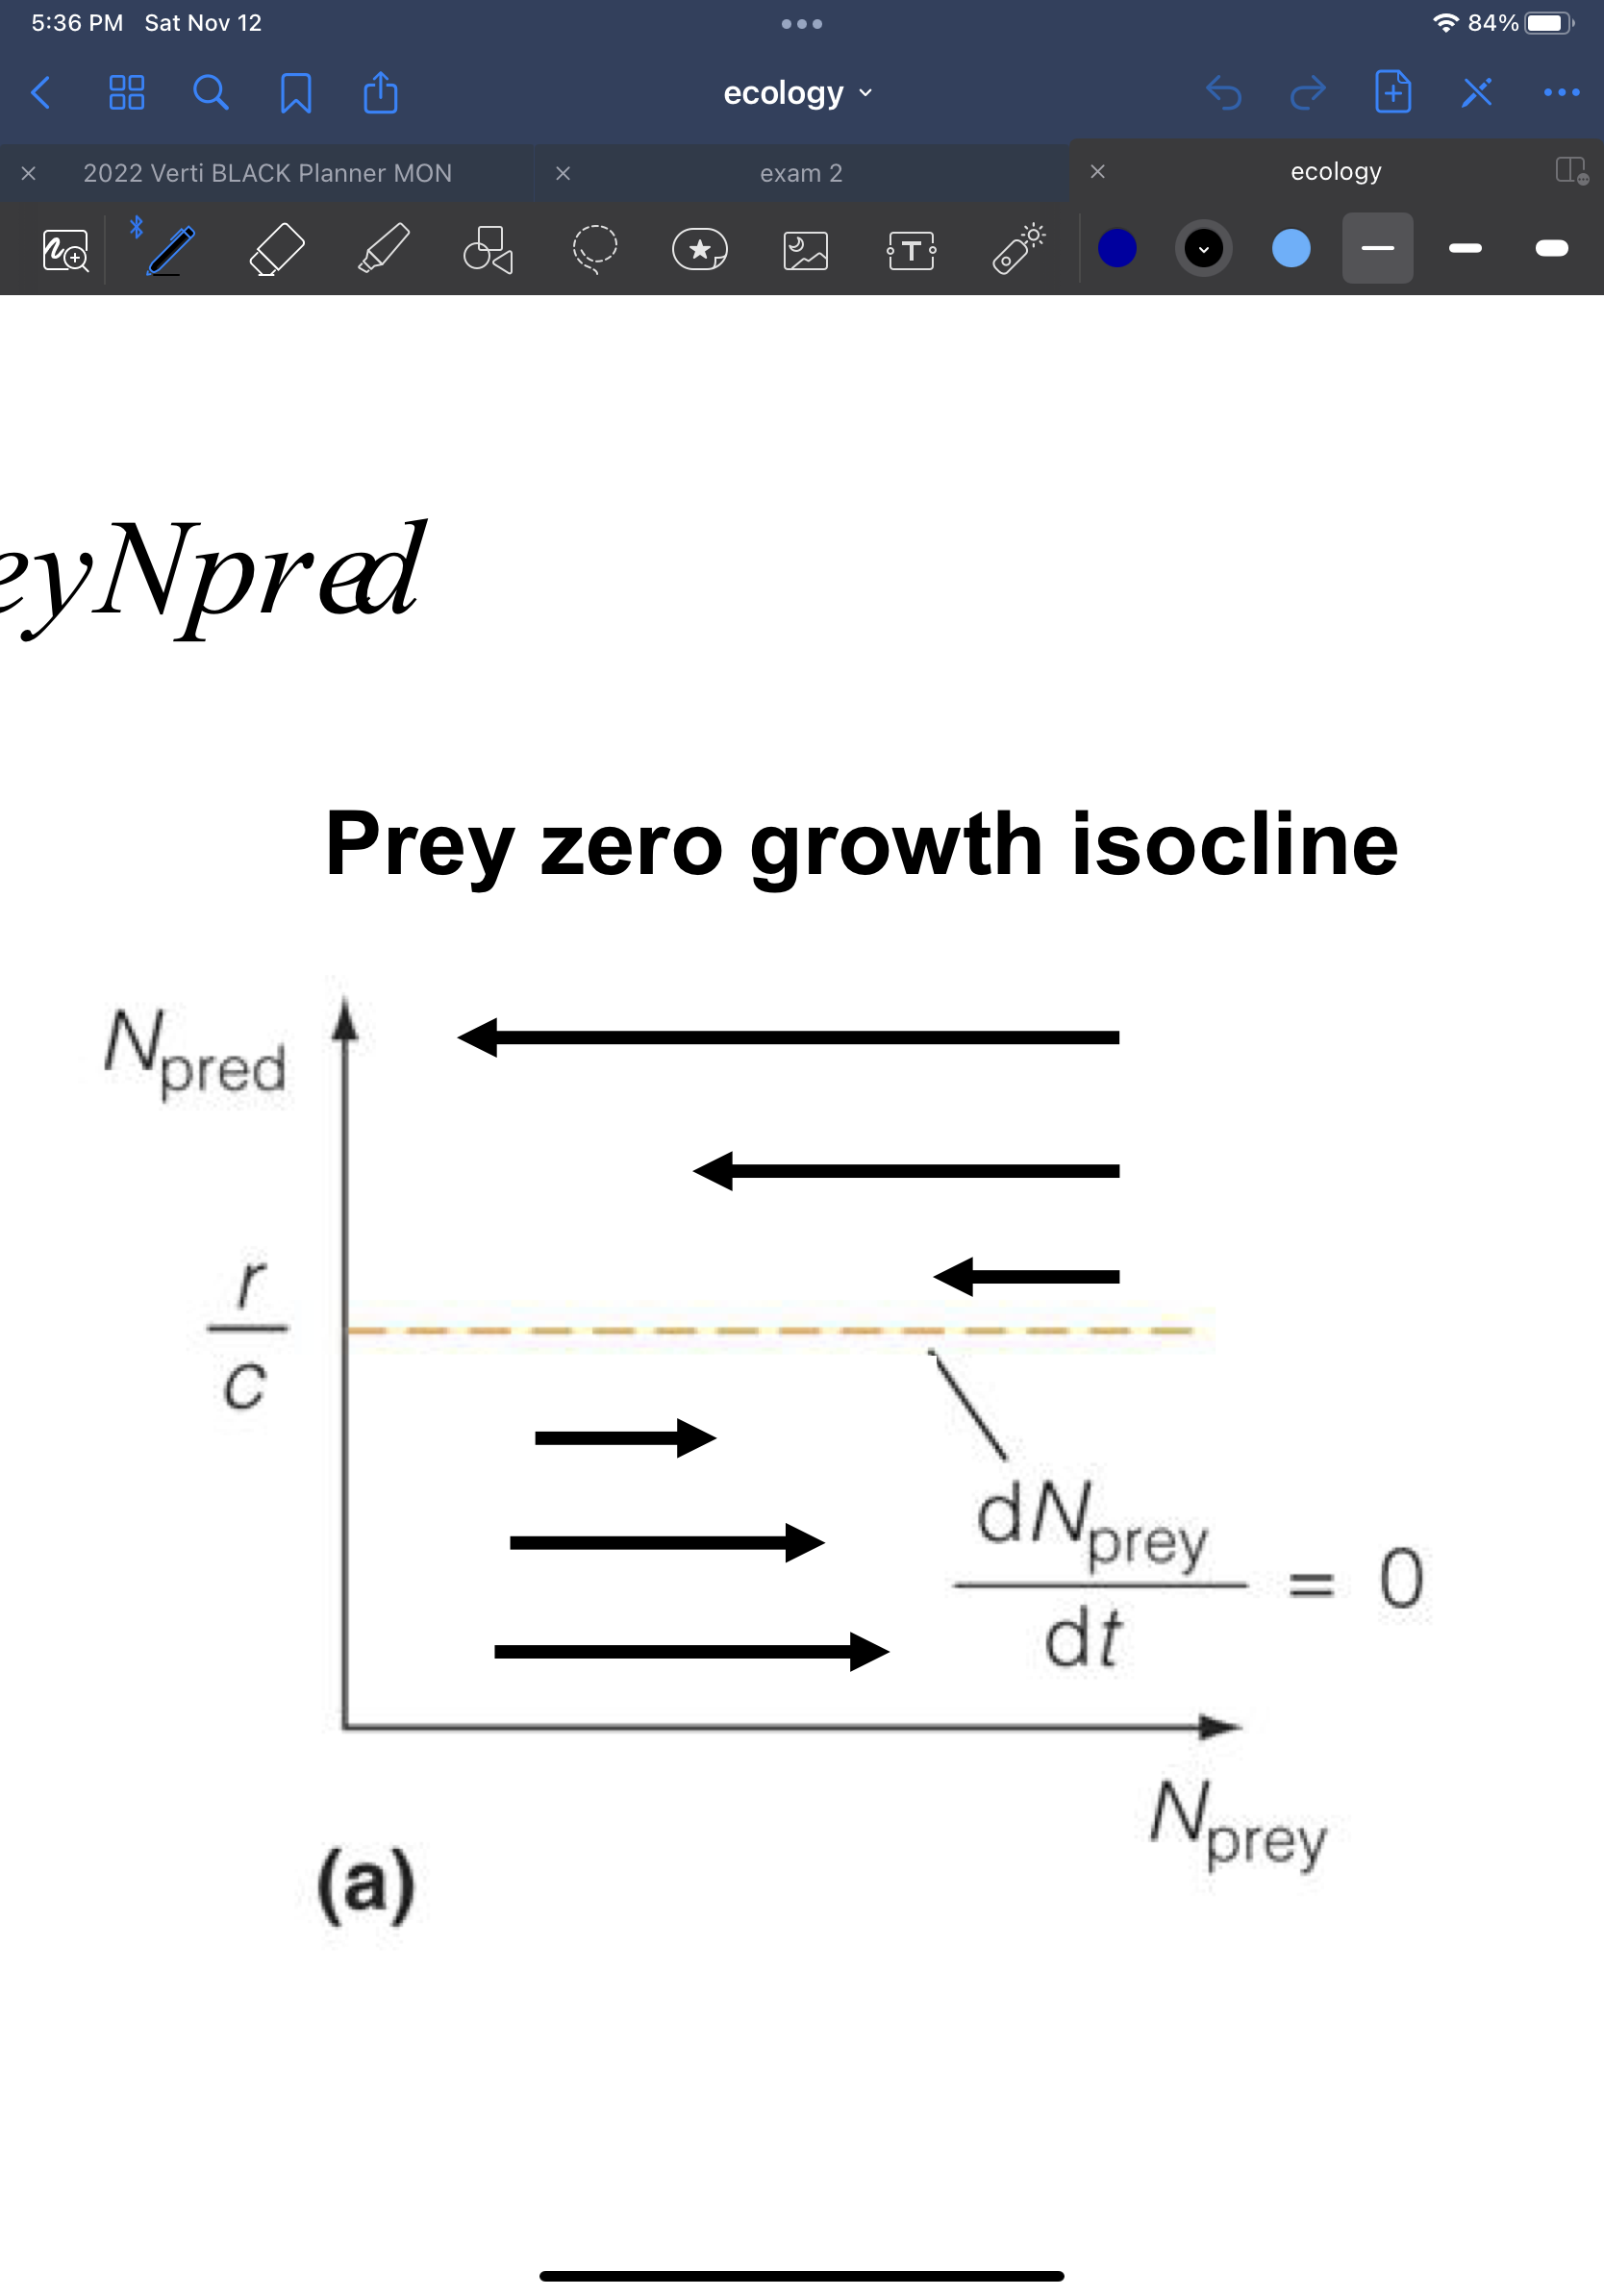
prey zero growth isocline
-predator density zero/low, exponential growth
-predator density increases; at some point mortality=births
-predator density increases; at some point mortality=births
93
New cards
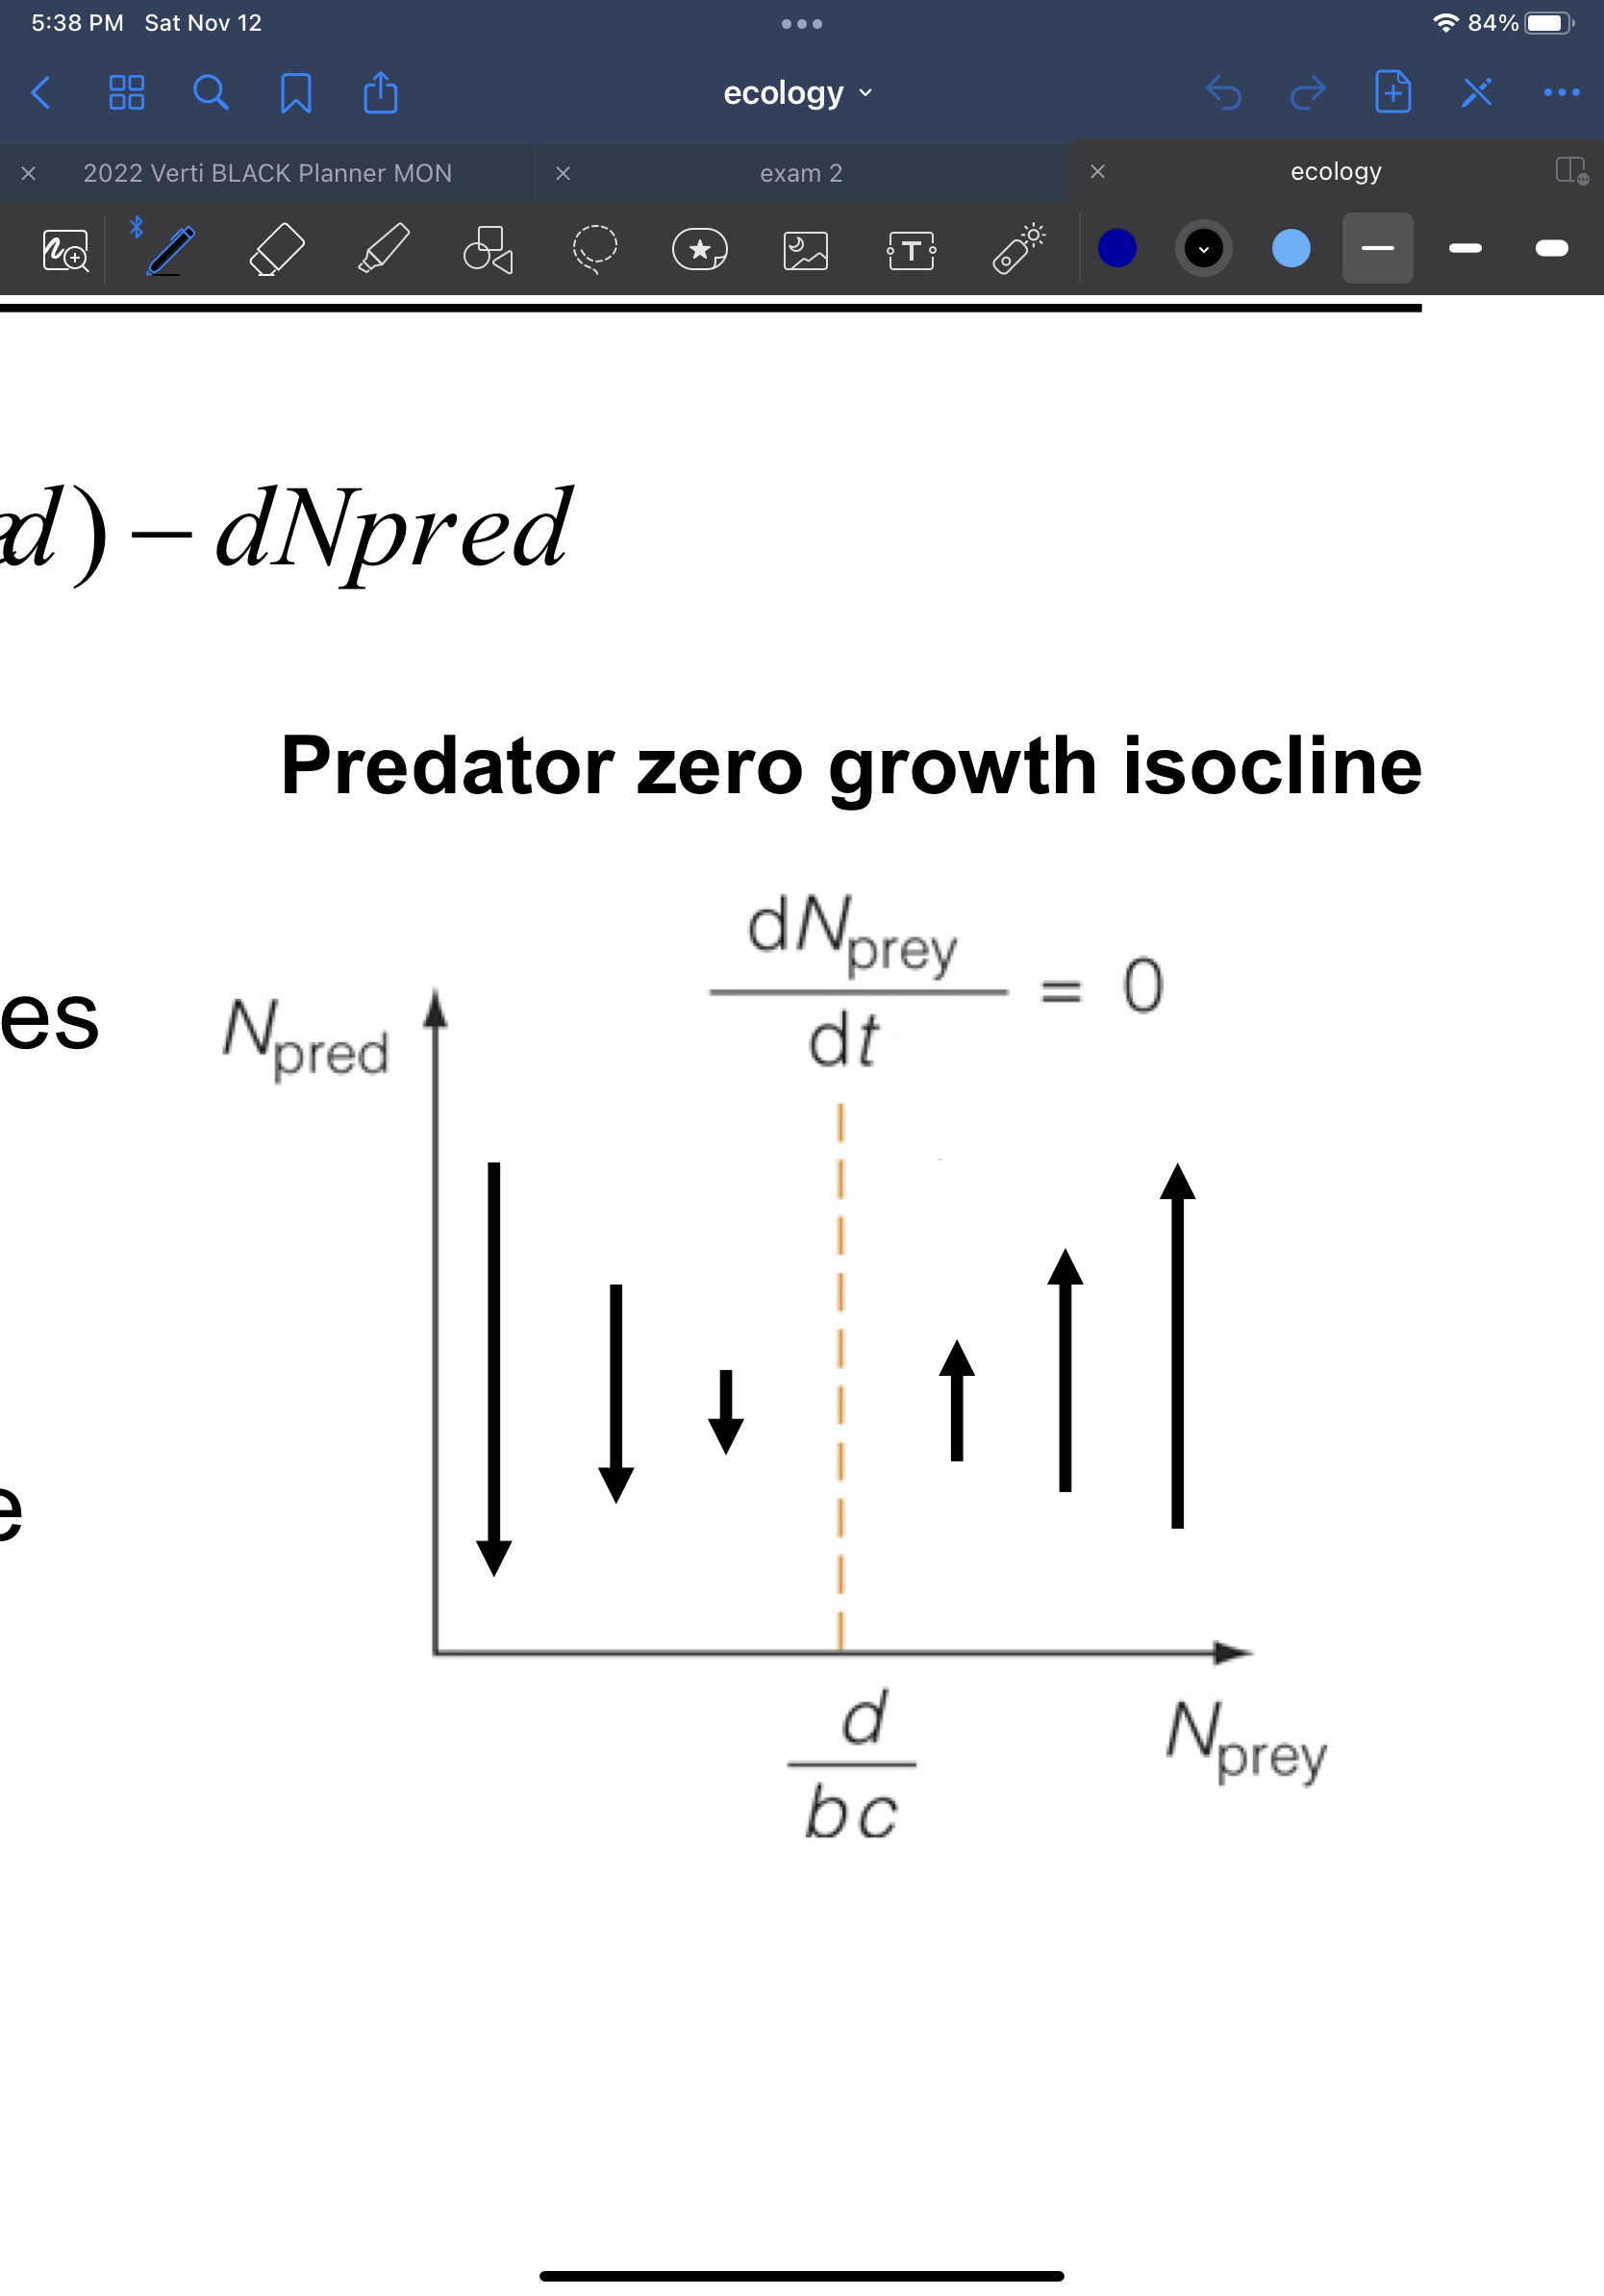
predator zero growth isocline
-prey density zero/low, predator population declines from low birth rate
-growth rate of predator is zero when rate of increase (from consuming prey)= rate of mortality
-growth rate of predator is zero when rate of increase (from consuming prey)= rate of mortality
94
New cards
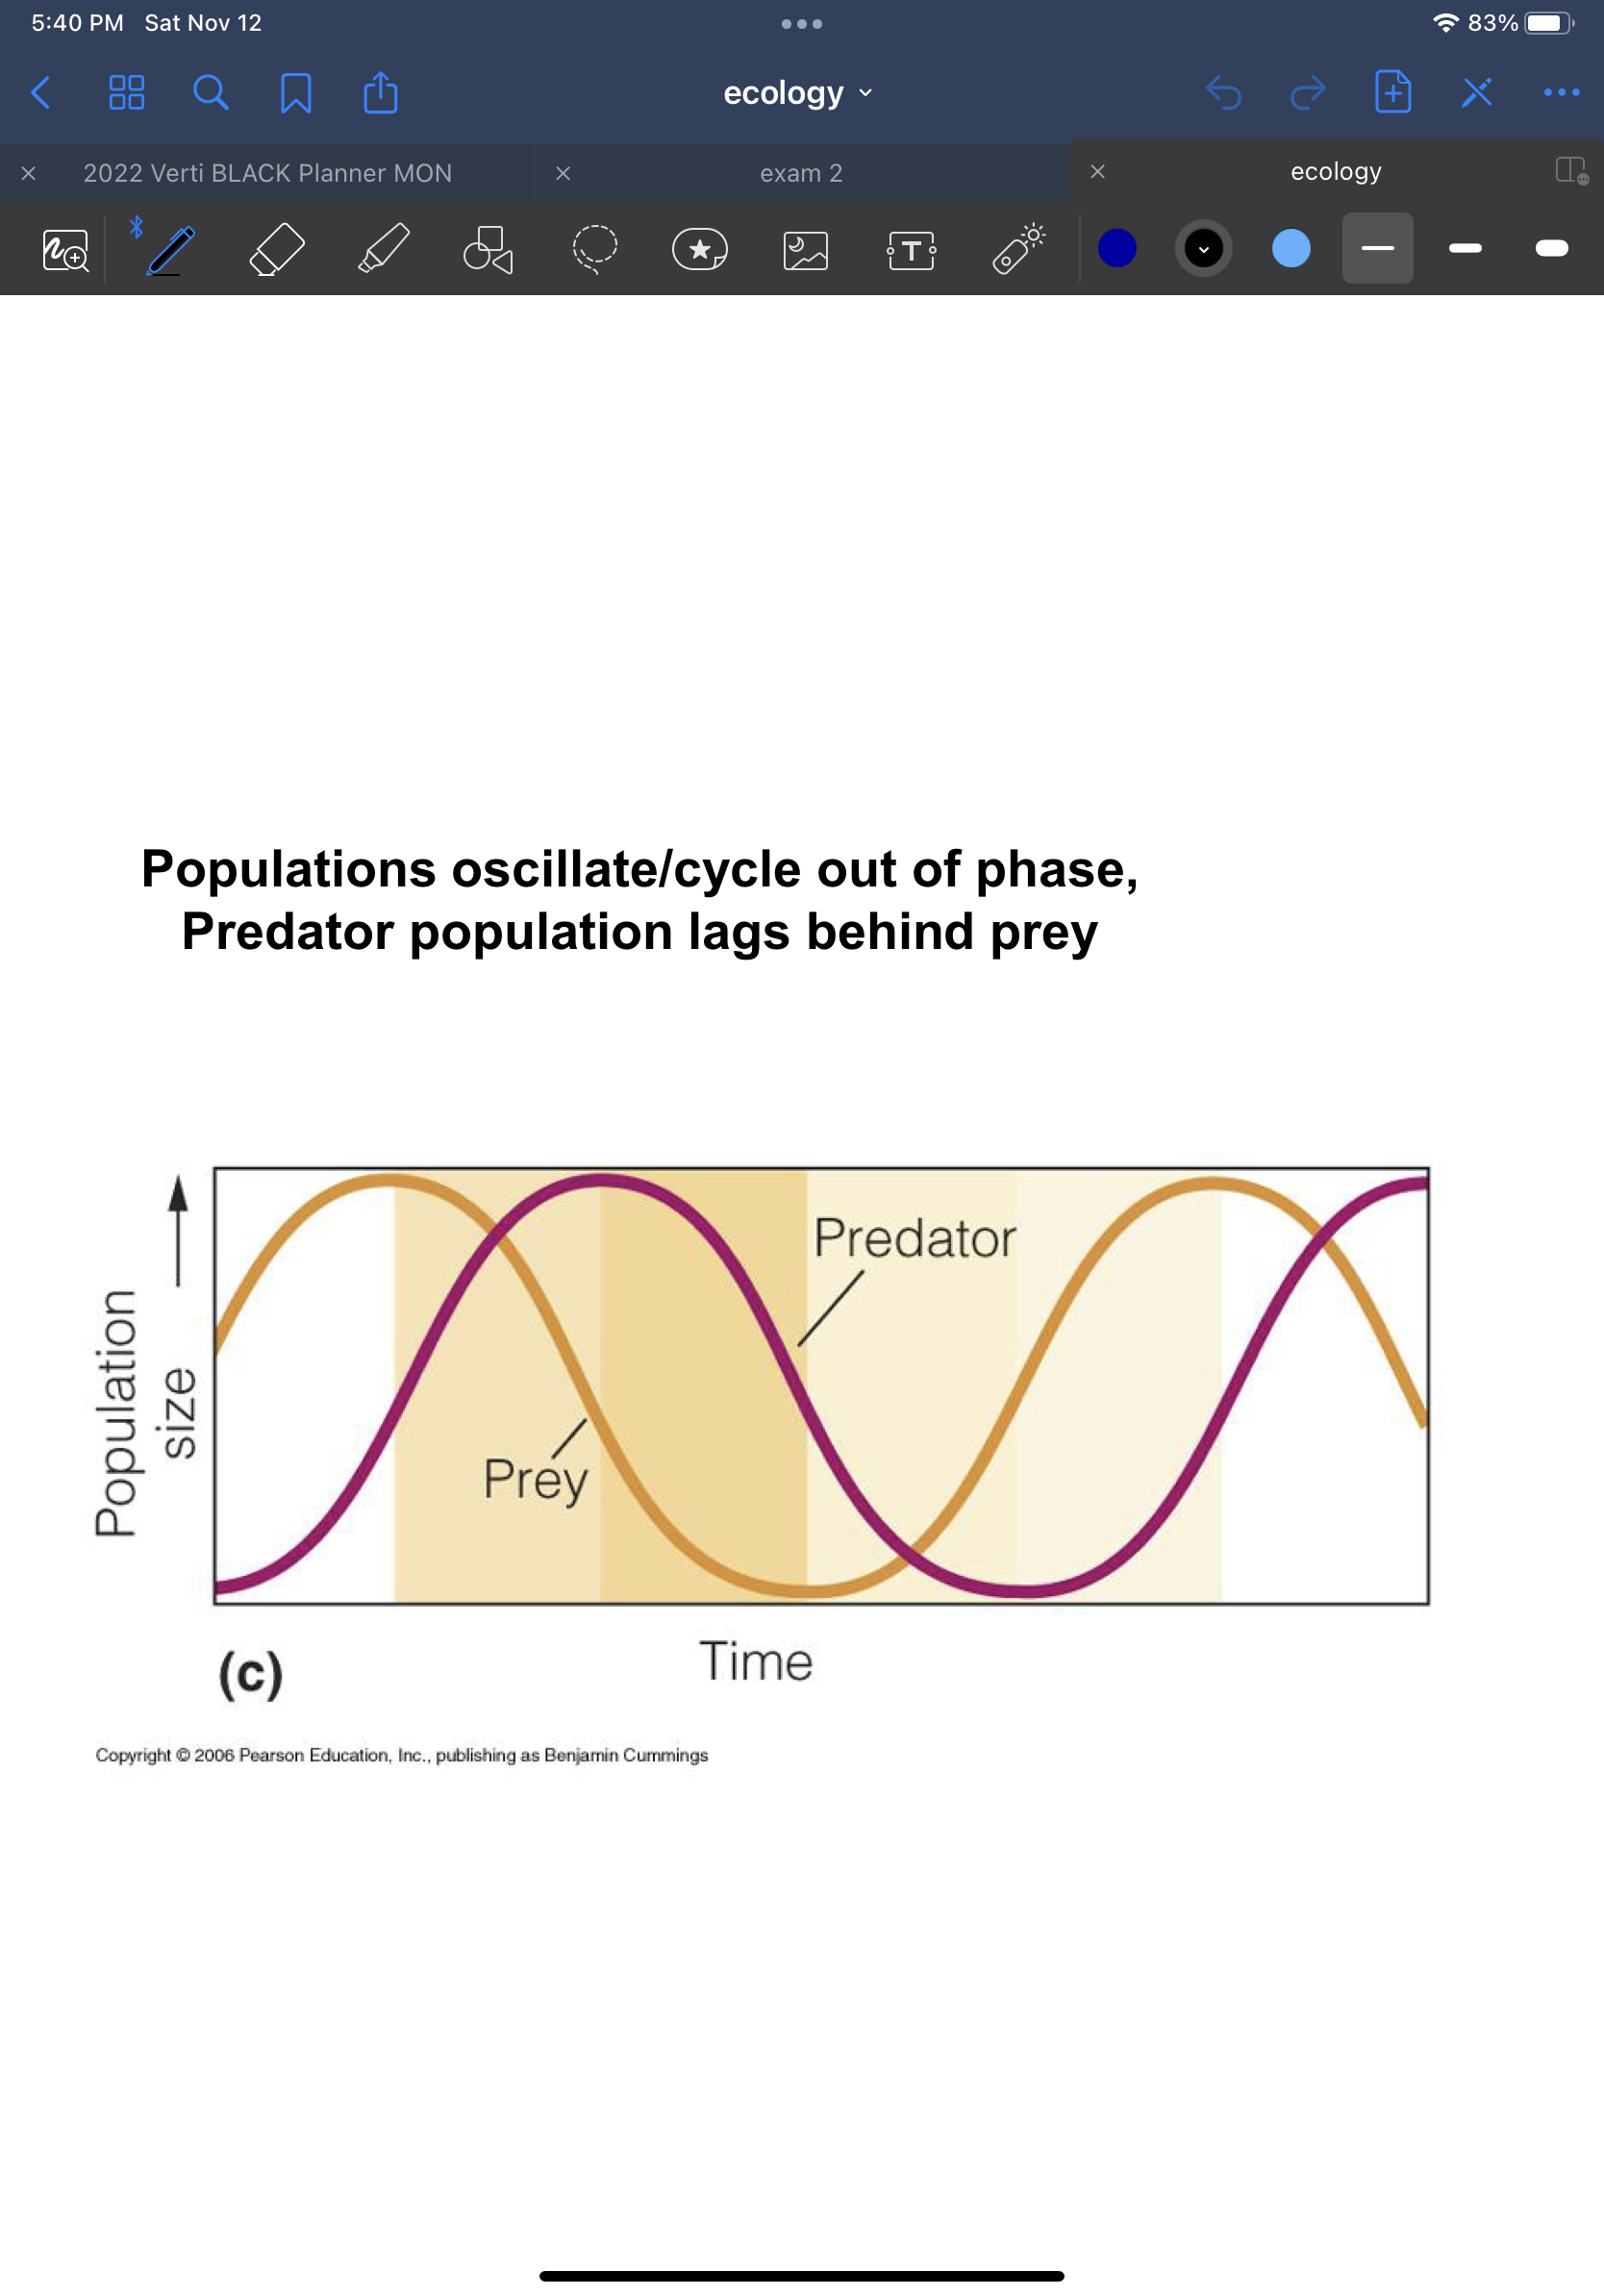
oscillations of prey vs. predator population
-populations oscillate/cycle out of phase
-predator population lags behind prey
-predator population lags behind prey
95
New cards
numerical response
increase in predator population associated with increased consumption of prey
96
New cards
processes of numerical response of predators
1. increased reproduction as rate of prey consumption increases
2. aggregative response as predators move into areas of high prey density
2. aggregative response as predators move into areas of high prey density
97
New cards
functional response
change in per capita rate of consumption as the number of prey fluctuates
98
New cards
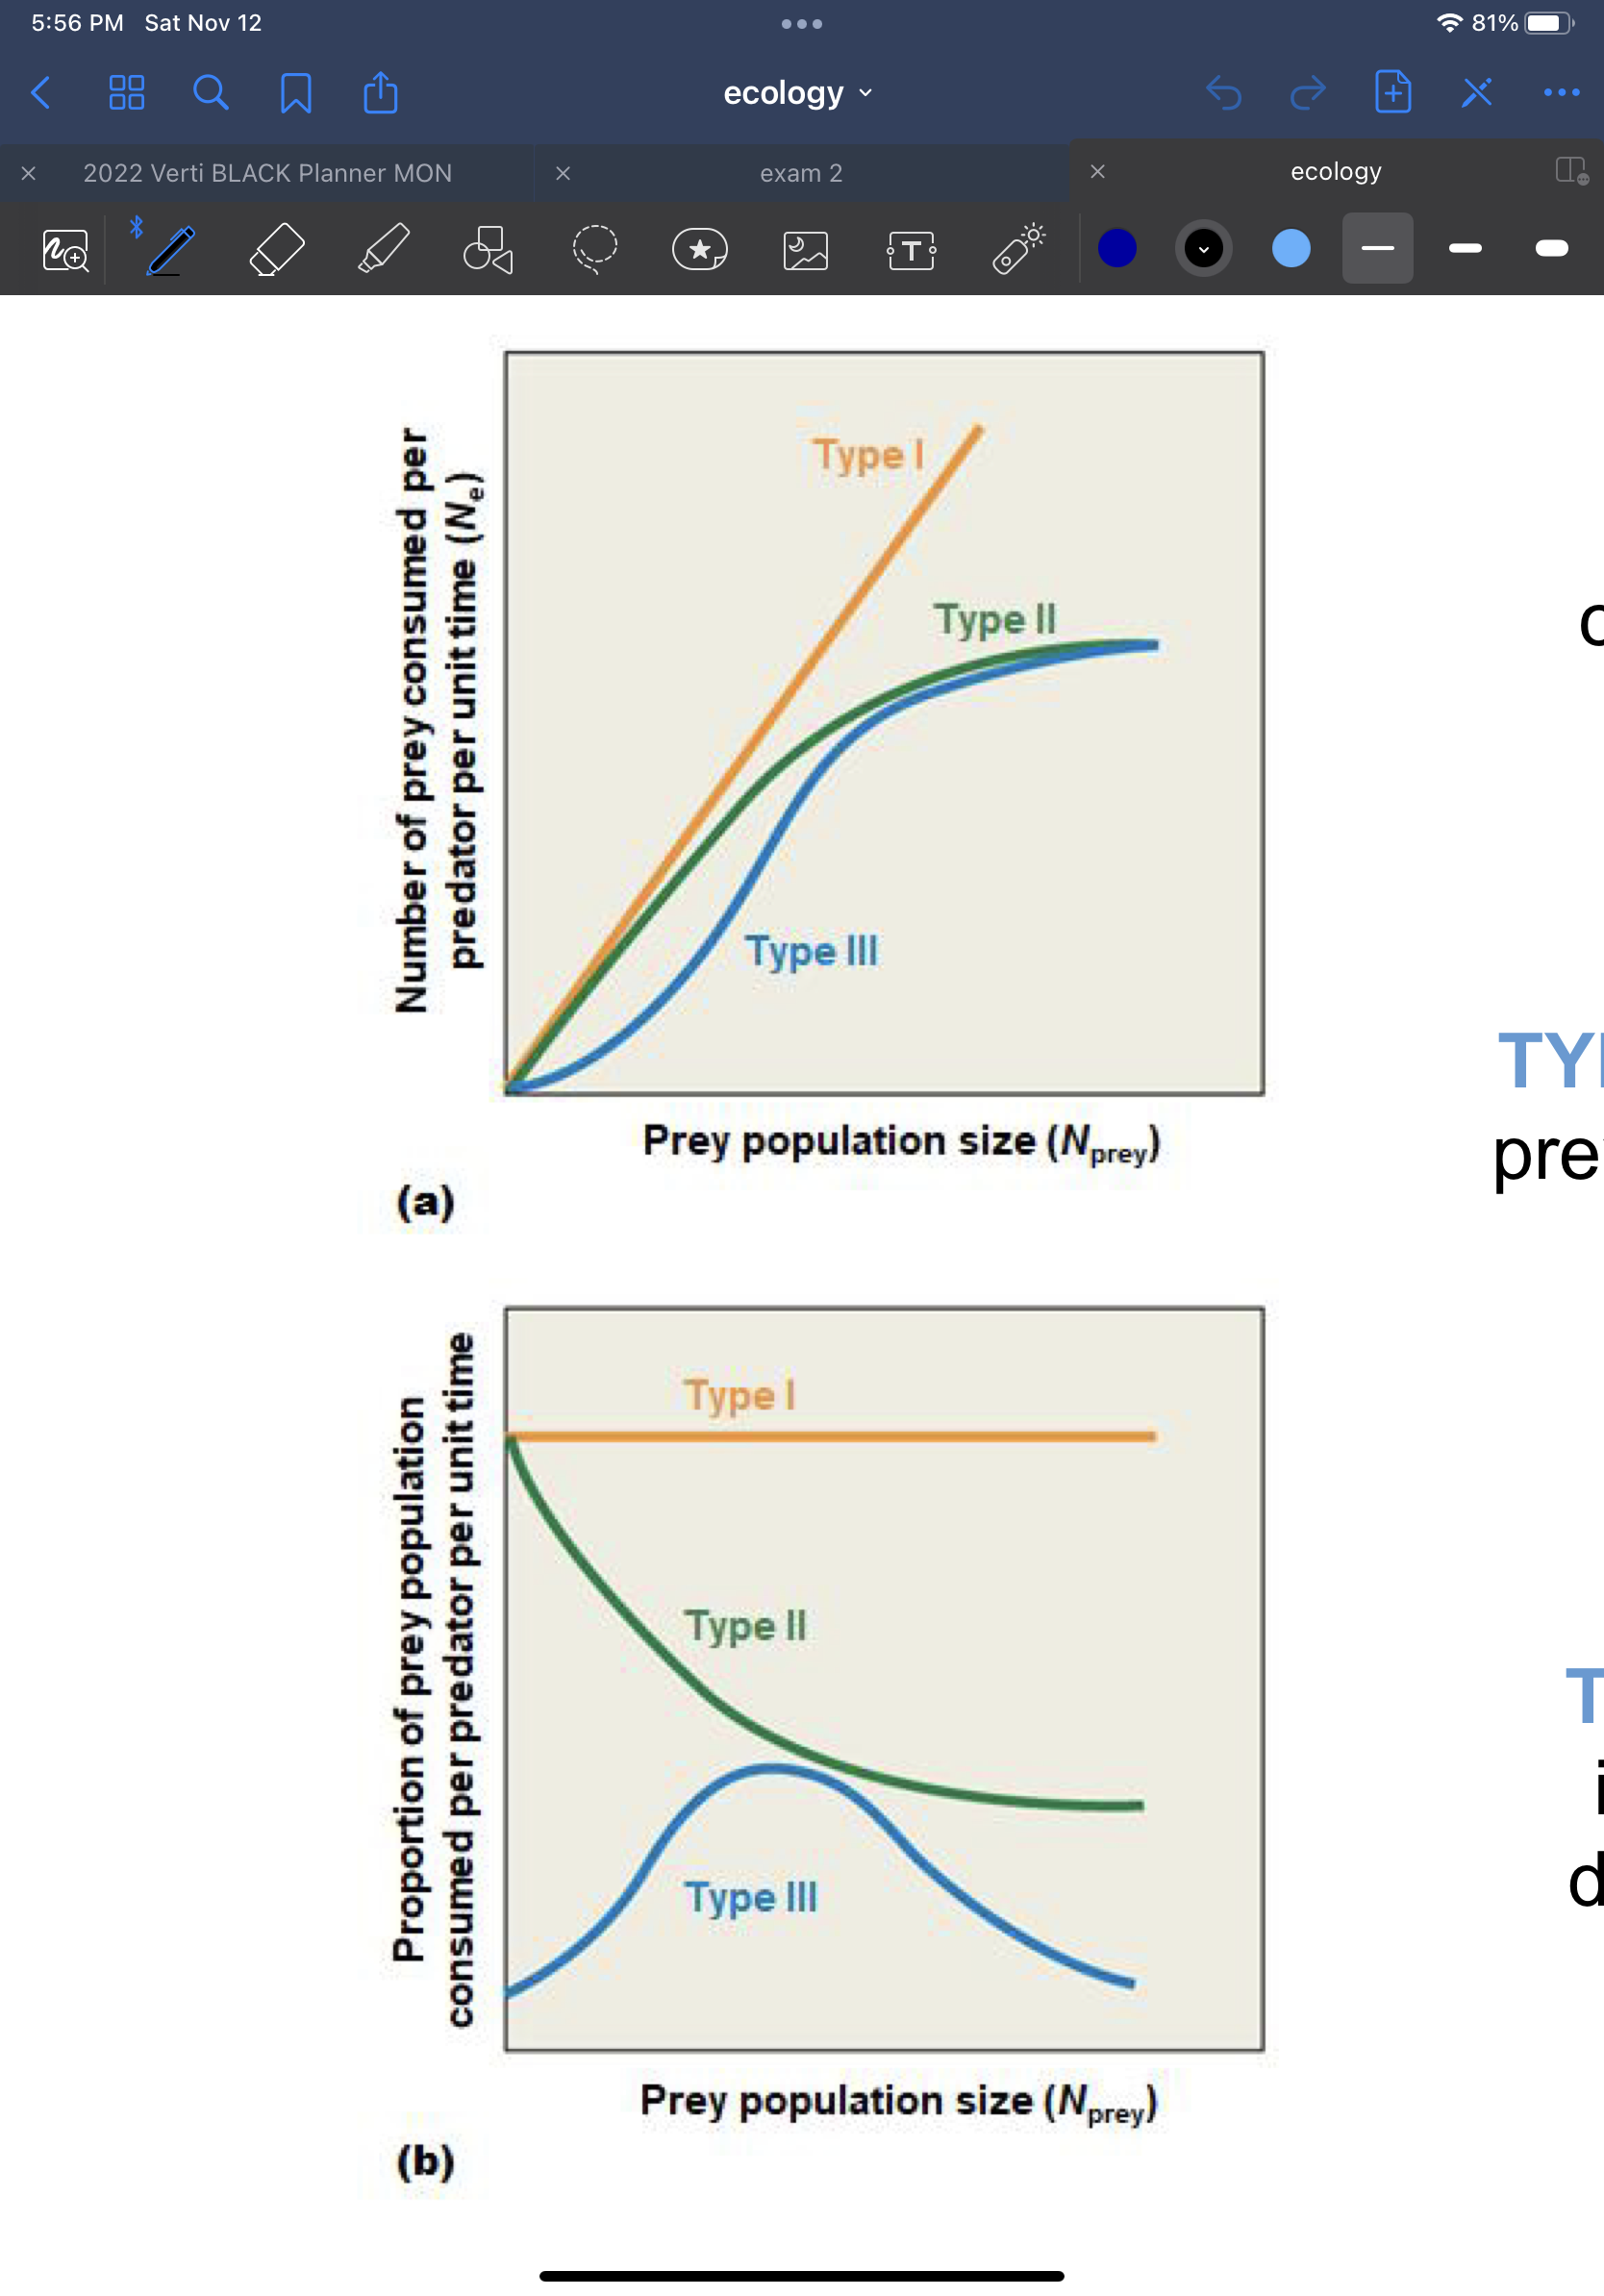
functional response curves
describe the per capita rate of consumption for a predator relative to the number of prey available
99
New cards
classification of functional response curves
-for a predator, time spent foraging is divided into searching time and handling
-allocation of resources to each time component, in part dictates the type of functional response
-allocation of resources to each time component, in part dictates the type of functional response
100
New cards
type 1 functional response
rate of predation is constant
-passive predators (spiders, aquatic filter feeders)
-passive predators (spiders, aquatic filter feeders)