Unit 7 - Population Biology and Impact
1/54
There's no tags or description
Looks like no tags are added yet.
Name | Mastery | Learn | Test | Matching | Spaced |
|---|
No study sessions yet.
55 Terms
What is symbiosis ?
no organism exist in isolation and species interaction involve occasional or indirect contact (predation or competition) or involve close assosciation or symbiosis
ecompasses a variety of interactions involving close species contact . Comselism , paratism , mutualism
effect population density and comunity structure . even allelopathy determine species presence or not
what are symbiotic relationships ?
Symbiotic relationships, or symbiosis, describe close interactions between two different species where one or both organisms benefit from the relationship.
mutualism
initimate association 2 species with advantage to both
Ex: lichen result of a it between fungud and an alga ‘
termites and thier ceelulose digestjng bacteria
EX: ruminants have mutualistic reltioshop with gut microflora where bith iffer advantage
parasitism
exploitative relationship in plants and animals. parasite exploite resource of host for own benefit. host harmed not killed
Ex: tapeworms live in host and attack suckers to host tissues
ticks sucj bodily fluids cause disease to host
EX:
commensalism
one is the commensal which benefits and other is neither harmed or helped
ex: large grouper and remora
anemone shrimp commensal with sea anemone (shrimp gains by being protected from predators by anemone’s tentacles
competition
resources dominated by largest mist agresive , both harmed
hyenas compete for carcass with vultures
fish picking decaying food from teeth of larger fish
mutualism(cleaner fish, grouper)
ringworm in child’s neck growing
parasitism (ringworm,child)
humans planting cabbages tp eat but eaten by slugs
consumption (humans,slugs)
shrimp gets food scraps and protection from sea anemones apear unaffected
comensalism
birds follow antelopes to feed off insects , and antelopes of danger by irds
mutualism
cohesive group benefits
increased protection, from predators, and reduce energy expenditure during movement.
1)stay with group while away from predator 2)without collisions 3)movement aligned
Schools perform hydrodynamic stays always in tight groups and knowing each others movement. = reduce individual capture , cause confusion , more prey to be eaten - (predator satiation), predator detection
Seperate roles like fetting food and looking at predators =many lookouts , driven by individual needs
distance between each and loosely organized =maximiser food intake and home
cooperative interactions
enhances survival like ore accurate migrations, increased outcome of successful kill, risk to individuals decreased and altruistic behavior of disadvantaged taking care of others
population dispersion/distribution patterns
the pattern of distribution or dispersion of the individuals of a population , species behave and how distribution and abundance of environmental resources can affect them
distribution pattern : clumped
animals that I've in family units , insects that live in plants (otters, lions)
distribution pattern : uniform
territorial animals , plants that compete for access to water. (saguaro cacti)
population pattern : random
plants use wind dispersal and solitary animals that are-territorial
population size
smaller population are more at risk of inbreeding , genetic mutation and genetic drift
population density
the # of individuals in a defined area(closely packed) , more likely to encounter aphate and successfully reproduce . however infectious disease can spread .
exponential growth
unlimited resources . Initial lag where start reproducing , in bacterial colonies
logisic growth
limited by natural resources and space , reaches carrying capacity after lag.
seen in all stable populations in fixed area
human population growth
due to industrial revolution the population went from 1 billion . exponential wont last forever increase levels of education lead to lower birth rates . will stabilize
density independent limiting factors
abioctic factors , affect regardless density
natural disasters , severe matter, pollution
density dependent limiting factors
biotic (living) factors . affect depend on density
predation
spread of disease and parasites
competition
intraspecific competition
between members of own species , more intense as same niche
interspecific competition
between members of different species , less intense p
predator -prey cycles
prey population increased due to few predators
predator increase due to high numbers of prey for food
lag period between increase in prey and the increase in predators and takes time for predators to grow and reproduce
Q: How does intraspecific competition affect population growth?
A: It regulates population size by limiting growth as resources become scarce, leading to density-dependent regulation and self-thinning.
Q: How does intraspecific competition influence population distribution?
A: It can lead to evenly spaced individuals (uniform distribution) or clustering in resource-rich areas.
Q: How does interspecific competition impact population growth?
A: It can cause competitive exclusion, reduce population sizes, or lead to niche differentiation to coexist.
Q: How does interspecific competition influence distribution?
A: It causes habitat partitioning and range limitations, with species occupying different niches to reduce competition.
Q: What role does competition play in population regulation?
A: Both intraspecific and interspecific competition are density-dependent factors that regulate growth and distribution.
Q: What is an outcome of strong interspecific competition?
A: One species may dominate, outcompete others, or species may evolve to occupy different niches.
Q: How do species coexist despite competition?
A: Through niche differentiation, where species adapt to utilize different resources or habitats.
Survivorship curves : Type 1
organism tend not to die when they are young or middle aged but instead die when elderly.
small numbers of offspring and provide lots of parental care so offspring survive
Ex: Humans, primates, elephant,
most deaths at old age so before that same survivorship and then drastic change from 80 % of life span so 60 left to 90% life span so 30% left ,
although in 10% of life 99 survivors

Survivorship Curve : Type 2
organisms die more and less equally at each age interval.
Relatively have few offspring and provide significant parental care
Roughly equal deaths at all age , equallly going down by slope of -1 from 100 on y axis
Ex: bird , squirrel
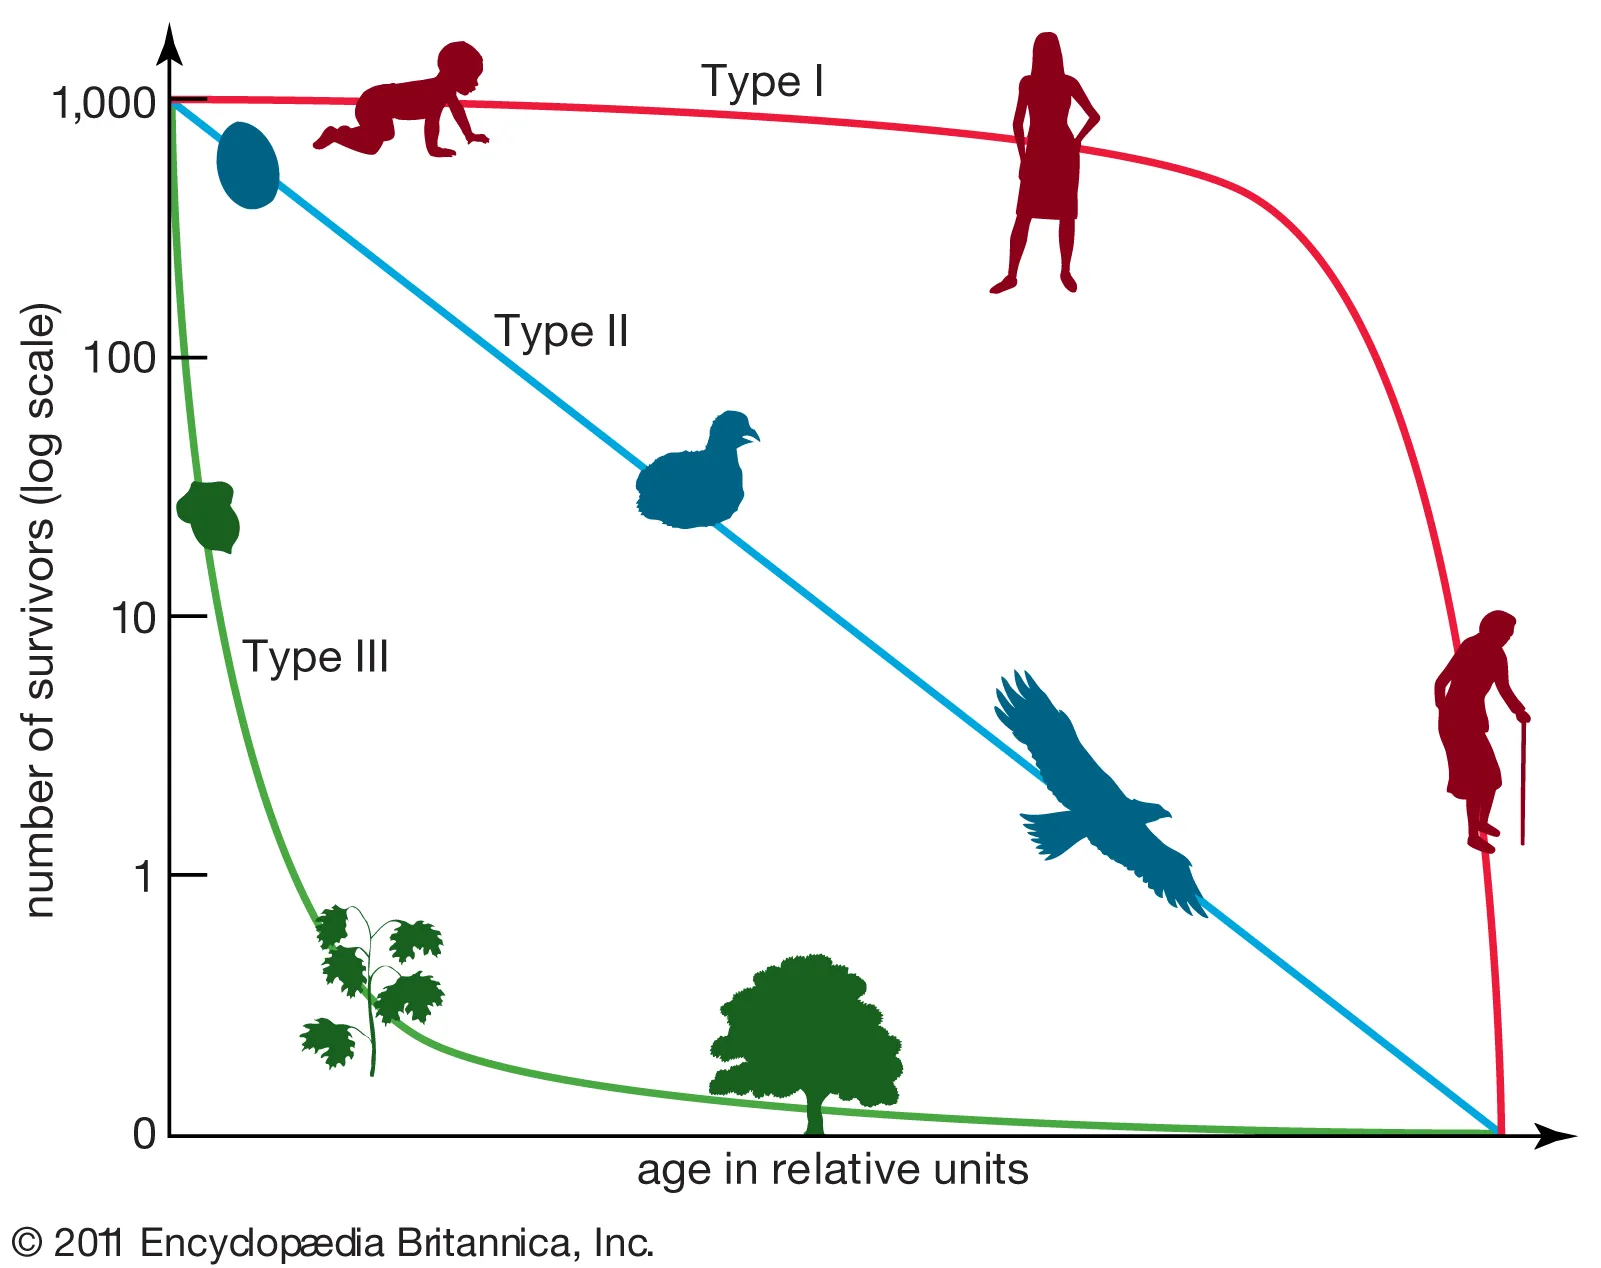
Survivorship Curve : Type 3
few organism survive thier younger years . who make it live long lives.
lots of offspring at once like trees releasing thusands of seeds but not providing much care
ex: trees, marine invertibrates, fish , oyster, frog
lower ranges of survivorship on graph
high infant mortality
predict Potential growth of animals, plants, humans
Thomas Malthus: if populations continue to grow at this rate, eventually there wouldn’t be enough resources to provide for everyone.
More true for plants , animals as produce far more offspring than humans can ,
played role in theory of natural selection
reasons for seed count variation
type 3 as fruit have many seeds and few survive young age but some that make it live ling lives.
has lots of offspring like blackberry having 98.5 at once
tomatoes grow vs peaches : seed count variation for reproduction strategy
tomatoes : produce soft berries with single season. any seeds as flowers have multiple ovules so many seeds
Peach: on trees that take years to mature and bear large fuits . Onle have one seed as flower has single ovule and protected inside a hard stone
seeds and mass of fruits
Corn: 353, 245.6
pepper: 25
blackberry: 98.5
tomato : 68
r selected species
high growth rate but low survivebility (“cheap” offspring)
k reelected species
low growth rate but high survivebility (“expensive “ offspring )
r selected characteristics
common in unstable enviorments
many offspring per reproduction event
little parental care
high rate of infant mortality
small body size
short development span(early maturity )
population size is variable (highly fluctuating)
k selected characteristics
stable/predictable enviorments
few offspring per brood
high parental care
low infant mortality
large body
long development span (late onset of muturity)
population size typically stable (reaches carrying capacity)
why difficult to determine k or r
represent 2 ends of extreme in reality
as organisms show intermediate strategy somewhere along spectrum (type 2)
some species may change their selection strategy according to environmental condition
ex: oyster in one extreme 500 million a year , to frog of 200 a yr in middle to chimpanzee on other extreme of 1 every 5 years
species richness
number of unique species that are present , but does not include the number of individuals within those groups
abundance
number of individuals present in each group relative to the total number of indivudius . Abundance calculated by dividing number of individuals by the total number for all groups
equation of relative abundance
of indivuals in group / total # of individuals in all groups *(100)
biodiversity index equation
# of individuals in group/
total # of individuals in all groups
calucltuate the biodiversity index with bean lab
diff types of beans / total # of beans
how bean lab works
species of the taxa and you find its number of Texas or see the differentbrands and fins how many of each are there
then you find the relative abundance after adding all the number of beans, that to be divided to number of beans times 100 to find percentage
biodiversity by total of species of beans divided by total number of beans
which is lowest community
community 3
biodiversity is helpfully cause ?
it is more resilient to changes
how biodiversity indexx used by scientists
health of ecosystem by measuringfg and monitoring it to find normal state
track changes over time with relative abundance
and finsing biodiversity and richness of communities
an area with many speeches would be very rich because of different roles they play in community