Module 7: Chi-Square
1/59
There's no tags or description
Looks like no tags are added yet.
Name | Mastery | Learn | Test | Matching | Spaced | Call with Kai |
|---|
No analytics yet
Send a link to your students to track their progress
60 Terms
What are the 2 types of chi-square tests, and their alternate names?
One-way chi square (Goodness of Fit)
Two-way chi square (Test of independence)
What is the goodness of fit test?
One-way chi square
What is the test of independence?
Two-way chi square
What type of data does do chi square analyse?
Categorical, frequency data.
Think: 10 Girls and 5 Boys
Chi square allows us to test research questions with…
Categorical data
How is categorical data scored?
Using frequencies
Frequency data
The number of sampling units in each classification.
Think: Eye colour breakdown in a class
What test would be used to test this RQ?
“Are people/things distributed evenly across the categories of the variable?”
One way chi square
What do chi-square analyses tell us?
The expected likelihood of something happening and comparing it with observed frequencies
Think: Did we actually get what we were expecting?
Tells you how well the expected and observed frequencies match
Think: In a cohort of psych students, we expect there to be 90 girls and 10 boys. In the 2024 cohort there are 78 girls and 15 boys. To what extent do these match? Do these results fit the expected results?
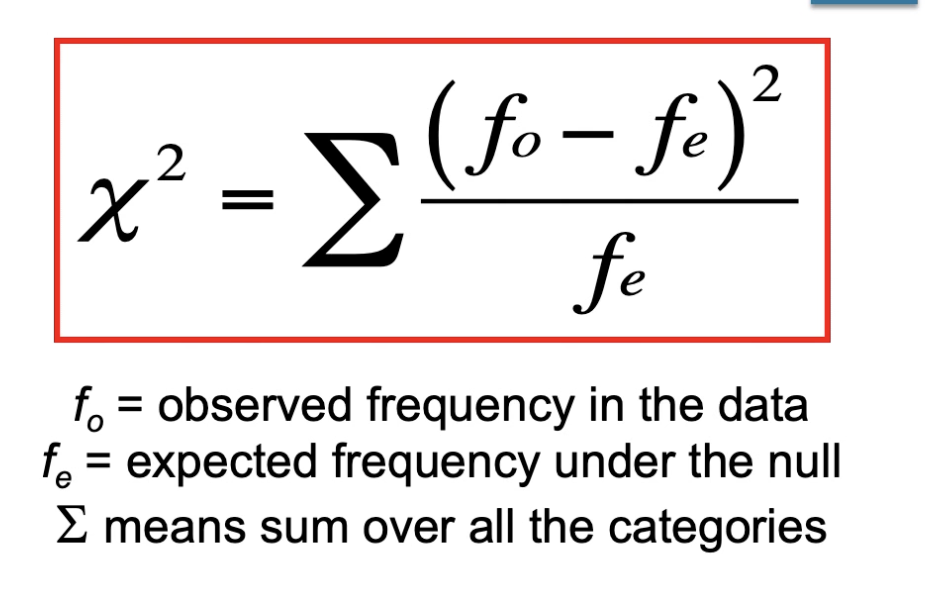
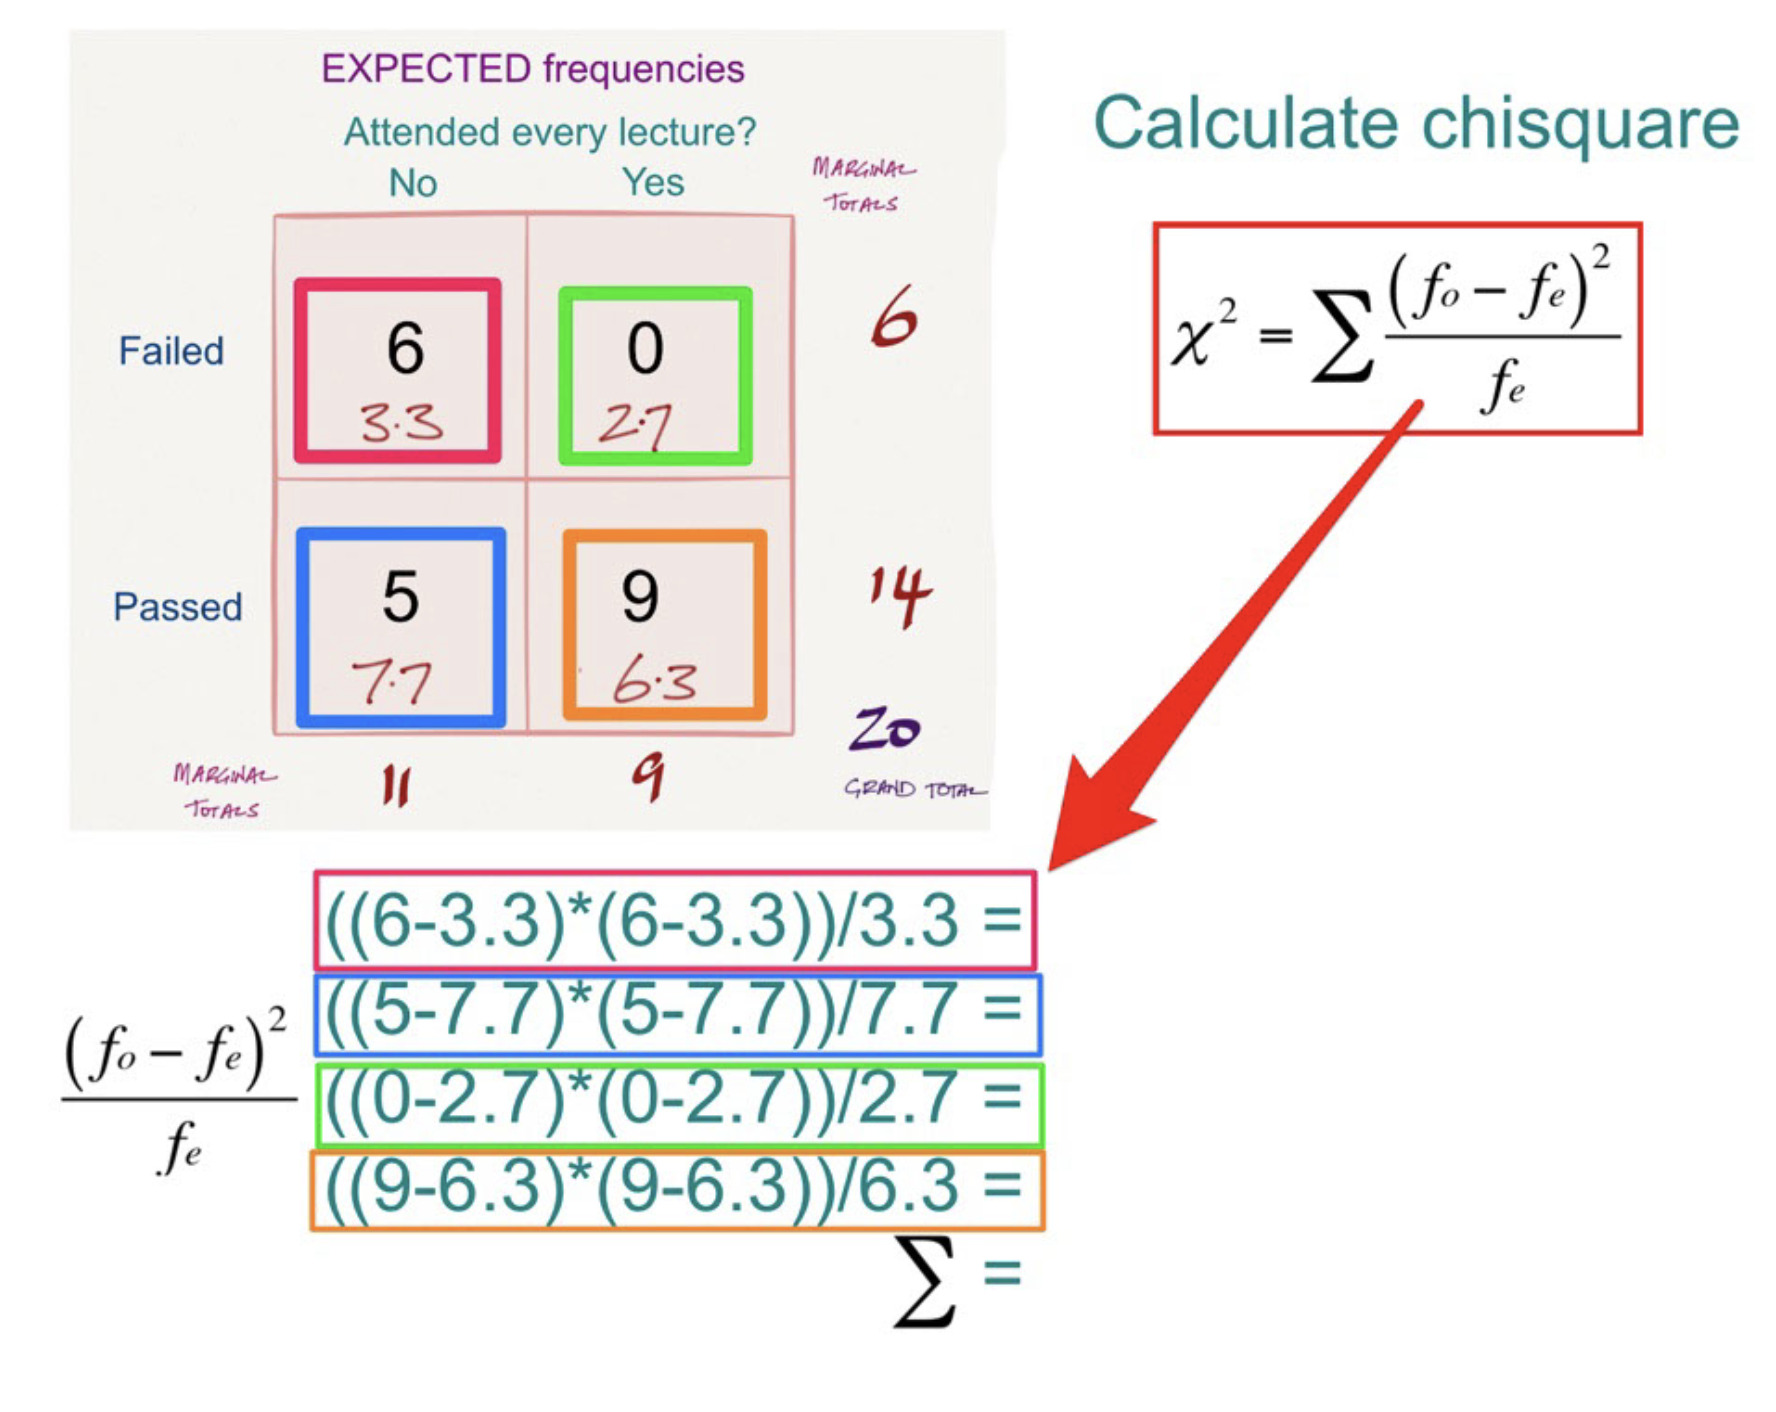
Chi-square formula
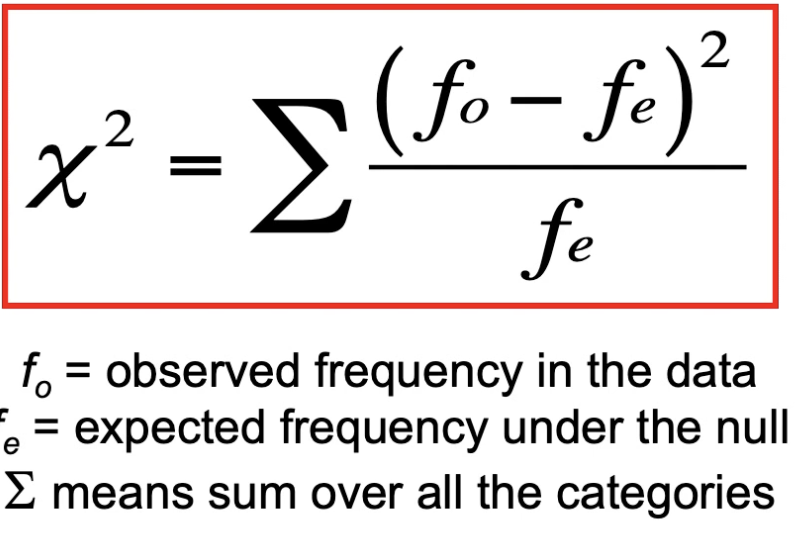
What is the basic idea of the chi-square formula?
X2 will be small if differences between f0 and fe are small
If 284 people were asked what their favourite chupa chup flavour is, what question might we ask that would make a one-way chi square test appropriate?
Are people distributed evenly across the levels of chupa chup flavour preference, or are some flavours more popular than others?
If 284 people were asked what their favourite chupa chup flavour is, what outcome would mean the null hypothesis of a one way chi-square test was accepted?
The preferences of flavours were evenly distributed across the levels, and there was no significant difference to expected values. There was no significant difference between flavour preference. All were equally preferred.
What is meant by equiprobable distribution in a chi-square test?
Uniformly distributed - no significant difference in frequencies across all levels of the construct
Think: There is no super popular/unpopular chupa chup flavour.
fo
Observed frequency
fe
Expected frequency
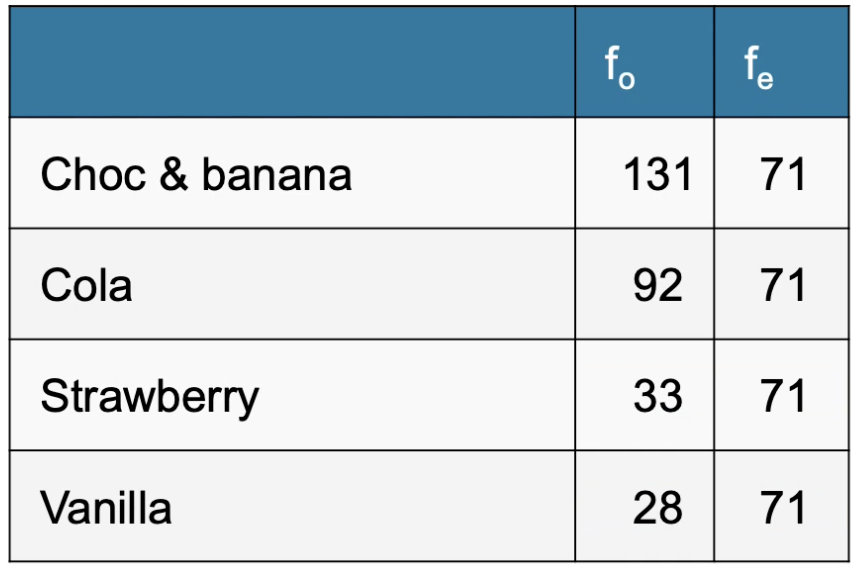
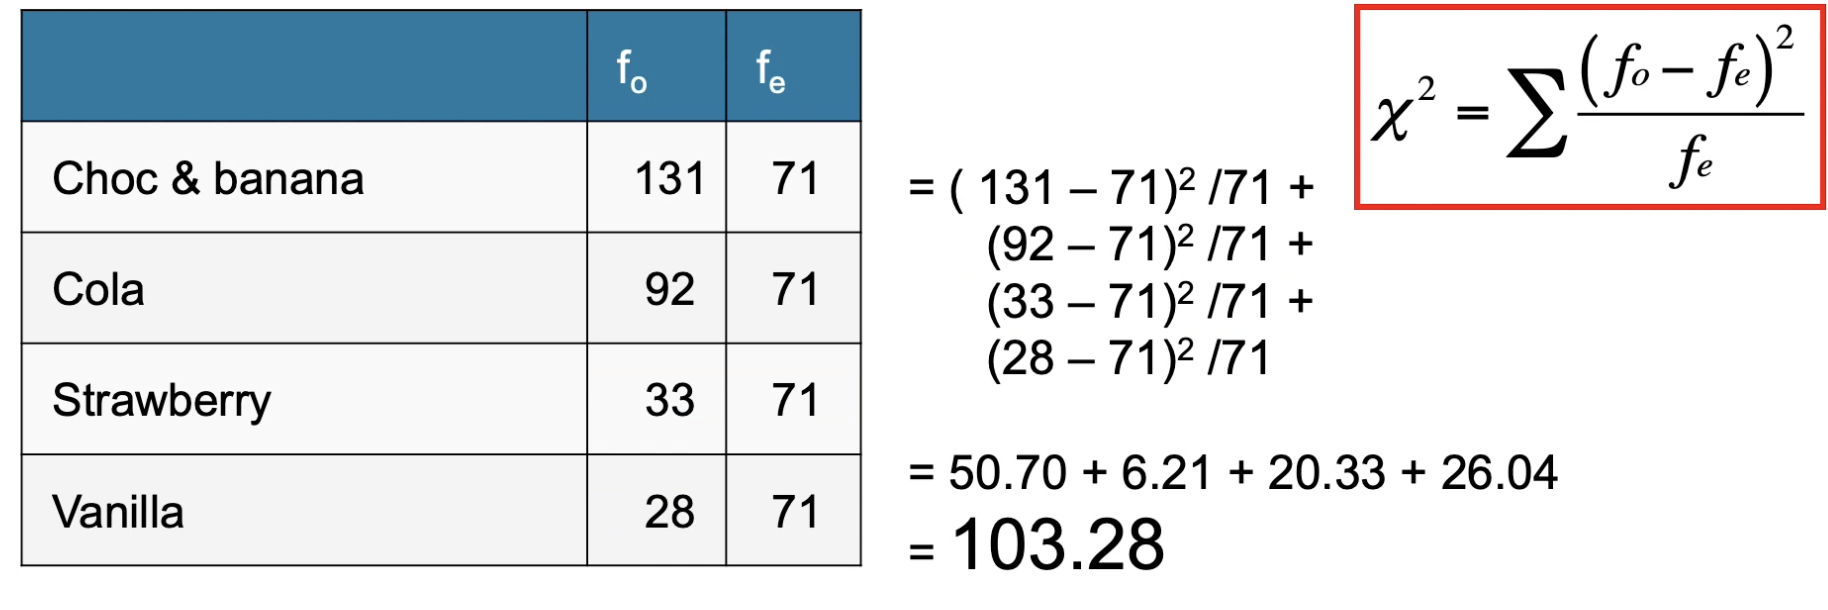
Calculate X2
When do you reject the null hypothesis in a chi square test?
When p < 0.05
The observed scores are significantly different from the expected scores (expected that there would be a equiprobable distribution)
X2 is a family of distributions dependent on..
degrees of freedom
How do you calculate df in a chi-square
df = k - 1
df is based on number of cells/categories, not number of participants (n)
What does a negative X2 statistic suggest?
Impossible - They are always positive
How can you increase the obtained chi-square?
Increase the sample size
What happens to the critical X2 value when you increase the sample size? Why?
It stays the same
Because df in chi-square are based on number of categories not the number of participants, so when you increase the sample size it has no impact on the df formula of k-1
Remember that df are used to find a critical value in a lookup table, and when you match them, the critical value is a cutoff to determine whether an observed value is significant or not.
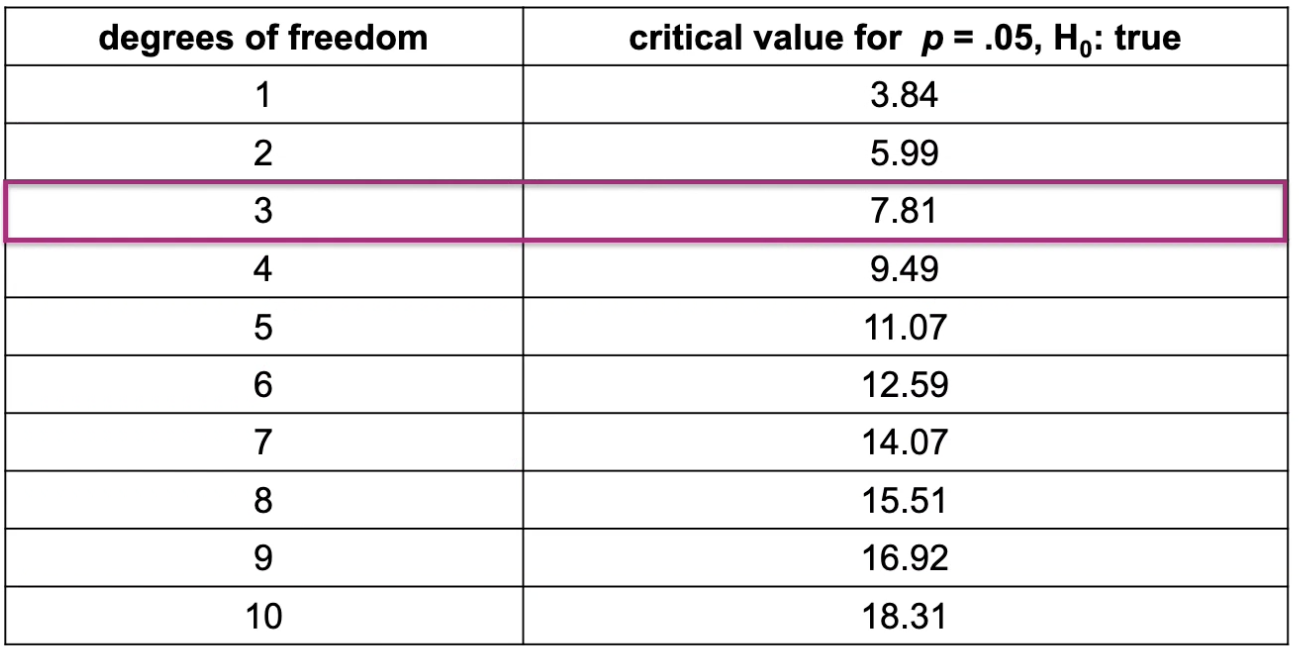
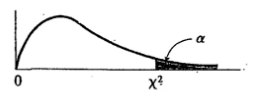
Critical value
Value that marks .05 region under the null
In studies using chi square, what do we only need the critical value of X2 for?
Degrees of freedom
The df we calculate is used to match up with a critical value in a table that is used as a cutoff.
If the obtained X2 value is larger than the critical X2 value in a one-way chi squared, what do we conclude?
There is a significant difference. The sample is not consistent with a population in which units are distributed evenly across categories.
Think: There is a clear most popular chupa chup.
If the obtained X2 value is smaller than the critical X2 value in a one-way chi squared, what do we conclude?
The null hypothesis is accepted and it is concluded that there is an equiprobable distribution across categories.
Think: People like the flavours of chupa chups equally (WRONG BECAUSE STRAWBERRY IS SUPERIOR)
If you were using a chi square test to demonstrate that you had a similar number of men and women in your study, would you want to accept or reject the null?
Accept - you want equal distribution
One-way chi square means..
Only 1 variable (can have multiple levels though)
Two-way chi square means
Has 2 variables (each can have multiple levels)
2 Alternate names for two-way chi square
Test of independence
Contingency chi square
What test would you use when the research question is asking if there is an association between 2 categorical variables?
Two-way chi square
In a two-way chi square, what does the null hypothesis state?
There is no association between the two variables.
How many sets of frequencies do you need for a two-way chi square test and what are they?
The observed frequencies in your dataset
The expected frequencies under the null
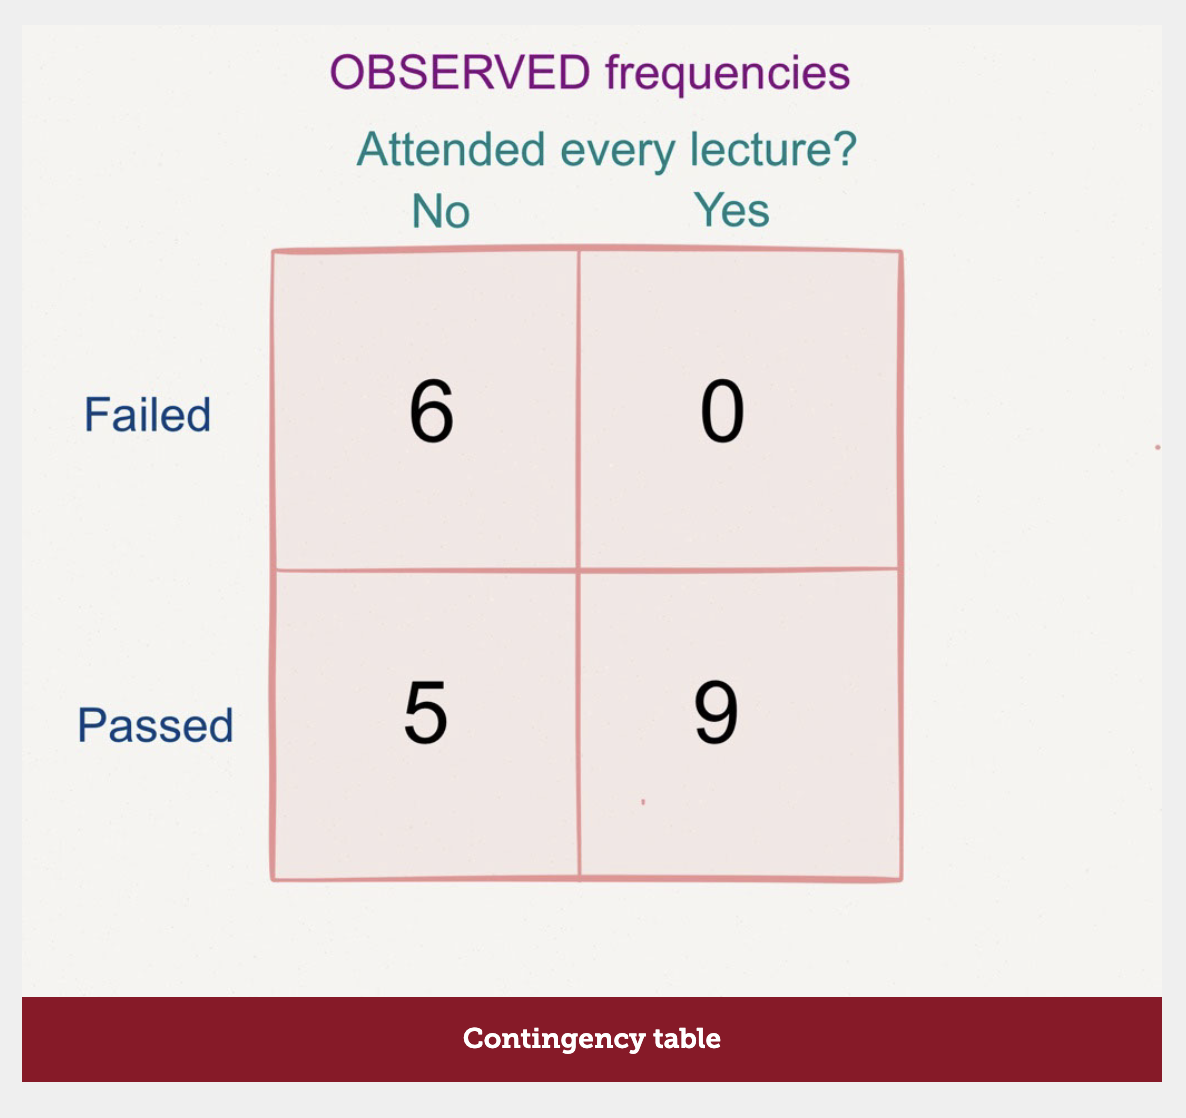
Contingency table
Table of observed frequencies across the 2 variables in a two-way chi square›
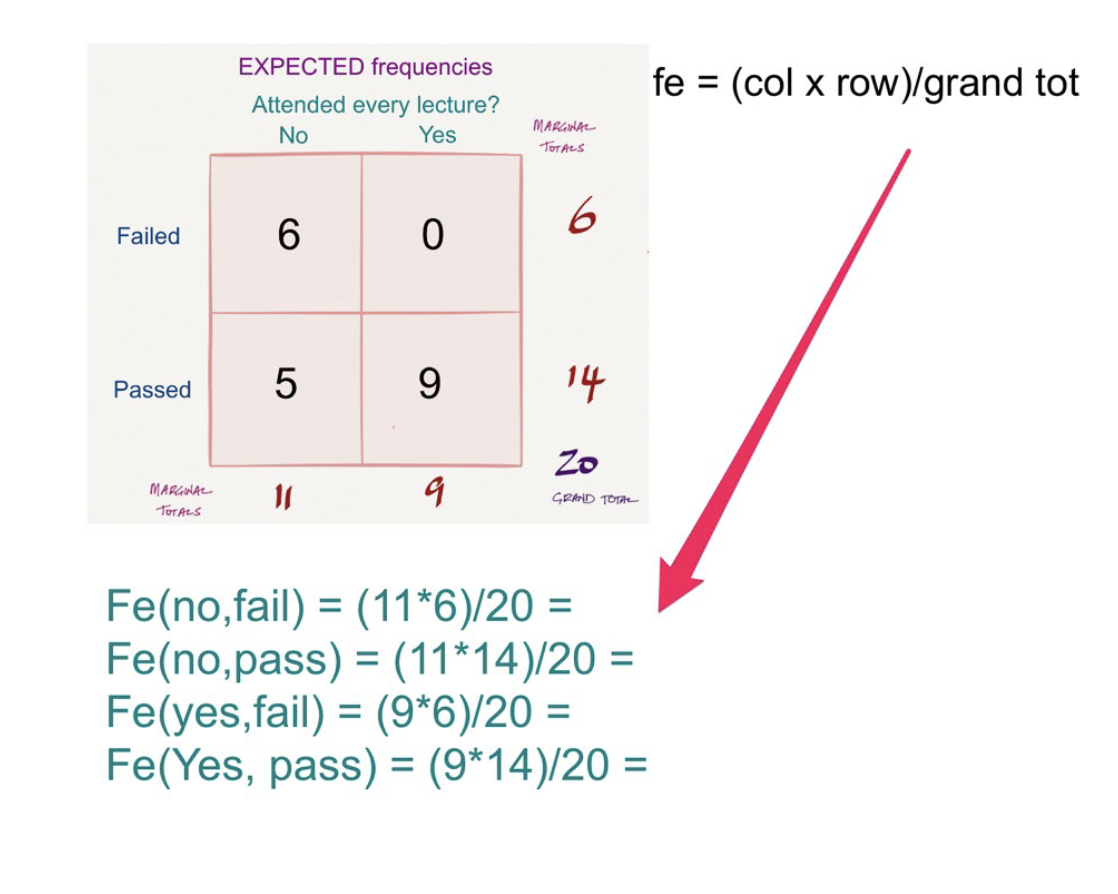
How do you calculate expected frequencies in a two-way chi square?
Find the marginal totals by adding the rows and columns, and the grand total by finding the sum of all row and column totals.
Multiply every column by every row and divide by the grand total.
Put the answer in respective cells.
How do you calculate chi-square in a two way chi square?
Input the observed and expected values into the formula for each cell and find the total.
How do you calculate df in a two-way chi square?
df = (number of rows -1) x (number of columns -1)
What do we conclude when our observed X2 is greater than the critical X2 in a two way chi square?
The null hypothesis can be rejected as there is a significant association between the variables.
Which column in SPSS do we look under to find the significance of the two-way chi square?
Asymp. Sig. (2-sided)
What are the assumptions of chi square?
Independence of observations
Expected frequencies should be greater than 5
Inclusion of non-occurrences
Are chi square analyses used for independent measures or repeated measures designs?
Independent because an assumption is independence of observations.
Expected frequencies in chi square should be greater than…
5
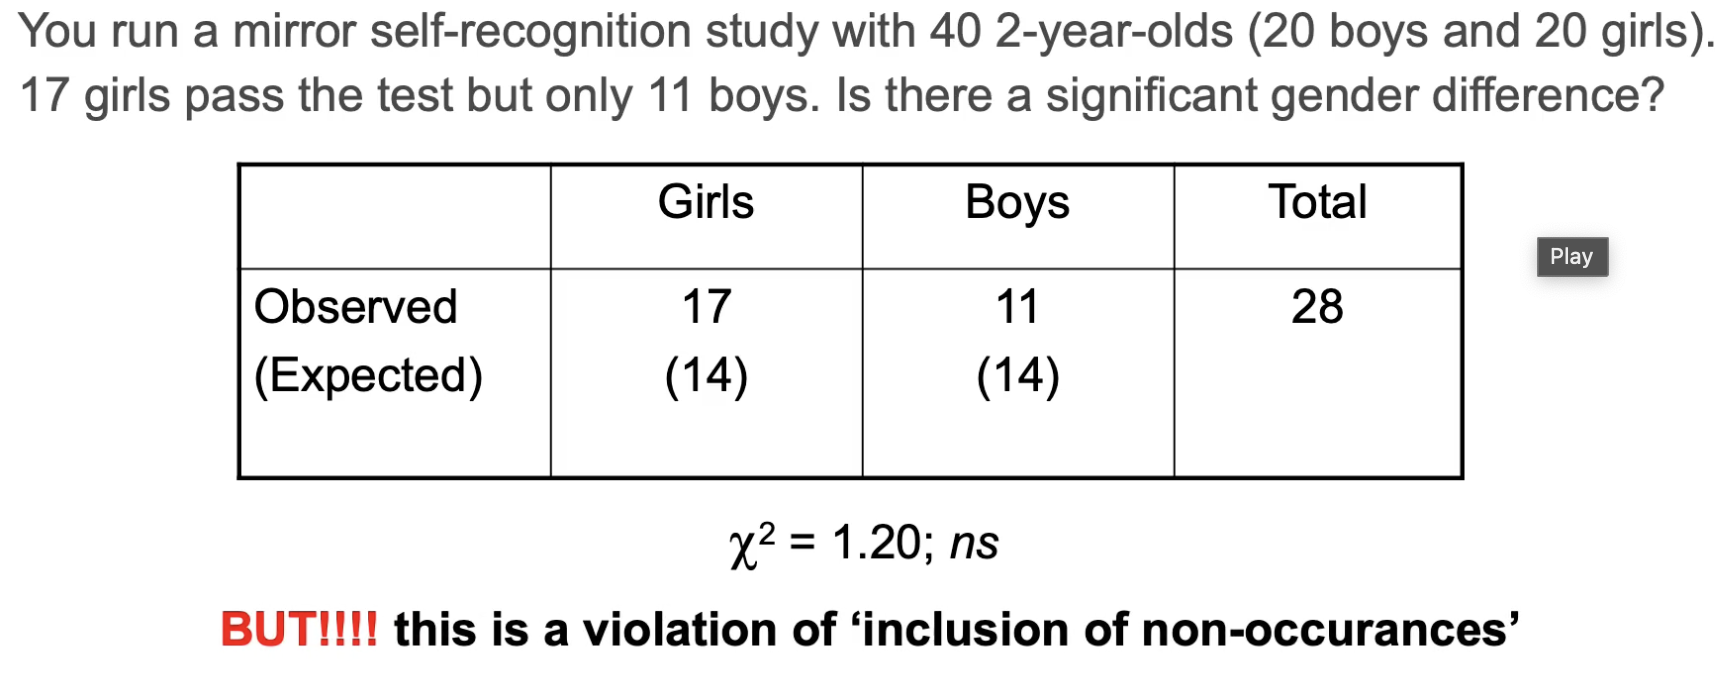
What does inclusion of non-occurences mean?
All the data must be included in the analysis
Limitations of chi square
Limited to one or two variables
Extremely sensitive to sample size
What happens if you double the sample size in a chi square?
The X2 value also doubles, but the critical value stays the same.
What is the null hypothesis for a two-way chi square?
The two variables are distributed independently (not associated)
They do not depend on each other
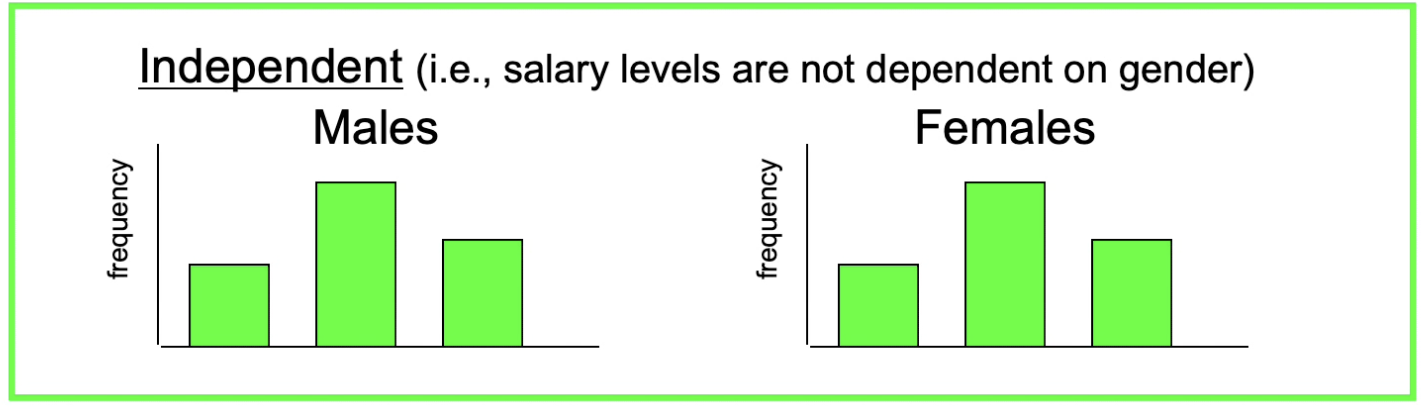
Two variables are considered to be independent when the frequency distribution for one variable has the __________ for all levels of the second variable.
same shape
Think: This shows that salary and gender are independent. If the null wasn’t supported or actually reflected real life, the male figure would be negatively skewed, and the female would be positively skewed.
Think: Independent→indifferent
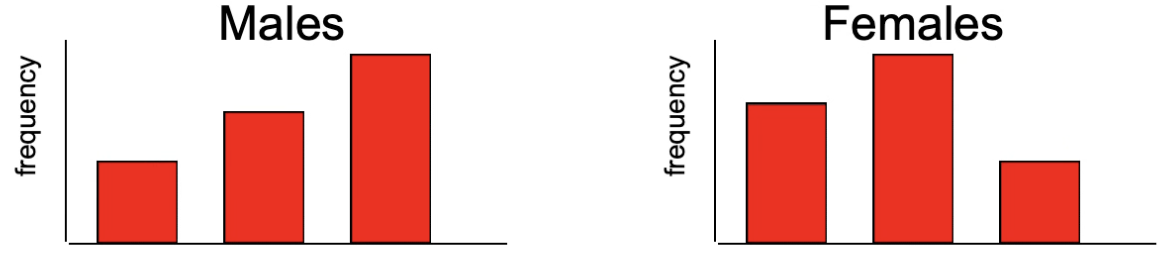
Are these variables independent or dependent?
Dependent - shapes are different
Think: Dependent→different
What is the model in a chi square?
The expected frequencies
If we only focus on the marginals in a two-way chi square , what perspective are we viewing the data from?
The null hypothesis because they are the frequencies not influenced by the other variables.
Think: In this case, 6 people failed the exam REGARDLESS of their attendance.
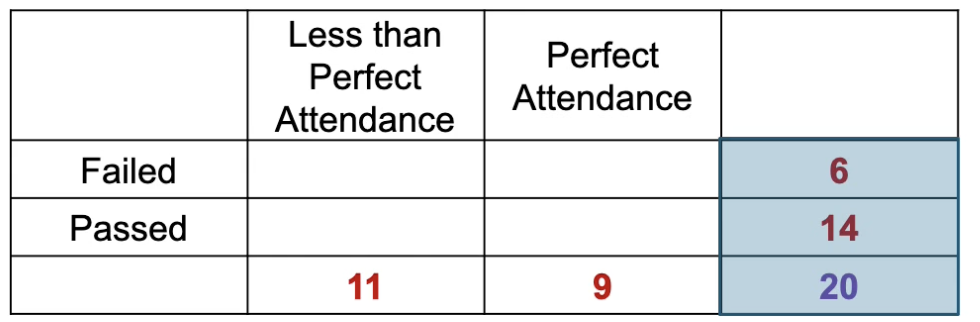
20 people took an exam and we measured their attendance to tutorials (perfect/not perfect) and their mark (pass/fail). Looking at the marginal scores, 70% passed and 30% failed regardless of their attendance.
If the null hypothesis was true (they are independent/not associated), what would the relative proportions of pass/fail scores be in each attendance condition?
70% of those with perfect attendance would pass and 30% would fail
and
30% of those with less than perfect attendance would pass and 30% would fail.
Think: The shape of the frequency distributions would be the same if they were independent.
Why should expected frequencies be greater than 5?
Because small expected frequencies produce few possible values of chi-square obtained, but we compare to a continuous distribution
Describe what inclusion of non-occurances means
If you have a variable with multiple levels, you need to include data for all levels.
Think: If you were comparing girls and boys marks on a test, where the results were pass or fail, you can’t just see if there is a significant gender difference for those who passed. You also need to include the ones who failed because otherwise it doesn’t tell the whole story and can influence the significance of the chi square.
True or False: A significant X2 does not indicate the strength of the relationship
True
What is Phi?
Denotes the strength of the correlation or association between two dichotomous variables (2×2) in a chi square
Interpreted same as Pearson’s r
If chi square is significant, so is chi
Is Phi a measure of effect size?
No - but it is interpreted with the same conventions as Cohen’s D
I.e. phi = 0.50, there is a moderate level of association between the two variables.
How can you get % variance explained?
Phi squared
What has more statistical power when assumptions are met: Pearson’s r or phi?
Pearson’s r because it is parametric
What is Cramer’s Phi?
Generalisation of phi to (row)x(column) tables
Phi can only be used for 2×2 chi squares but Cramer’s Phi can be used for more
Interpret the same as phi
Think: You’re cramming more in