Classification of stars - temperature and black body radiation
1/10
Earn XP
Description and Tags
A-level AQA physics options astrophysics. CH2
Name | Mastery | Learn | Test | Matching | Spaced | Call with Kai | Chat |
|---|
No analytics yet
Send a link to your students to track their progress
11 Terms
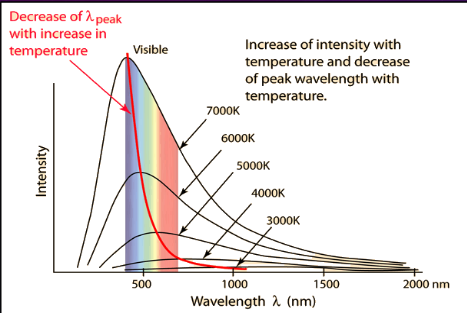
Observations made from the black body curve graph
stars emit all wavelengths of light
Each curve on the graph shows the distribution of the energy radiated across the spectrum (of wavelengths) for a star of a specific temperature
The intensity is inversely proportional to the peak wavelength
The temperature is inversely proportional to the peak wavelength
The peak is displaced to the left (smaller wavelength) as the temperature increases (Wien’s displacement law)

How can we understand the chemical composition of stars?
through observing their absorption spectra
dense, hot matter (core of star) emits electromagnetic waves
EM waves reach the gaseous layers of stars (in the outer atmosphere)
This gas absorbs the EM waves whose photons excite the electrons in the gas, which emit photons in all directions when de-excite
When the EM waves reach us, these missing wavelengths result in absorption spectra.
Three types of line spectra
continuous
emission
absorption
What is the continuous spectrum?
spectrum on which all wavelengths of light are emitted
a broad range of colours (depending on a star's temperature)
Produced by hot, dense sources, such as the cores of stars
How can the black-body curve be used to determine the black-body temperature of a star?
Peak wavelength can be obtained from the graph. Wien’s law must be applied and rearranged for T to obtain a value for temperature in Kelvin.
What is the Balmer series?
A series that describes the spectral line emissions of the hydrogen atom within the visible region of the EM spectrum.
Where can electrons move from in the Balmer series?
n = 2 up to any energy level during excitation. n = 1 is the ground state, so n = 2 is the first excitation level.
What is an assumption made when calculating black-body temperature (or peak wavelegth?)
That the star behaves like a black body.
What is a black-body?
An object that is an ideal absorber and ideal emitter. It absorbs and emits all wavelengths of light.
What does Wien’s displacement law indicate?
The peak wavelength is inversely proportional to the temperature of the star. As the temperature of the star increases, the peak of the black-body curve is displaced to the left; where the wavelength is smaller.
Hottest stars appear blue, coldest stars appear red (visible spectrum)
How do the hydrogen atoms in stars produce absorption lines?
(continuous spectrum emitted), but light of particular wavelengths are absorbed by (excited) hydrogen atoms (in star’s atmosphere). Absorbed wavelengths correspond to particular energy level transitions by electrons in hydrogen atoms. Light re-emitted in all directions, thereby reduced in direction of Earth.