STA 147: CH 1 - (covers all modules)
1/87
There's no tags or description
Looks like no tags are added yet.
Name | Mastery | Learn | Test | Matching | Spaced | Call with Kai |
|---|
No analytics yet
Send a link to your students to track their progress
88 Terms
Goals of Statistics
to describe and understand sources of variability.
The list of observations a variable assumes is called ______
data
Data
A set of values, which are usually organized by variables (what is being measured) and observational units (members of the sample/population)
Variable
A variable is a characteristic in data that can be measured/recorded and can take on different values.
3 proponents of Statistics:
Population, Individual, and Sample
Population
The entire group of individuals to be studied
Sample
A subset of the population being studied
Individual
A person or object taken from sample
What is Descriptive Statistics?
consist of organizing and summarizing data. Descriptive statistics describe data through numerical summaries, tables, and graphs.
What does Descriptive Statistics look like?
Numerical summary, a table or graph
Statistic
numerical summary of a sample within Descriptive Statistics.
What is Inferential Statistics?
uses methods that take results from a sample, extends them to the population, and measures the reliability of the result..
Parameter
numerical summary of a population (presented as % or avg.) that describes characteristic(s) of the population being studied. ** within Inferential Statistics
What is the Process of Statistics?
1. Identify the research objective
2. Collect the data needed to answer the question(s) posed in (1).
3. Describe the data.
4. Perform inference
Cross Sectional Study
Observational study where all information about the individuals was collected at a specific point in time and compared with one another
Cohort Study
Observational study that measures variables of a group of people over time
Case-Control Study
Observational study where 2 people differing in outcome are identified and compared to find a causal factor
What is a Frame?
A frame is a list of the individuals in the population being studied.
T or F: If the population of interest is all the students at a school, what would the frame be?
A list of all the students currectly attending that school.
What does it mean when sampling is done without replacement?
once an individual is selected, the individual is removed from that sample and cannot be chosen again.
Determine whether the underlined value is a parameter or a statistic: The average of men who have walked on the moon was 39 years, 11 months and 5 days
The value is a parameter because the men who have walked on the moon is a population
Determine whether or not the underlined numerical value is a parameter or statistic: A poll of all 2000 students in a high school found that 94% of its students owned cell phones
Parameter, because the data set if all 2000 students in a high school is a population
A polling organization contacts 2783 male university graduates who have a white collar job and asks whether or not they had received a raise at work during the past 4 months
What is the population in the study? What is the sample?
The population is male university students who have a white collar job, and the sample is the 2783 male university students who have a white collar job.
What is a Qualitative Variable?
Characteristic or a quality about a piece of data or an individual. Also called "Categorical" variables
What is a Quantitative Variable?
Quantitative are numeric variables; variables represented as a number.
Example of Categorical Variables?
Gender, hair color, diagnosis, age
Examples of Quantitative Variables?
Height, age, annual income, SAT score.
How do I identify variables as numeric (quantitative) or categorical (qualitative)?
A categorical variable is a variable with a set number of groups (gender, colors of the rainbow, brands of cereal), while a numeric variable is generally something that can be measured (height, weight, miles per hour). It is easy to identify categorical variables when the groups are specified with words, because you can't perform mathematical operations on a word. However, if the variable is represented numerically, it is important to consider the characteristics of the variable instead of automatically assuming it's numeric.
Here are some criteria to consider:
Do the numbers represent categories? For example, gender is often coded with "0" and "1" in a dataset, but it's still a categorical variable.
Is there a set number of possible values the variable could take? For example, the variable "number of car doors" will probably only have the values of "2" or "4". In this case, the variable is categorical.
Is the variable measured on a continuous scale (another way of thinking about this is can it be measured)? Variables like height and weight are good examples of numeric predictors that meet this criterion.
Discrete Quantitative Variable
Variable is finite
Continuous Quantitative Variable
Variable is infinite
Observational Study
If the researcher observes the behavior of the individuals (in the study) without trying to influence the outcome of the study and measures the value of the response variable without attempting to influence the value of either the response or explanatory variables.
Experimental Design Study
If the researcher assigns the individuals in a study to a certain group, intentionally changes the value of the explanatory variable, and then records the value of the response variable for each group.
Confounding Study
study flaws. when you cannot necessarily distinguish between the affects of explanatory variables or other variables upon the response variable(s), aka confounding variable
Confounding Variable
a variable that was considered in a study whose effect cannot be distinguished from a second explanatory variable in the study
What do "types of samples" refer to?
The techniques a certain sampling method uses.
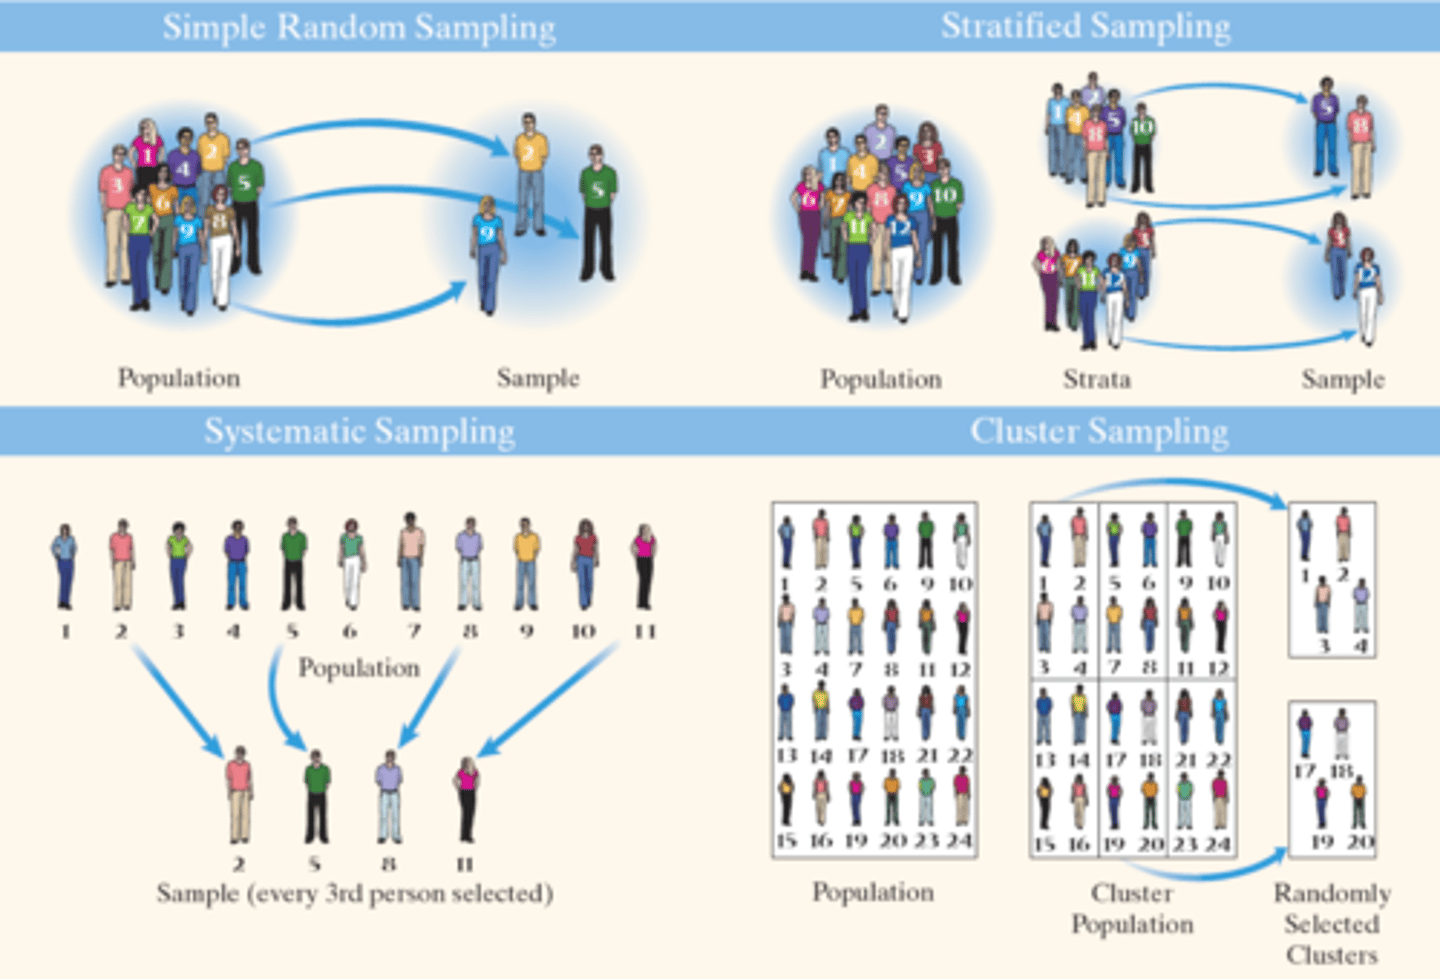
Simple Random Sampling
a probability sampling procedure in which every sampling unit has a known and equal chance of being selected
Random Sampling
The process of using chance to select individuals from a population to be included in the sample
Obtaining a Simple Random Sample
Obtain a Frame that lists all the individuals in the population of interest. Then, Number the Individuals in the frame [x, x, x, x]. Next, randomly generate n numbers where n is the desired sample size. You may use a random number table, graphing calculator, or statistical software to achieve this.
Random Number Generator (RNG) Method
A method for generating random numbers is known as random number generator
Other effective Sampling Methods include:
Stratified, Systematic, and Cluster Methods
Stratified Sampling
Obtained by separating the population into non-overlapping groups (strata), and then obtaining a simple random sample from each stratum.
The individuals within each stratum should be homogeneous (or similar) in some way.
Example of Stratified Sampling: "In 2008, the United States Senate had 47 Republicans, 51 Democrats, and 2 Independents. The president wants to have a luncheon with 4 Republicans, 4 Democrats, and 1 Other."
Obtain a stratified sample in order to select members who will attend the luncheon.
Obtain a simple random sample within each group. Be sure to use a different seed for each stratum.
A simple random sample of 4 Republicans (from the 47)
A simple random sample of 4 Democrats (from the 51)
A simple random sample of 1 Other (from the 100)
what is a seed in stratum
A seed is a number that initializes the selection of numbers by a random number generator; given the same seed number, a random number generator will generate the same series of random numbers each time a simulation is run.
Systematic Sampling
Obtained by selecting every k. individual from the population (where k is approximately N/n).
The first individual selected is a random number between and k.
what does k stand for in statistics?
a number. In systematic sampling, k in "every kth person" could be any number in which every other 5th, 19th, or 7th person is selected to be in a sample.
Cluster Sample
obtained by selecting all individuals within a randomly selected collection or group of individuals
Cluster Sample EXAMPLE:
If you randomly sample four departments from your college population, the four departments make up the cluster sample. Divide your college faculty by department. The departments are the clusters. Number each department, and then choose four different numbers using simple random sampling. All members of the four departments with those numbers are the cluster sample.
Systematic Sampling EXAMPLES:
Starting with a randomly chosen ice cream customer, every 5th customer was chosen and that customer was asked to fill out a survey.
2,000 people / 200 people in study
you will test every 100th person
MAIN SAMPLING METHODS DEMOGRAPHIC
Its important to be able to differentiate Stratified and Cluster samples since they easily get confused. What is the main difference?
Stratified sample —> divide the population into two or more homogeneous groups —> obtain a simple random sample from each group.
Cluster sample —> divide the population into groups —> obtain a simple random sample of some of the groups —> survey all individuals in the selected groups.
What is the biggest error one can make in Sampling?
Bias
When does Bias occur in Sampling?
When a sample's results are not representative of the population.
There are four sources of Bias in Sampling. What are they called?
Under-coverage bias
Sampling bias
Nonresponse bias
Response bias
When does under-coverage bias occur in sampling?
When a part of the population is excluded from your sample, or one segment of the population is lower in a sample than it is in the population.
Under-representation
When does sampling bias occur?
When the technique used to obtain the data in the sample favors one part of the population over another
When does non-response bias occur in sampling?
When individuals selected to be in the sample do not respond to the survey happen to have different opinions from those who did respond
Can be less impactful through the use of callbacks or rewards/incentives
When does response bias occur?
When the answers on a survey do not reflect the respondent's true feelings
There are 4 kinds of Response Bias. What are they?
Interview error
Misrepresented answers
Wording of questions
Order of questions or word
What are more common mistakes made in sampling that don't relate to bias?
Data-entry error
non-sampling error
sampling error
convenience sample
Data-entry error
not technically a result of response bias, data-entry errors will lead to results not representative of the population
non-sampling error
What you get from making errors in sampling bias, nonresponse bias, or data-entry.
sampling error
When someone uses a sample to estimate information about a population
convenience sampling
choosing individuals who are easiest to reach
An experiment is a __________ study
controlled
What is the purpose of an experiment?
An experiment is a controlled study conducted to determine the effect of varying one or more explanatory variables or factors has on a response variable.
6 Characteristics of an Experiment:
Treatment
Explanatory Variable
Control Group
Factor
Subject
Placebo
Blinding
What is a "treatment" in an experiment?
A treatment is what the researcher applies to the explanatory variables, or "factors" in their experiment in order to analyze its effect on a dependent variable
What is an Explanatory Variable in an experiment?
a variable that we think explains or causes changes in the response variable
What is the Control Group in an experiment?
The group that does not receive the experimental treatment.
Serves as a "baseline treatment" that can be used to compare real treatment.
What is a Factor in an expriment?
essentially an explanatory variable.
A controlled "independent" variable; a variable whose levels are set by the experimenters
Purpose of studying factors:
analyze how changes in a factor affect the dependent variable (the measured outcome).
What are the "levels" of a factor in an experiment?
Different variations of a factor are called "levels". For example, if testing the effect of different fertilizer types on plant growth, "fertilizer type" would be the factor, and each individual fertilizer type would be a level.
What is a Subject in an experiment?
the individual that is being studied or manipulated in the research and is being observed or tested upon, also called the "Experimental Unit".
Focal point of experiment
While "subject" is still used, many researchers now favor "participant" to emphasize the active role of individuals involved in the study.
What is a Placebo in an experiment?
Fake treatment (given to control group)
What is Blinding in an experiment?
Nondisclosure of treatment being given or received.
There are two types of blinding
What are the two types of blinding?
single blinding and double blinding
What is Single Blinding?
When ONLY the exp unit does not know which treatment they are getting.
What is Double Blinding?
When the exp. unit NOR the Researcher in contact with the exp unit knows which treatment they are giving and receiving
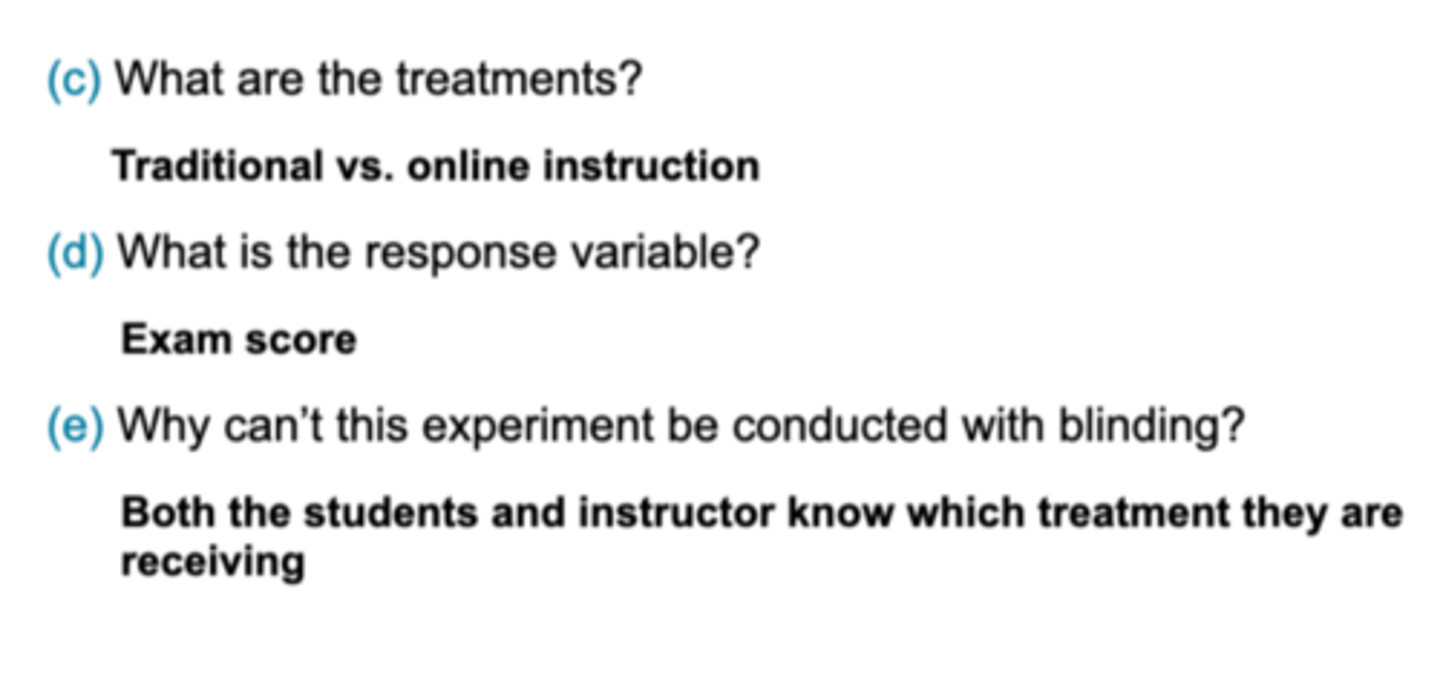
EX: Defining the characteristics of an Experiment (part 1)
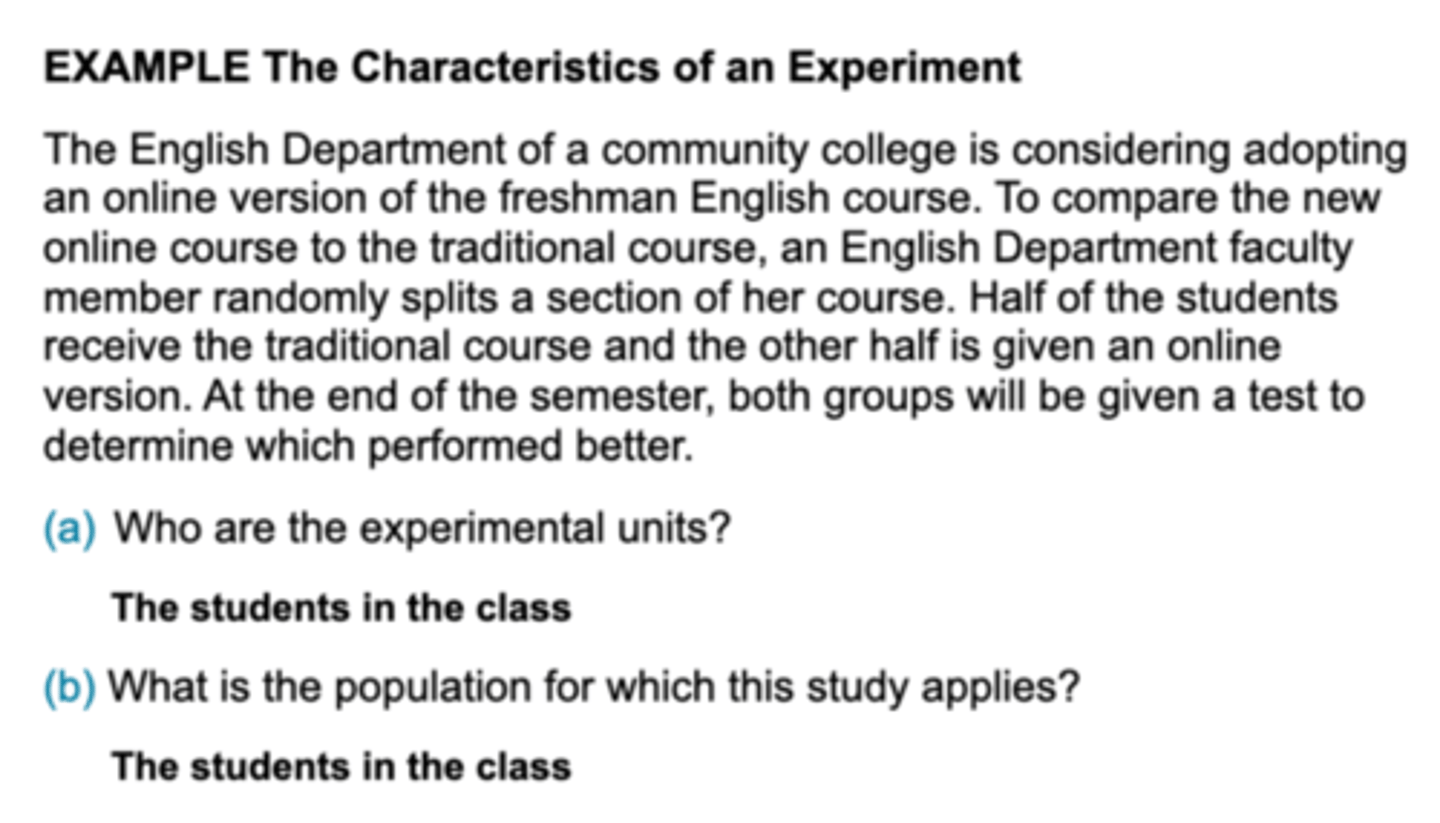
EX: Defining the characteristics of an Experiment (part 2)
What is the 6-step process in CONDUCTING an experiment?
Step 1: Establish and create a claim-- Identify a problem you want to solve
Step 2: Determine what factors are affecting the response variable
Step 3: Determine the number of experimental units in the research
Step 4: Determine the level of the predictor variables (CONTROL AND RANDOMIZE)
Step 5: Conduct the Experiment
Step 6: Test the Claim
Explain how to do step 1: Establish and create a claim-- Identify a problem you want to solve
Should be explicit
Should provide the experimenter direction
Should identify the response variable and the population to be studied.
Explain how to do step 2: Determine what factors are affecting the response variable
Must determine which factors are to be fixed, manipulated, and uncontrolled.
Explain how to do step 3: Determine the number of experimental units.
a. Use as many experimental units as time and money allow.
b. Techniques exist for determining sample size, provided certain information is available.
Explain how to do step 4: Determine the level of the predictor variables (CONTROL AND RANDOMIZE)
Control: There are two ways to control the factors:
a) Set the level of a factor at one value throughout the experiment (if you are not interested in its effect on the response variable).
b) Set the level of a factor at various levels (if you are interested in its effect on the response variable). The combination of the levels of all varied factors constitute the treatments in the experiment.
Randomize:
a) Randomize the experimental units to various treatment groups to minimize the effects of variables whose level cannot be controlled.
The idea is that randomization “averages out” the effect of uncontrolled predictor variables.
Explain how to do step 5: Conduct the Experiment
Collect and Process data by measuring the value of the response variable for each replication.
Any difference in the value of the response variable results from differences in the treatment level.
Replication may occur
When does Replication occur in conducting an experiment?
When each treatment is applied to more than one experimental unit.
Recommended that each treatment group have the same number of experimental units
Why do researchers use Replication?
It helps to ensure that the effect of a treatment is not due to some variable (characteristic) of a single experimental unit.
Explain how to do step 6: Test the Claim
Run a hypothesis test.
Establish claim, once again.
Provide a statement regarding the level of confidence in the generalization.