Normal linear models
1/43
Earn XP
Description and Tags
By the end of these workshops and your own studies, you should be able to · · · · · Formally describe a normal linear model Implement normal models (continuous, categorical predictors) Conceptually understand maximum likelihood estimation (how lm determines model coefficients) Interpret model coefficients and quantities related to null hypothesis testing (confidence interval, t-value, p-value) Predict hypothetical outcomes given a statistical model Using a combination of theoretical descriptions, practical exercises, implementations, and simulations
Name | Mastery | Learn | Test | Matching | Spaced |
|---|
No study sessions yet.
44 Terms
What are normal linear models?
A model of how the probability distribution of one variable, known as the outcome variable, varies as a function of other variables, known as the explanatory or predictor variables
normal linear models are The most basic type of
regression models is the normal linear model.
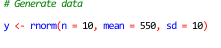
rnorm generates…
unimodal, symmetrically distributed values
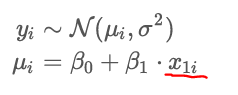
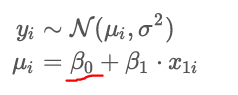
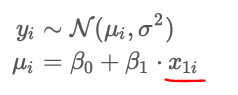
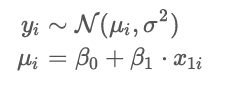
Normal linear model (formal description)
yi~N(ui,o2)
ui= B0 + B1 ⋅ x1i

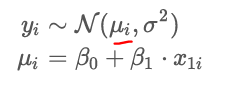
what does ui represent?
is a deterministic (“ = ”) function of one or more predictors and the unknowns (intercept) and is “constant” (slope).
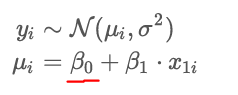
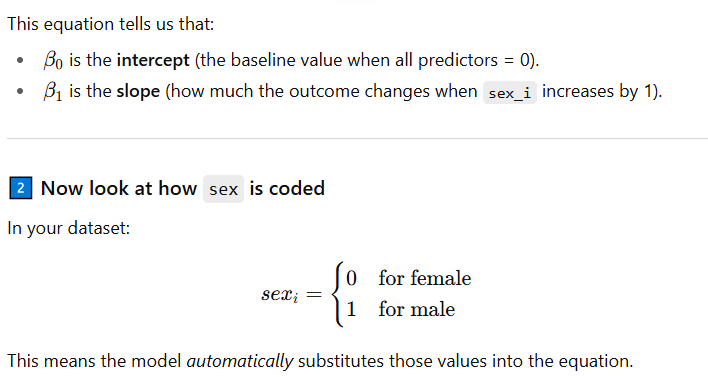
what does B0 represent?
is the constant
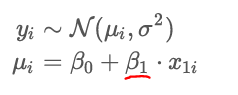
what does B1 represent?
directly depends on explanatory variable x1i
if x1i takes on the value of 0, then ui =…?
B0
if x1i takes on the value of 1, then ui =…?
B0 + B1
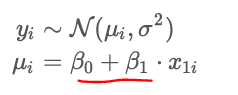
B1 is the difference between
x1i = 1 and x1i= 0
β1 measures how much the mean changes when you go from x=0 to x=1
For example: if “gender (1 = male, 0 = female)”, then B1 represents the mean difference between males and females
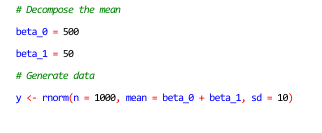
# Decompose the mean
beta_0 = 500
beta_1 = 50
Simulation of normal distributed data
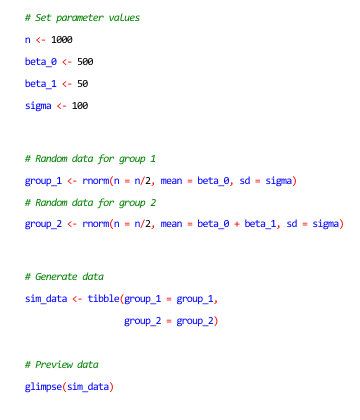
1) set parameter values
2)random data for group1
3) random data for group 2
→4) generate data
Simulation of normal distributed data 2
5)make normal linear model of data
6)then check model coefficients
7)then check standard deviation
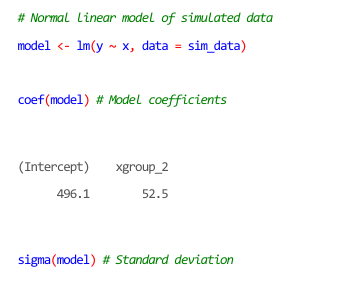
To check model coefficients, type the following function
coef(model_name)
To check model standard deviation, type the following function
sigma(model_name)
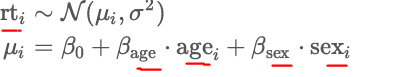
Write the following Normal linear model (formal description) of how the mean of the distribution of reaction times (rt) varies as a function of age and sex.
rt i ~ N(ui,o2)
ui = B0 + Bage ⋅ agei + Bsex ⋅sexi
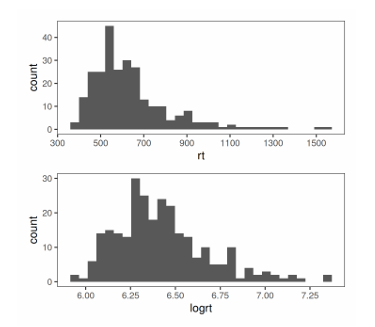
Real data may appear non-normal distributed for small samples…
which is fine if we have reasons to believe the data come from a process that is normal distributed.
Log-normal distributions are zero-bound BECAUSE…
-log normal distributio only takes on POSITIVE values (it’s bounded below by 0)
→For example
Reaction times can’t be less than 0 seconds, but they can be 0.2 s, 0.5 s
We assume that the rt values are sampled from a log-normal distribution…
This means we think each observed reaction time rti comes from a log-normal population with some:
mean: ui
standard deviation: o
“These describe the distribution of the log of reaction times, not the reaction times themselves.“
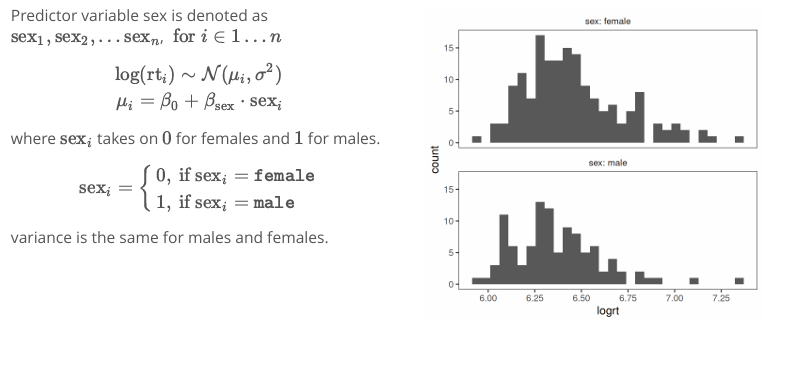
example of log rt seprated by sex
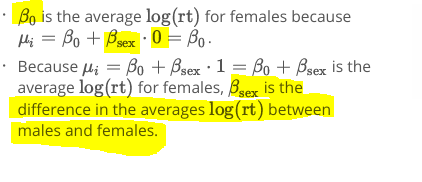
B0 is the average (logrt) for females becasue…
Compare simulated and real data 3
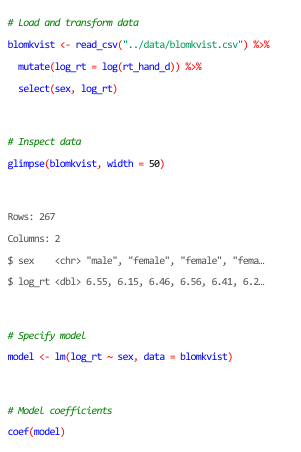
8)Load and mutate/select real data to compare to logarythmic data created earlier
9)glimpse what it looks like
10) wrtite a linear regression model on the code
11)use the coef funciton to check coefficients
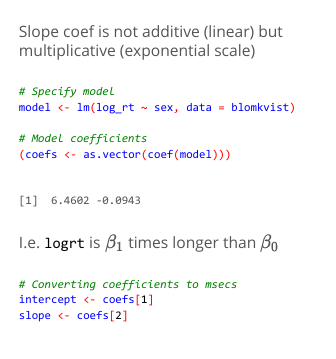
When in the lecture it says “Slope coef is not additive (linear) but
multiplicative (exponential scale)“
its means that →…
this parcutilar slope coefficient is on an exponential scale (because its based on logarythmic data), rather than linear scale which is based on normal data
Interpreting coeffcients on the log scale 4
12)do linear regresion model from before
13)make a model out of the coeffiecnts collected from the model made just before
14)convert the coefficients back into the orignial data format whihc in this example is “msecs“(=milliseconds of reaction time)
→this also splits them by sex because female is = 0 and male =1***
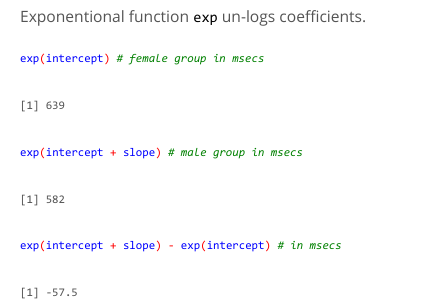
What function un-logarythmics coefficients?
Exponentional function
→exp()
Interpreting coeffcients on the log scale 5
15) un-log intercept to show you female’s group reaction time score in milliseconds
16)un-log intercept + slope to show you male’s group reaction time score in milliseconds
17)by taking away male group score from female group score you get=Difference in RT (ms) between male & female
reason why exp(intercept) is female and exp(intercept+slope) is male…
MLEs=
Maximum likelihood estimation