3.3: Survivorship curves
0.0(0)
0.0(0)
Card Sorting
1/4
There's no tags or description
Looks like no tags are added yet.
Study Analytics
Name | Mastery | Learn | Test | Matching | Spaced | Call with Kai |
|---|
No study sessions yet.
5 Terms
1
New cards
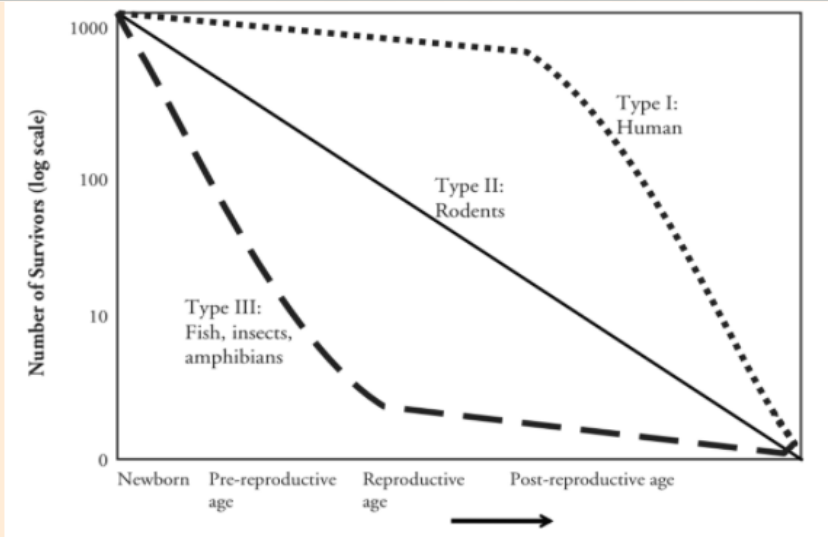
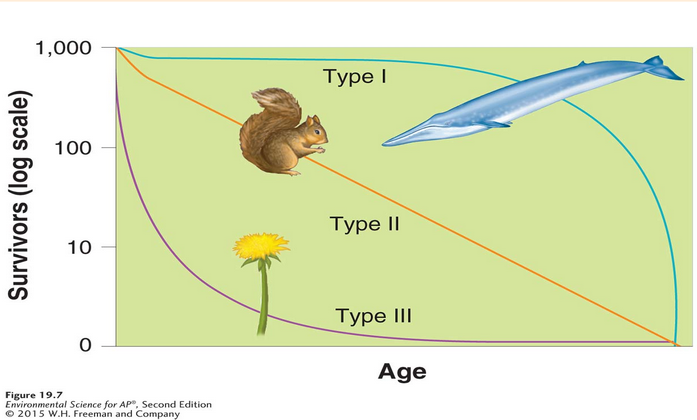
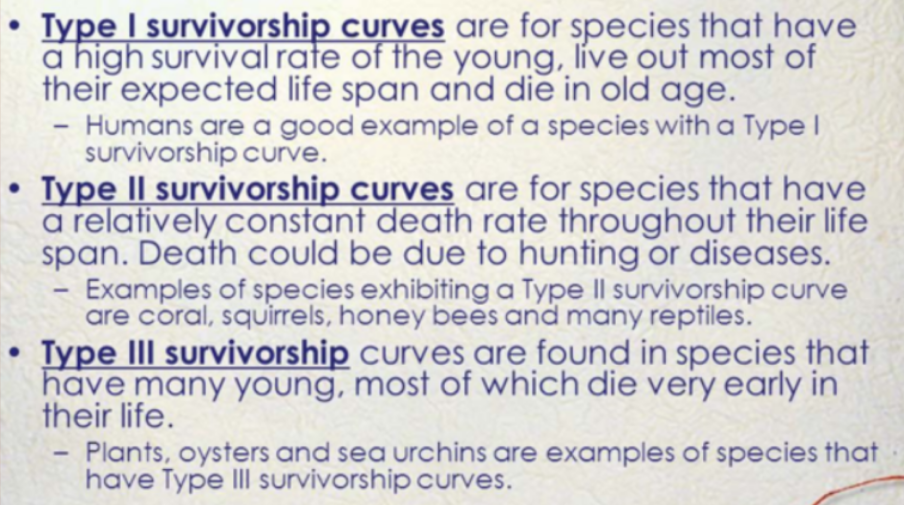
Survivorship curve
A graph that represents the distinct patterns of species survival as a function of age.
2
New cards
Type I
High survival throughout most of the life span, but then individuals start to die in large numbers as they approach old age.
3
New cards
Type II
Relatively constant decline in survivorship throughout most of the life span.
4
New cards
Type III
Low survivorship early in life with few individuals reaching adulthood.
5
New cards
Survivorship Curves