PSY 342 Sec 3 Exam
1/98
There's no tags or description
Looks like no tags are added yet.
Name | Mastery | Learn | Test | Matching | Spaced | Call with Kai |
|---|
No analytics yet
Send a link to your students to track their progress
99 Terms
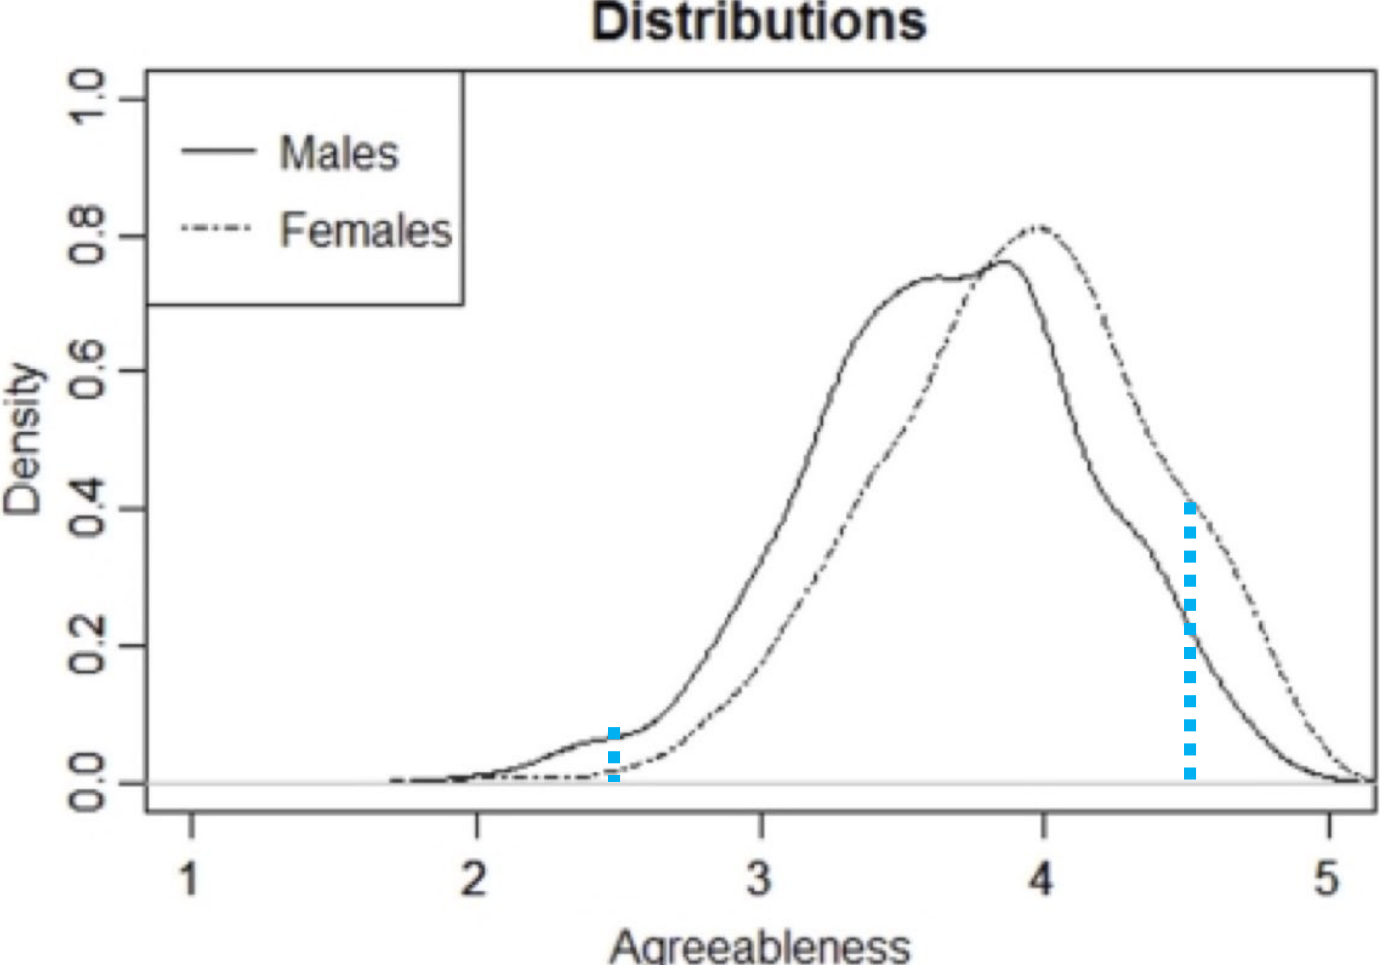
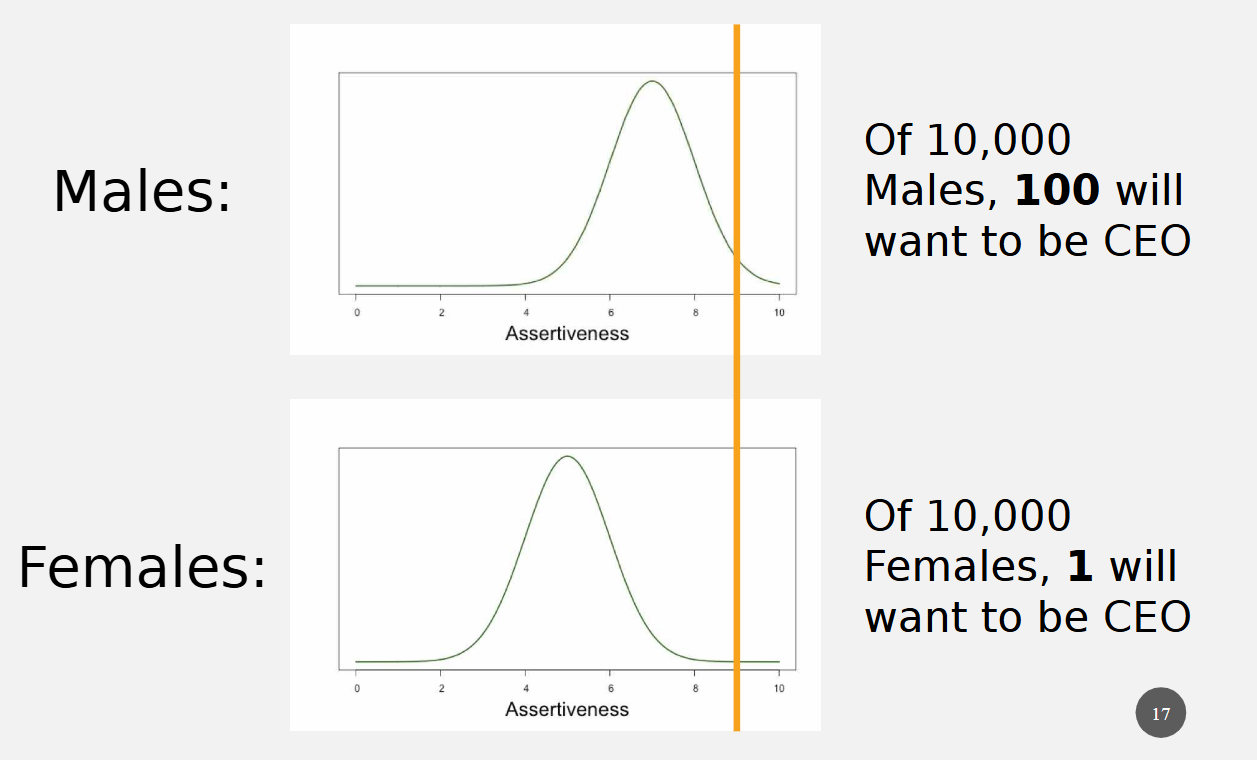
Extremes on Distribution
groups may be overwhelmingly similar while
showing important differences at the extremes
Disparate Outcomes with Differing Groups
Common Framing of Disparities and Solutions
Disparity = unequal outcomes between groups (relative to group size)
Cause = behavior of decision-makers or systemic bias/discrimination
Solution = enforce equal outcomes via regulations, rules, or third-party policies
Tradeoffs
Every social and political policy has tradeoffs
Freedom of choice…unequal outcomes
Four Factors Causing Outcomes
Interest – what we care about
Ability – what we’re good at
Effort – how much we’re willing to put in
Barriers to entry – what we’re allowed to do
Supply and Value
Wages increase when supply declines relative to demand
Wages increase when value to employer increases

Factors Affecting Wages
Risk (e.g., dangerous jobs)
Specialized training (increases value, reduces supply)
Restrictions or costs to workers (limits labor pool, raises wages)
(As your Value increases so does your pay)

Wage Determination
Wages reflect the price for the product of your labor, influenced by supply, demand, and job/worker characteristics.
Market-wide vs. within-occupation comparisons
Market-wide averages hide job differences; within-occupation comparisons consider differences in qualifications and job demands.
Equal work vs. equal pay
Disparities in pay between groups for the same work indicate unequal treatment (e.g., same job, same experience, different pay).
Job characteristics and pay
Job danger, irregular hours, flexibility, and time-off policies all influence compensation differences.
Occupational segregation
Men dominate high-risk, trade-based jobs; women dominate people-oriented, care-related jobs.
Top executive wage gap
Gender pay gap among executives shrinks to less than 5% after accounting for experience and company size.
Apparent pay disparities
Women earn less on average, but controlling for job and employee variables shows minimal evidence of unfair wage gaps.
Political vs. structural solutions
Political solutions are easier but may cause unintended consequences. Changing root causes of employment differences (like caregiving roles) is harder.
Gender-Differentiated Preferences
Greater equality and access to resources increases manifestation of gender-based preferences in career and behavior.
Swedish Labor Market Paradox
Despite progressive policies (e.g., paid leave), Sweden sees persistent gender-based career choices and high labor market segregation.
Achievement measure
A test of what a person knows at a specific time; tied to curriculum content.
Ability measure
Assesses how likely a person is to benefit from instruction or how much help they need to reach competence.
Voyer & Voyer (2014) study
Across 100 years and 30 countries, girls consistently outperform boys in mandatory education in nearly every subject.
Components of STEM ability
Verbal ability: language use
Visuospatial ability: mental image manipulation
Quantitative ability: math, numbers, problem-solving
Verbal ability sex difference
Girls show a small advantage in verbal scores (e.g., 6-point SAT edge), and larger advantages in writing and reading, outperforming boys consistently.
Male Visuospatial Advantage
Most assessments show medium to large male advantages, especially in mental rotation and spatial navigation tasks like map reading and surgery simulation.
Early Origins of Ability Differences
Sex differences in math ability appear in precocious preschoolers and early elementary students, and persist even with enrichment. Training can reduce visuospatial gaps.
Summary of Quantitative and Verbal Differences
Women outperform men in classroom settings, but men score higher on aptitude-based quantitative tests. Women score higher on verbal ability.
Hormonal Influence on Preferences
Girls with Congenital Adrenal Hyperplasia (CAH) show masculinized traits, such as a preference for boys' toys and better spatial skills, supporting a hormonal influence on interests.
High Quantitative and Verbal Ability in Women
Women who are high in quantitative ability tend to also be high in verbal ability, unlike men who are more mixed.
Social Framing of STEM Careers
Beliefs about STEM not fulfilling women’s social interests reduce their engagement; reframing STEM could change perceptions.
Unintended Consequences of Reframing STEM
Changing how people think about STEM may attract more high-aptitude women, but could lower satisfaction or draw them away from other fields.
Types of Barriers to STEM Entry
Barriers to STEM can be explicit (discrimination) or implicit/subtle (discouragement, gender roles).
Stable Preferences Over Time
Sex differences in reasoning ability and life goals are stable over time and predict persistent occupational differences.
Opposing But Incomplete Views on Group Outcomes
Some say immigrant success proves all can succeed (conservatives); others blame current disparities solely on discrimination—both views miss important context. (liberals)
Primary Explanation for Economic Differences
Most cross-group economic outcome differences are due to differences in employee value, not discrimination.
Progress Among Most Groups
Most racial and ethnic groups in the U.S. have shown strong improvements in quality of life and economic outcomes over time.
The Cultural Underclass
A small underclass of both Black and White Americans faces persistent problems that hinder advancement, rooted in complex cultural origins.
Controlling for Skills in Wage Gaps
Wage gaps between Black and White Americans largely disappear when controlling for cognitive and workplace skills.
Skill Differences and the Wage Gap
Differences in family background and school quality partly explain the Black-White skill gap that drives wage disparities (Neal & Johnson, 1996).
Heckman's View on Labor Market Discrimination
Labor market discrimination is no longer a major quantitative issue; improving skills through family, school, and neighborhood reforms is more effective.
Black–White Skill Gap Trends
Skill gaps narrowed through the 20th century but have stalled or widened since the late 1980s, limiting future wage parity (Neal 2023).
Fryer on Skills vs. Discrimination
Racial wage gaps are better explained by skill differences than by discrimination; this holds true across outcomes like incarceration and teen pregnancy.
Objective Job Performance Differences
Black-White differences in work performance are greater on objective measures like productivity and knowledge tests than on subjective ratings.
Roth et al. (2003) on Performance Measures
Objective assessments (e.g., work samples, job knowledge tests) show larger racial group differences than performance ratings.
McKay & Daniel (2006) Meta-Analysis
Largest meta-analysis on Black-White performance gaps found a small but consistent effect favoring Whites (d = 0.27), especially on cognitively demanding tasks.
Pre-Market Skill Differences as the Core Issue
Group disparities in earnings and performance are mostly due to differences in skills developed before entering the labor market.
Importance of Family Structure
Children raised by two married biological parents tend to have better outcomes than those raised by divorced or never-married parents.
Effects of Family Structure on Child Outcomes
Family structure influences aggression, delinquency, health, school performance, emotional well-being, and long-term outcomes like criminality and mortality.
Family Structure Effects Across Demographics
These patterns hold true across income levels, races, ethnicities, and genders—including for those raised by stepfathers or single mothers.
Consequences of Father Absence
Living apart from a biological parent, especially the father, is associated with lower upward mobility, worse academic performance, and lower college attainment.
Stability and Two-Parent Households
Stable two-parent families are linked to more positive educational, economic, and health outcomes, even when controlling for other variables.
Cohabiting vs. Married Parents
About 2/3 of cohabiting couples separate before their child reaches adolescence, compared to only 1/4 of married couples.
Poverty Prevention Strategy
Finishing high school, getting a full-time job, and delaying marriage and childbirth until age 21 is associated with very low poverty rates and high middle-class attainment.
Jaffee et al. on Marriage and Child Outcomes
Marriage alone doesn’t benefit children unless fathers are emotionally and economically reliable; anti-social fathers may cause more harm than absent ones.
Lower Income Households and Social Challenges
Among lower-income White Americans, there are higher rates of single-parent households, crime, distrust, and unemployment.
Changing Attitudes Toward Marriage
Post-1950s decline in two-parent households is tied to reduced stigma around childbirth outside marriage and fewer “shotgun marriages.”
Welfare Programs and Marriage Incentives
Some studies suggest that means-tested welfare programs may discourage marriage and increase the number of female-headed households.
Decline in Male Economic Attractiveness
Falling wages and job prospects for men, especially in lower-income brackets, have made them less desirable as marriage partners.
Economic Gains Among Women
Women, including Black women, have seen gains in education and income, shifting traditional family dynamics.
Marriage and Relative Earnings
Likelihood of marriage decreases when women make more than men, especially in lower-income settings.
Post-1950s Trends in Family Decline
Policies, wage stagnation, criminality, and education shifts have led to more children being raised by unmarried mothers—especially among Black Americans.
Underclass Family Instability Across Races
Family structure instability is not exclusive to any race and also affects White and Asian American underclass populations (Murray, 2010).
STEM and Law Mismatch Effects
Mismatch leads to more Black students switching majors, lower performance, and lower bar exam pass rates—reducing the number of Black professionals in these fields.
Law School Outcomes and Due to Mismatch
Black law grads fail the bar at 4x the rate of Whites; about 60% of this gap is due to mismatch (Sander & Taylor, 2012).
Three Types of Mismatch
Learning mismatch
Competition mismatch
Social mismatch—can lead to racial segregation and “tribalism” on campus.
Interracial Friendships and Academic Similarity
Interracial friendships are more common when students have similar academic backgrounds, suggesting that mismatch reduces campus social integration.
Affirmative Action and Racial Resentment
Policies may create resentment and racial conflict by introducing unequal standards and perceived unfairness.
Harvard and Black Student Backgrounds
Over half of Black undergrads at Harvard were West Indian or African immigrants or their children—raising questions about who benefits from affirmative action.
Effect of Affirmative Action on Classrooms
Without AA: Students admitted at similar scores, few academic group differences.
With AA: Different standards create average performance gaps by race.
Three Psychological Effects of Affirmative Action
Loss of interest in original major or career
Self-doubt, even without direct benefit from AA
Unfairness to high-performing minority students
Field Switching and Academic Background
Black students disproportionately switch out of STEM/econ majors; this gap is fully explained by academic preparation (Arcidiacono et al., 2012).
Unintended Effects of Affirmative Action
Policies can harm intended beneficiaries by lowering learning and social outcomes and undermining dignity and motivation.
Discrimination Against Asian Students
AA policies often reduce admission chances for Asian students despite high qualifications.
McWhorter’s Critique of Affirmative Action
Affirmative action serves to validate white administrators’ intentions more than it benefits Black and Hispanic students.
Costs of Affirmative Action
Even if justifiable, AA policies have real psychological, educational, and occupational costs that must be acknowledged.
Male-Female Differences in Outcomes Sowell (2008)a
Sowell examines disparities in income, employment, and education between men and women, arguing that many observed differences are not due to discrimination but to choices, circumstances, and trade-offs—such as differences in work hours, career interruptions, and occupational preferences. The chapter aims to challenge the assumption that unequal outcomes automatically reflect unequal treatment.
Sex Differences in Interests Su et al. (2009)
Conducted a meta-analysis of vocational interests and found consistent sex differences: men tend to prefer working with things (e.g., engineering, mechanics), while women tend to prefer working with people (e.g., education, social services). These differences were large and stable across age, culture, and time, suggesting that career interests are an important factor in explaining occupational gender disparities.
Breadth-Based Model of Women's Underrepresentation in STEM Valla & Ceci (2014)
argues that women's underrepresentation in STEM is partly due to their broader cognitive strengths and interests across multiple domains, especially verbal and social fields. Unlike men who may be more narrowly focused on STEM, women with high math ability often also excel in verbal areas, giving them more career options. This breadth leads some women to pursue non-STEM paths, not because of barriers, but because of preferences and opportunities aligned with their diverse talents.
Racial Disparities and Misinterpretations Sowell (2008)b
Challenges common assumptions about racial disparities, arguing that unequal outcomes across racial groups often stem from historical, cultural, and socioeconomic factors rather than systemic discrimination. He emphasizes the importance of considering context—such as age distributions, education levels, and family structure—when interpreting racial statistics, cautioning against simplistic or politically motivated conclusions.
Challenges in Detecting Discrimination Heckman (1998)
Argues that proving discrimination requires more than showing group differences in outcomes. True detection involves isolating discrimination from other confounding factors like skill, education, or experience. He critiques studies that assume equal treatment should lead to equal outcomes, emphasizing that observed disparities can result from many factors unrelated to bias. He advocates for careful, methodologically sound approaches—like audit studies—to detect discrimination accurately.
Disparity Does Not Equal Discrimination
Disparate outcomes between groups are not sufficient evidence of discrimination. Differences may arise from interest, effort, ability, or structural barriers—not necessarily bias. Discrimination must be isolated from confounding factors like skill or experience (Heckman, 1998). Focusing only on discrimination can ignore progress and underplay behavioral or cultural group differences.
Detecting Discrimination Accurately
Proving discrimination requires careful methodology, not just identifying unequal outcomes. Heckman argues for isolating bias from other factors and warns against assuming equal treatment should lead to equal results. Audit studies are one way to detect bias more accurately.
Addressing Root Causes vs. Forcing Equal Outcomes
Efforts to reduce disparities can target root causes (like skill gaps) or try to enforce equal outcomes (like racial hiring quotas). Fixing causes (e.g., training) is often more effective and less risky than enforcing outcomes, which may backfire or reduce dignity.
Key Causes of Group Outcome Differences
Interest – What people care about
Ability – Natural skills or talents
Effort – Motivation and time investment
Barriers – Systemic or social obstacles
Even with zero discrimination, group differences may persist.
Affirmative Action and Admissions Gaps
Affirmative action includes outcome-focused programs using social identity in admissions. Critics point to large gaps in admission rates: Black applicants are 5x more likely to be admitted than Whites with equal credentials, and Whites are 3x more likely than Asians (Espenshade & Chung, 2005). Policies raise fairness and merit concerns.
Mismatch Hypothesis and Quality-Fit Tradeoff
Placing underprepared students in highly competitive schools can reduce success rates—especially in STEM or law (Sander; McWhorter, 2015). Students tend to succeed more when schools match their academic readiness (Arcidiacono & Lovenheim, 2016).
Gender Pay Gap Explained by Preferences and Roles
Wage gaps largely disappear when accounting for job type, hours, and family choices. Parenthood, especially for mothers, leads to reduced hours or workforce exit. High-aptitude women often value flexibility and caregiving, while men pursue full-time, high-paying jobs.
Explaining Gender Work Differences
Men and women differ in job preferences:
Mothers prefer flexible/part-time work
Fathers prioritize pay
Most families prefer young children be cared for by a parent
These preferences drive occupational segregation and pay gaps more than discrimination.
Cognitive Ability and Life Outcomes
Intelligence is stable, measurable, and a top predictor of success—stronger than grit or personality (Zisman & Ganzach). Cognitive tests are not racially biased and are better predictors than SES alone.
STEM Ability Differences and Career Outcomes
Men have higher quantitative ability at the extremes; women have higher verbal ability and broader aptitude profiles. Women’s broader skill sets lead to wider career options (e.g., medicine, psychology) over narrow, math-intensive STEM fields.
Interest in People vs. Things
One of the largest sex differences: Men prefer things-oriented work (e.g., engineering); women prefer people-oriented roles (e.g., healthcare). These preferences are stable across age, culture, and decades, and align with observed degree and job outcomes.
Barriers to STEM Entry
Barriers may be explicit (e.g., past discrimination) or implicit (e.g., social norms, discouragement). But recent evidence shows:
No disparities in grant funding or hiring
Some pro-female hiring bias (Ceci et al., 2023)
Gendered interests explain much of the STEM gap
Cultural and Structural Factors in Group Outcomes
Economic gaps between racial/ethnic groups are mostly due to differences in cognitive and workplace skills—not discrimination. Selection effects matter: cross-group comparisons must consider background, education, and self-selection into fields.
Family Structure and Long-Term Outcomes
Children from stable two-parent families (especially biological parents) have better outcomes in education, behavior, health, and income. Family instability—common across racial groups—can hinder upward mobility, regardless of income level.
Mismatch Theory – McWhorter (2015)
Supports the mismatch hypothesis: placing underprepared students in elite schools through affirmative action can harm their outcomes. McWhorter argues that poor academic fit, not lack of ability, makes success harder—especially in STEM. He advocates matching school difficulty to student preparation.
The Mismatch Hypothesis – Sander & Taylor (2012)
Argues that students admitted through affirmative action to highly selective schools may face academic mismatch. In STEM and law, this misalignment leads to lower performance and higher dropout rates compared to if they attended a better-fit institution.
Affirmative Action Admissions Gaps – Espenshade & Chung (2005)
At elite colleges, Black applicants with SAT scores of 1150 were admitted at the same rate as White applicants with 1460 or Asian applicants with 1600. Highlights race-based disparities in admissions odds, raising questions about fairness and merit.
Quality-Fit Tradeoff – Arcidiacono & Lovenheim (2016)
Higher-quality schools generally lead to better student outcomes—but only if the student is academically prepared. Poorly matched students may underperform, especially in demanding programs. Fit matters as much as school prestige.
Ceci et al. (2023) – Gender Disparities in STEM
This study found no disparity in grant funding, publication acceptance, or recommendations for women. In fact, there was a pro-female bias in hiring. Salary differences were minor and tilted slightly male. Challenges the narrative of widespread discrimination in current STEM hiring.
Unintended Outcomes of Regulating Equal Pay
Fixing pay between men and women via third-party regulation can lead to unintended consequences such as reduced flexibility in employment contracts, employer hesitancy to hire, distorted market signals, wage compression, covert discrimination, and increased administrative burden. These effects may undermine both productivity and fairness.
Selection Effects in Group Comparisons
Selection effects occur when individuals who end up in a group differ systematically from those who do not, potentially biasing comparisons. In the U.S., group differences in outcomes (e.g., income, education) may reflect selection into opportunities rather than treatment within them. Accounting for selection is crucial to avoid attributing disparities to discrimination or policy effects when they may stem from pre-existing differences in background, ability, or choices.