AP Stats Summer Study
5.0(1)
Card Sorting
1/19
There's no tags or description
Looks like no tags are added yet.
Study Analytics
Name | Mastery | Learn | Test | Matching | Spaced |
|---|
No study sessions yet.
20 Terms
1
New cards
Quartiles
Values that divide a data set into four equal parts
2
New cards
Categorical Variable
Take on values that are names or labels
3
New cards
Quantitative Variable
They represent a measurable quantity
4
New cards
Discrete Variables
Assume values that can be counted (cannot take on any value)
5
New cards
Continuous
Can take on any value between its maximum value and its minimum value
6
New cards
Univariate Data
Data with one variable
7
New cards
Bivariate Data
Data with two variables, or pairs of numerical observations
8
New cards
Median
The middle score in a distribution; half the scores are above it and half are below it
9
New cards
Mean
The arithmetic average of a distribution, obtained by adding the scores and then dividing them by the number on scores
10
New cards
Outlier
A data point that diverges greatly from the overall pattern of data
11
New cards
Range
The difference between the highest and lowest scores in a distribution
12
New cards
Variance
Standard deviation squared, a numerical value used to indicate how widely individuals in a group vary
13
New cards
Standard Deviation
The square root of the variance, a numerical value used to indicate how widely individuals in a group vary
14
New cards
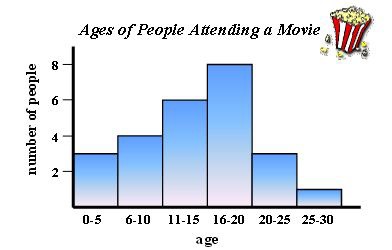
Histogram

15
New cards
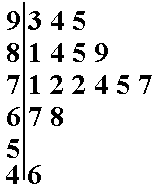
Stemplot

16
New cards
Boxplot

17
New cards
Interquartile Range
The difference between the upper quartile and the lower quartile
18
New cards
Unimodal
Having one mode; this is a useful term for describing the shape of a histogram when it’s generally mound-shaped
19
New cards
Bimodal
Two peaks
20
New cards
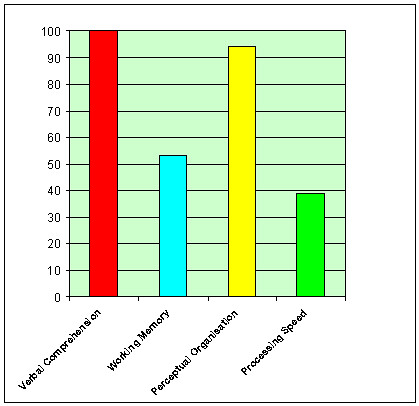
Bar Chart
