Math 108X Unit 3: Ch 10, Ch 11, Ch 12
1/23
Earn XP
Description and Tags
BYU-I Math 108X Math for the Real World Textbook; Ch 10 Making Predictions from data;
Name | Mastery | Learn | Test | Matching | Spaced | Call with Kai |
|---|
No analytics yet
Send a link to your students to track their progress
24 Terms
Data analysis
the method of collecting, graphing, and analyzing data in order to understand patterns in the data
Names for input variable
x-variable
independent variable
explanatory variable
predictor variable
Names for output variable
y-variable
dependent variable
response variable
outcome variable
result variable
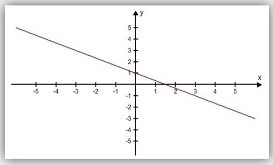
trendline
the graph of a function that describes the pattern or trend in data represented by input and output variablesc
A correlation between two variables does not?
imply there is a casual relationship
system of equations
a list of two or more equations that use the same input and output variables.
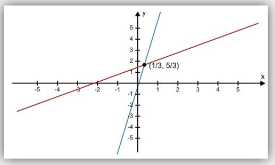
intersection point
satisfies both equations in a system so it represents the solution we are looking for
Independent system
Formed when two lines intersect at one point.
The point where the lines intersect is the solution to the system.
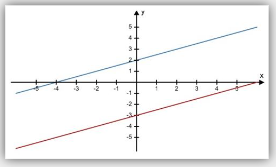
Inconsistent system
is formed when two lines are parallel and never intersect.
has no solution.
dependent system
formed when the two equations in the system actually represent the same line.
Every point on the line is a solution to the system. So the solution has infinitely-many solutions.
What is one way to solve a system of equations
The substitution method
substitution method
to solve a system of equations with this you eliminate one variable from one of the equations by substituting an expression for that variable from the other equation.
Probability
a measurement between 0 and 1 of how likely an event is to happen. An event with a probability of 0 will never happen. An event with a probability of 1 is certain to happen.
sample space
a list of all the possible outcomes of an event
probability model
consists of the sample space along with the probability of each possible outcome.
empirical probability
determined by historical data or by trying the event many times and computing how often the desired outcome occurs
In order for an empirical probability to be accurate,
it must be based on a very large number of trials
theoretical probability
determined by using your knowledge of the situation and mathematical formulas to predict how often the desired outcome will occur in the future
parameter
a number based on a survey of the entire population
statistic
a number based on a survey of just a sample of the population
Statistics are used to estimate …
the true percentage (the parameter) for the whole population.
margin of error
helps us measure how far our statistic might be from the true percentage (the parameter).
=1/√n
n represents the total number of people in the sample
confidence interval
a tool for estimating a parameter. is the range of values you expect your estimate to fall between if you redo your test, within a certain level of confidence usually 95%
Confidence interval equation
Confidence interval=the statistic+-margin of error
C=x/n+-1/√n
x represents the number of people in the sample with the characteristic
n represents the total number of people in the sample