212 Stupid Quiz for losers and babies
1/47
Earn XP
Description and Tags
pissed
Name | Mastery | Learn | Test | Matching | Spaced | Call with Kai |
|---|
No analytics yet
Send a link to your students to track their progress
48 Terms
Why do we need design research?
Our design does not always work as we planned.
Research helps us to do a better job.
How to study Environment-Behavior relationships
Design Challenge
Literature Review
Empirical Research
Design Innovation
Design Challenge
How can something be improved?
Literature Review
Identifying and critically evaluating existing literature on a specific topic/research question.
Empirical Research
Propose a specific research question, select appropriate data collection methods, collect and analyze data.
Appropriate data collection methods
Observation
Survey
Interview
Simulation
Data
A collection of facts
Qualitative Data
Descriptive (think quality)
Nominal
Ordinal
Quantitative Data
Numerical (think quantity)
Discrete
Continuous
Nominal Data
Qualitative
Binary observations
(cat is black and gray/I am mad we have a quiz tomorrow)
Ordinal Data
Qualitative
To what degree is something
(cat is somewhat cute/I am very mad we have a quiz tomorrow)
Discrete Data
Quantitative
Whole, specific, unchanging, (for the most part) numbers (I think past values?)
(cat has 4 legs/I have cursed this class twice in the last hour)
Continuous Data
Quantitative
Integers that can change at any moment (present values?)
(cat weighs 5 pounds/my heart rate is 150 bpm right now)
Qualitative Research
To understand topics from personal perspectives.
Researchers immerse themselves and identify patterns; raw data transferred to narratives
Observation→Pattern→Hypothesis→Theory
(bass have gills, they are fish→groupers have gills, they are fish→etc.→all fish have gills)
Quantitative Research
To explain phenomena by examining relationships
between empirically measured variables.
To generalize findings and contribute to theory
Theory→Hypothesis→Observation→Confirmation
(all bass have gills→this is a bass→therefore it probably has gills)
Variable
any characteristic or quality that differs in degree or kind and can be measured.
Independent
Dependent
Control
Confounding
Independent Variable
Predictor (amount of ice cream eaten directly affects)
Dependent Variable
Outcome (weight gain)
Control Variable
Variable that will remain constant in a study (kind of ice cream)
Confounding Variable
Uncontrollable variable which ranges from person to person (amount of exercise, diet, etc.)
Quantitative Research Design
Experimental
Non-experimental
Qualitative Research Design
Phenomenology
Ethnography
Case study research
Grounded theory
Historical research
Mixed Methods
Sequential
Concurrent
Transformative
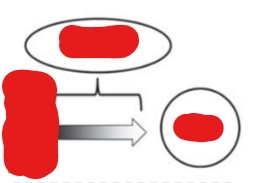
Post-occupancy study
Environmental Intervention (top)
Test (right)
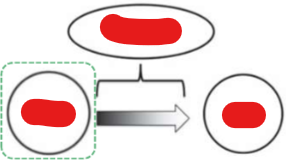
Pre- and post-occupancy study
Environmental Intervention (top)
Test (right)
Pre-test (left)
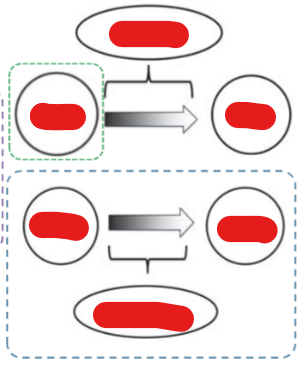
Quasi-experimental study
TOP LEVEL
Environmental Intervention (top)
Test (right)
Pre-test (left)
BOTTOM LEVEL
No Intervention (bottom)
Group 2 Test (right)
Group 2 Pre-test (left)
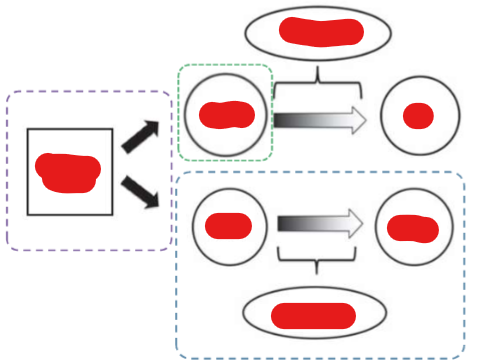
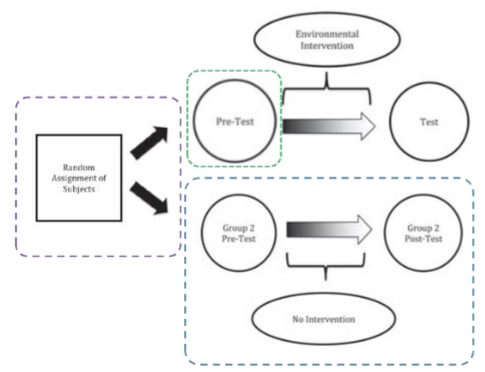
Experimental study
TOP LEVEL
Environmental Intervention (top)
Test (right)
Pre-test (left)
BOTTOM LEVEL
No Intervention (bottom)
Group 2 Test (right)
Group 2 Pre-test (left)
Random assignment of subjects (far left)
Population
The entire set of possible cases
Sample
A subset of the population from which data are collected
Representative Sample
A subset of the population from which data are collected that accurately reflects the population.
Sampling Bias
Systematic favoring of certain outcomes due to the methods employed to obtain the sample.
Sample Methods
Simple Random Sampling
Convenience Sampling
Simple Random Sampling
A method of obtaining a sample from a population in which every member of the population has an equal chance of being selected.
Convenience Sampling
A method of obtaining a sample from a population by ease of accessibility; such a sample is not random and may not be representative of the intended population.
Measurement Methods
Self-reports
Observation
Instrumental Recording
Indirect Measures
Self-reports
Cognitive Mapping
Interview & focus groups
Surveys
Observation
Get the big picture, watch what people do in their environments
Answer specific questions
Statistical analysis
Instrumental Recording
Image Recording
Physiological recording
Movement measurement
Environment recording
Indirect Measures
Archives (sales/medical records)
Physical Aggregation (graffiti/trash)
Physical Erosion (path erosion/maintenance)
Demographic Data
Obesity Epidemic Statistics
42.4% of American adults are obese
1/5 American children are obese
Global obesity has almost tripled since 1975
In 2016, 39% of adults globally were overweight and 13% obese
340 million people aged 5-19 were overweight/obese in 2016
Obesity Epidemic Cause
Bad Design
Genetics + Energy Imbalance
Energy Imbalance
Energy Intake > Energy Exertion
(Unhealthy Diet + Physical Inactivity)
Active Living
A way of life that integrates physical activity into daily routines.
Needs support from physical environments.
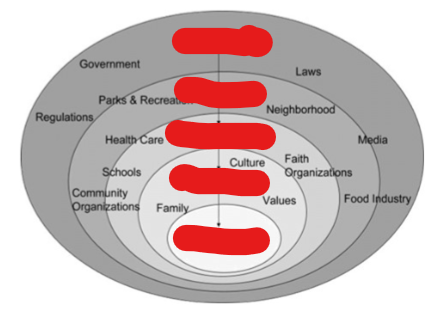
Socio-ecological Model
Public Policy
Community
Organizational
Interpersonal
Individual
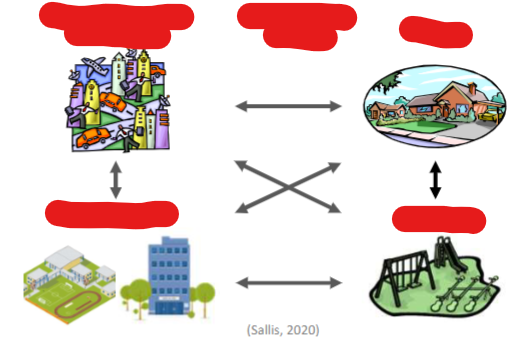
Elements of an Active Living Community
Community Design Destinations
School/Work
Home
Park & Rec
Transportation System
3 D’s + R
Destination
Distance
Density
Route
Key Features of Walkable Communities
• High density
• Mixed land uses
• Connected street systems
• Short distance to destinations
• Human-scale design
Key Features of Auto-Dependent Communities
• Low density
• Segregated land uses
• Disconnected street systems
• Long distance to destinations
• Auto-oriented design