AH Biology - Unit 3 - KA2(e) - Presentation of Data
1/28
There's no tags or description
Looks like no tags are added yet.
Name | Mastery | Learn | Test | Matching | Spaced |
|---|
No study sessions yet.
29 Terms
What are the three types of data that discrete and continuous variables can give rise to?
The three types of data that discrete and continuous variables can give rise to are:
Qualitative
Quantitative
Ranked
What is qualitative data?
Qualitative data is data that is grouped into categories by counting the number in each category. It is subjective and descriptive. For example, the colour of an organism.
What is quantitative data?
Quantitative data is data that is measured on a numerical scale. It is objective. For example, weight in kilograms.
What is ranked data?
Ranked data is type of data transformation in which numerical values are replaced with a rank when the data is sorted from lowest to highest or vice versa.
What is the format of graphs and statistical tests determined by?
The format of graphs and statistical tests is determined by the type of data that is collected.
What kind of graph would be used for qualitative data?
A bar graph would be used for qualitative data.
What kind of graph would be used for quantitative data?
A line graph would be used for quantitative data.
What is the mean?
The mean is the average.
What is the median?
The median is the middle number.
What is the mode?
The mode is the most frequent number.
What can boxplots be used to do?
Boxplots can be used to represent variation within and between data sets.
What is the interquartile range?
The interquartile range is the difference between the lower and upper quartile.
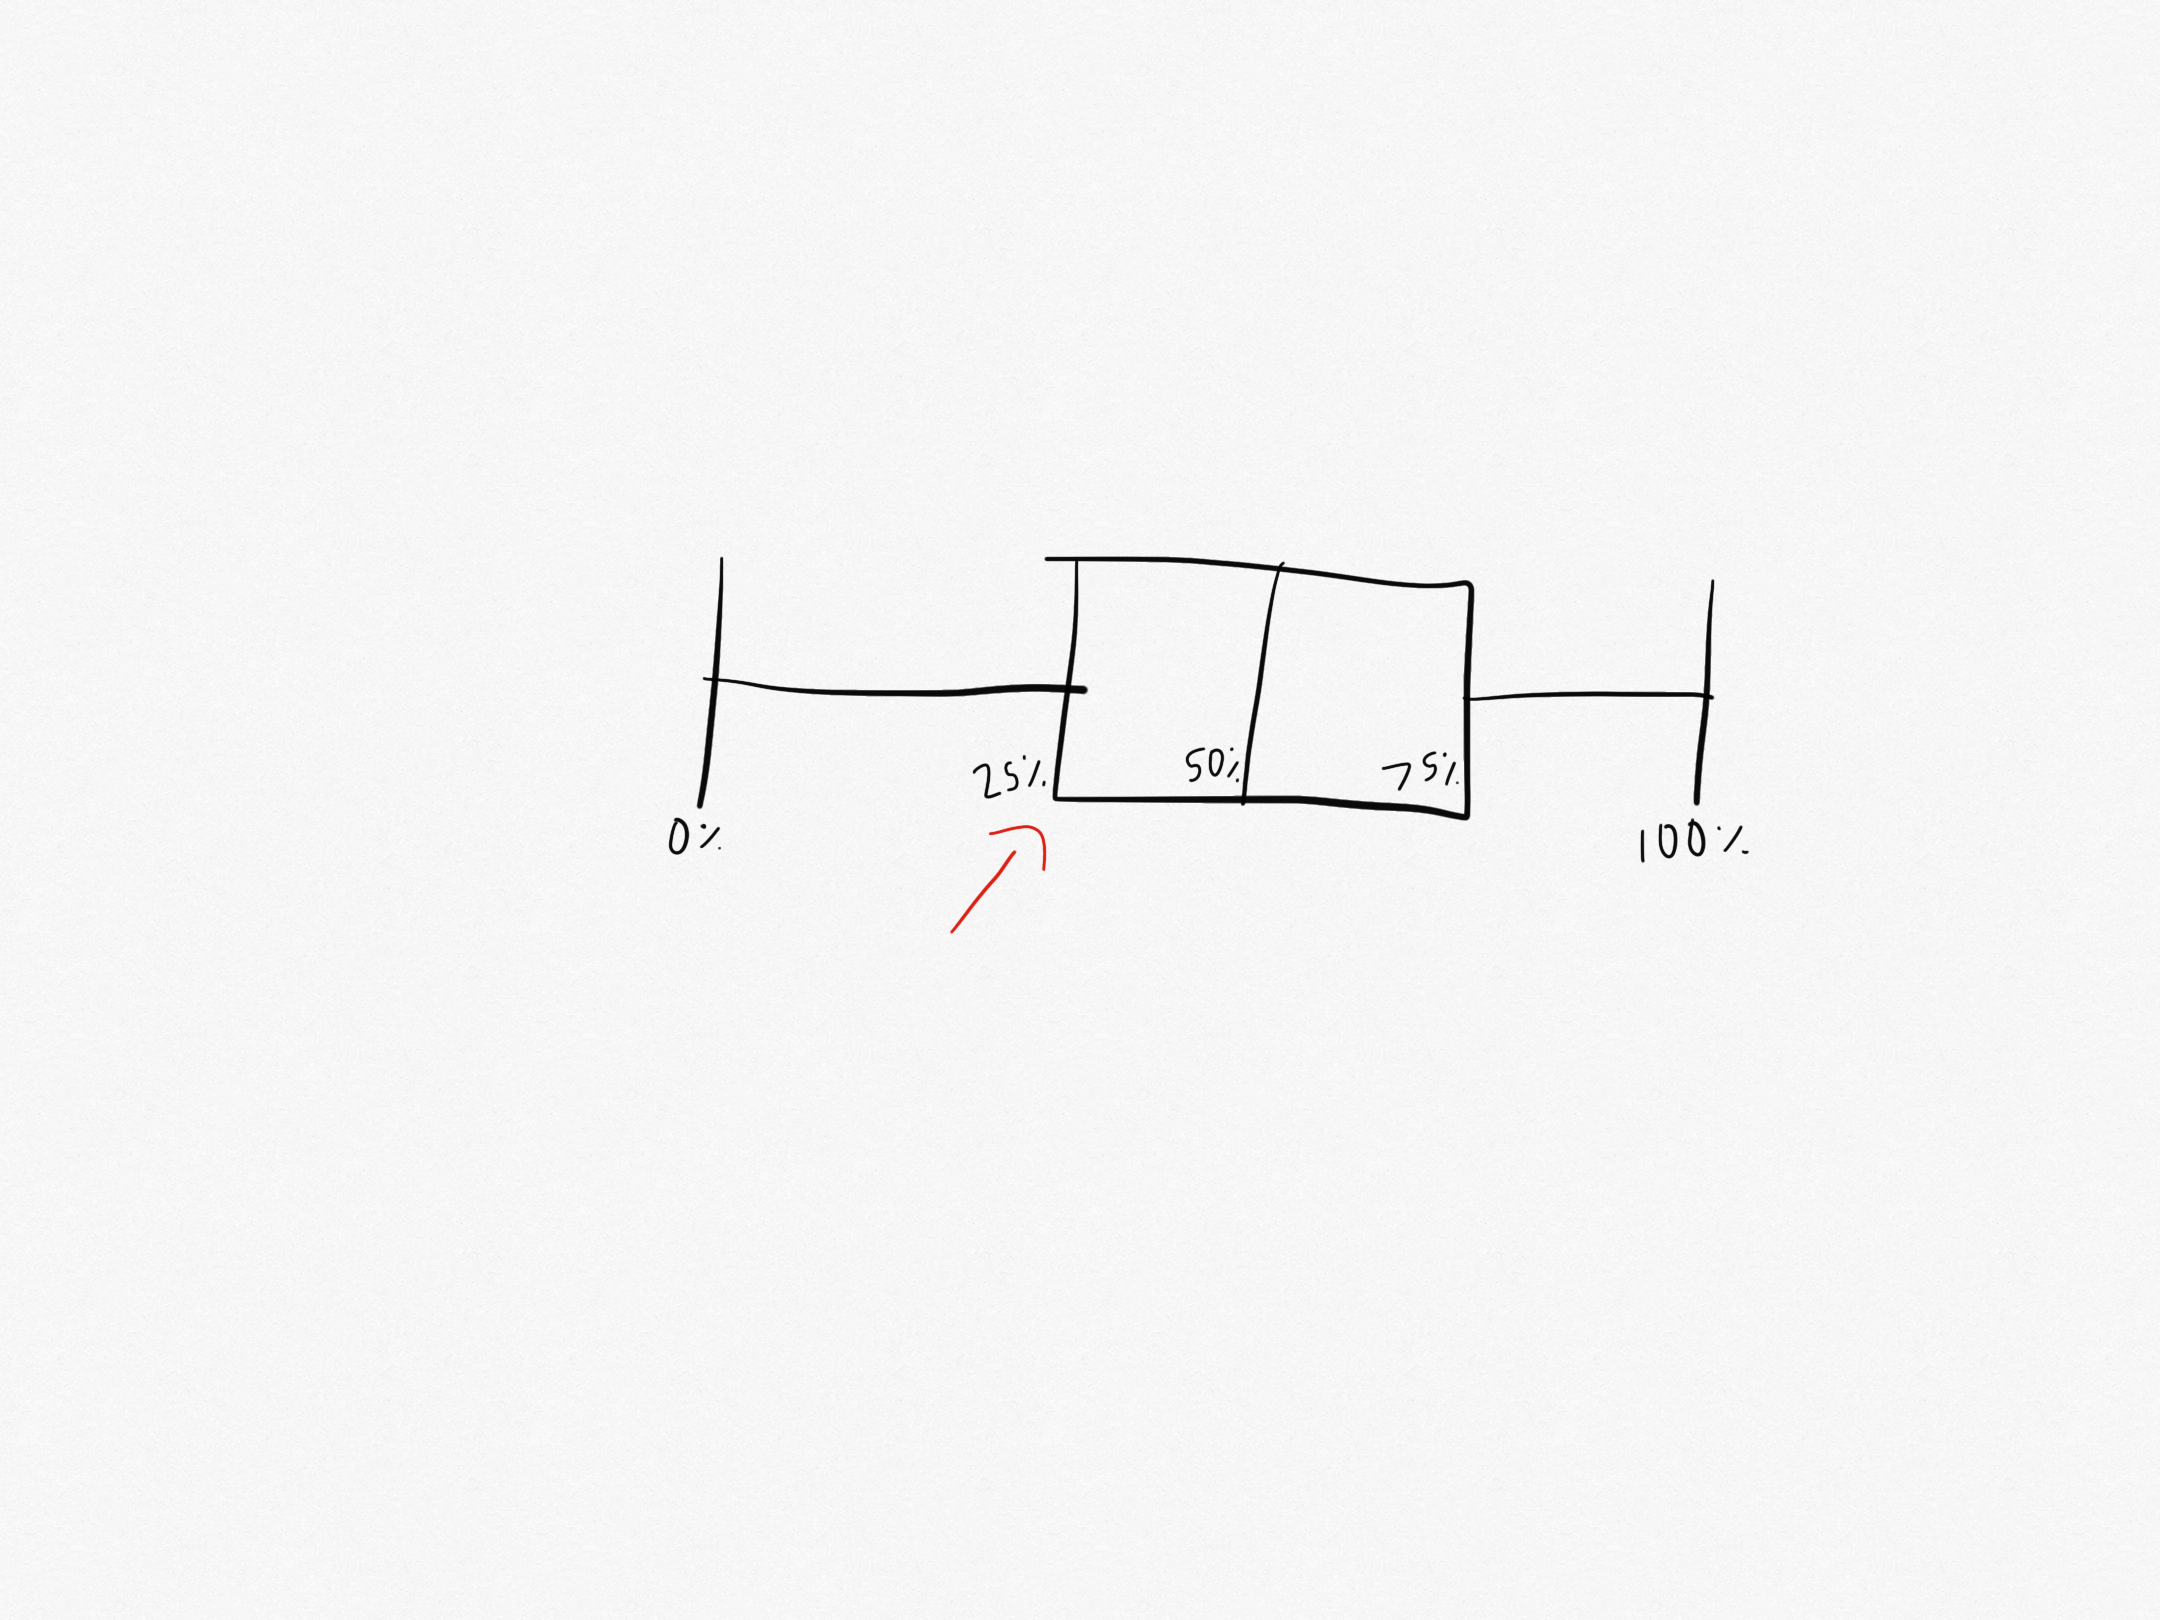
What part of the box plot is this?
That is the lower quartile. It is the median of the lower half of the data set.
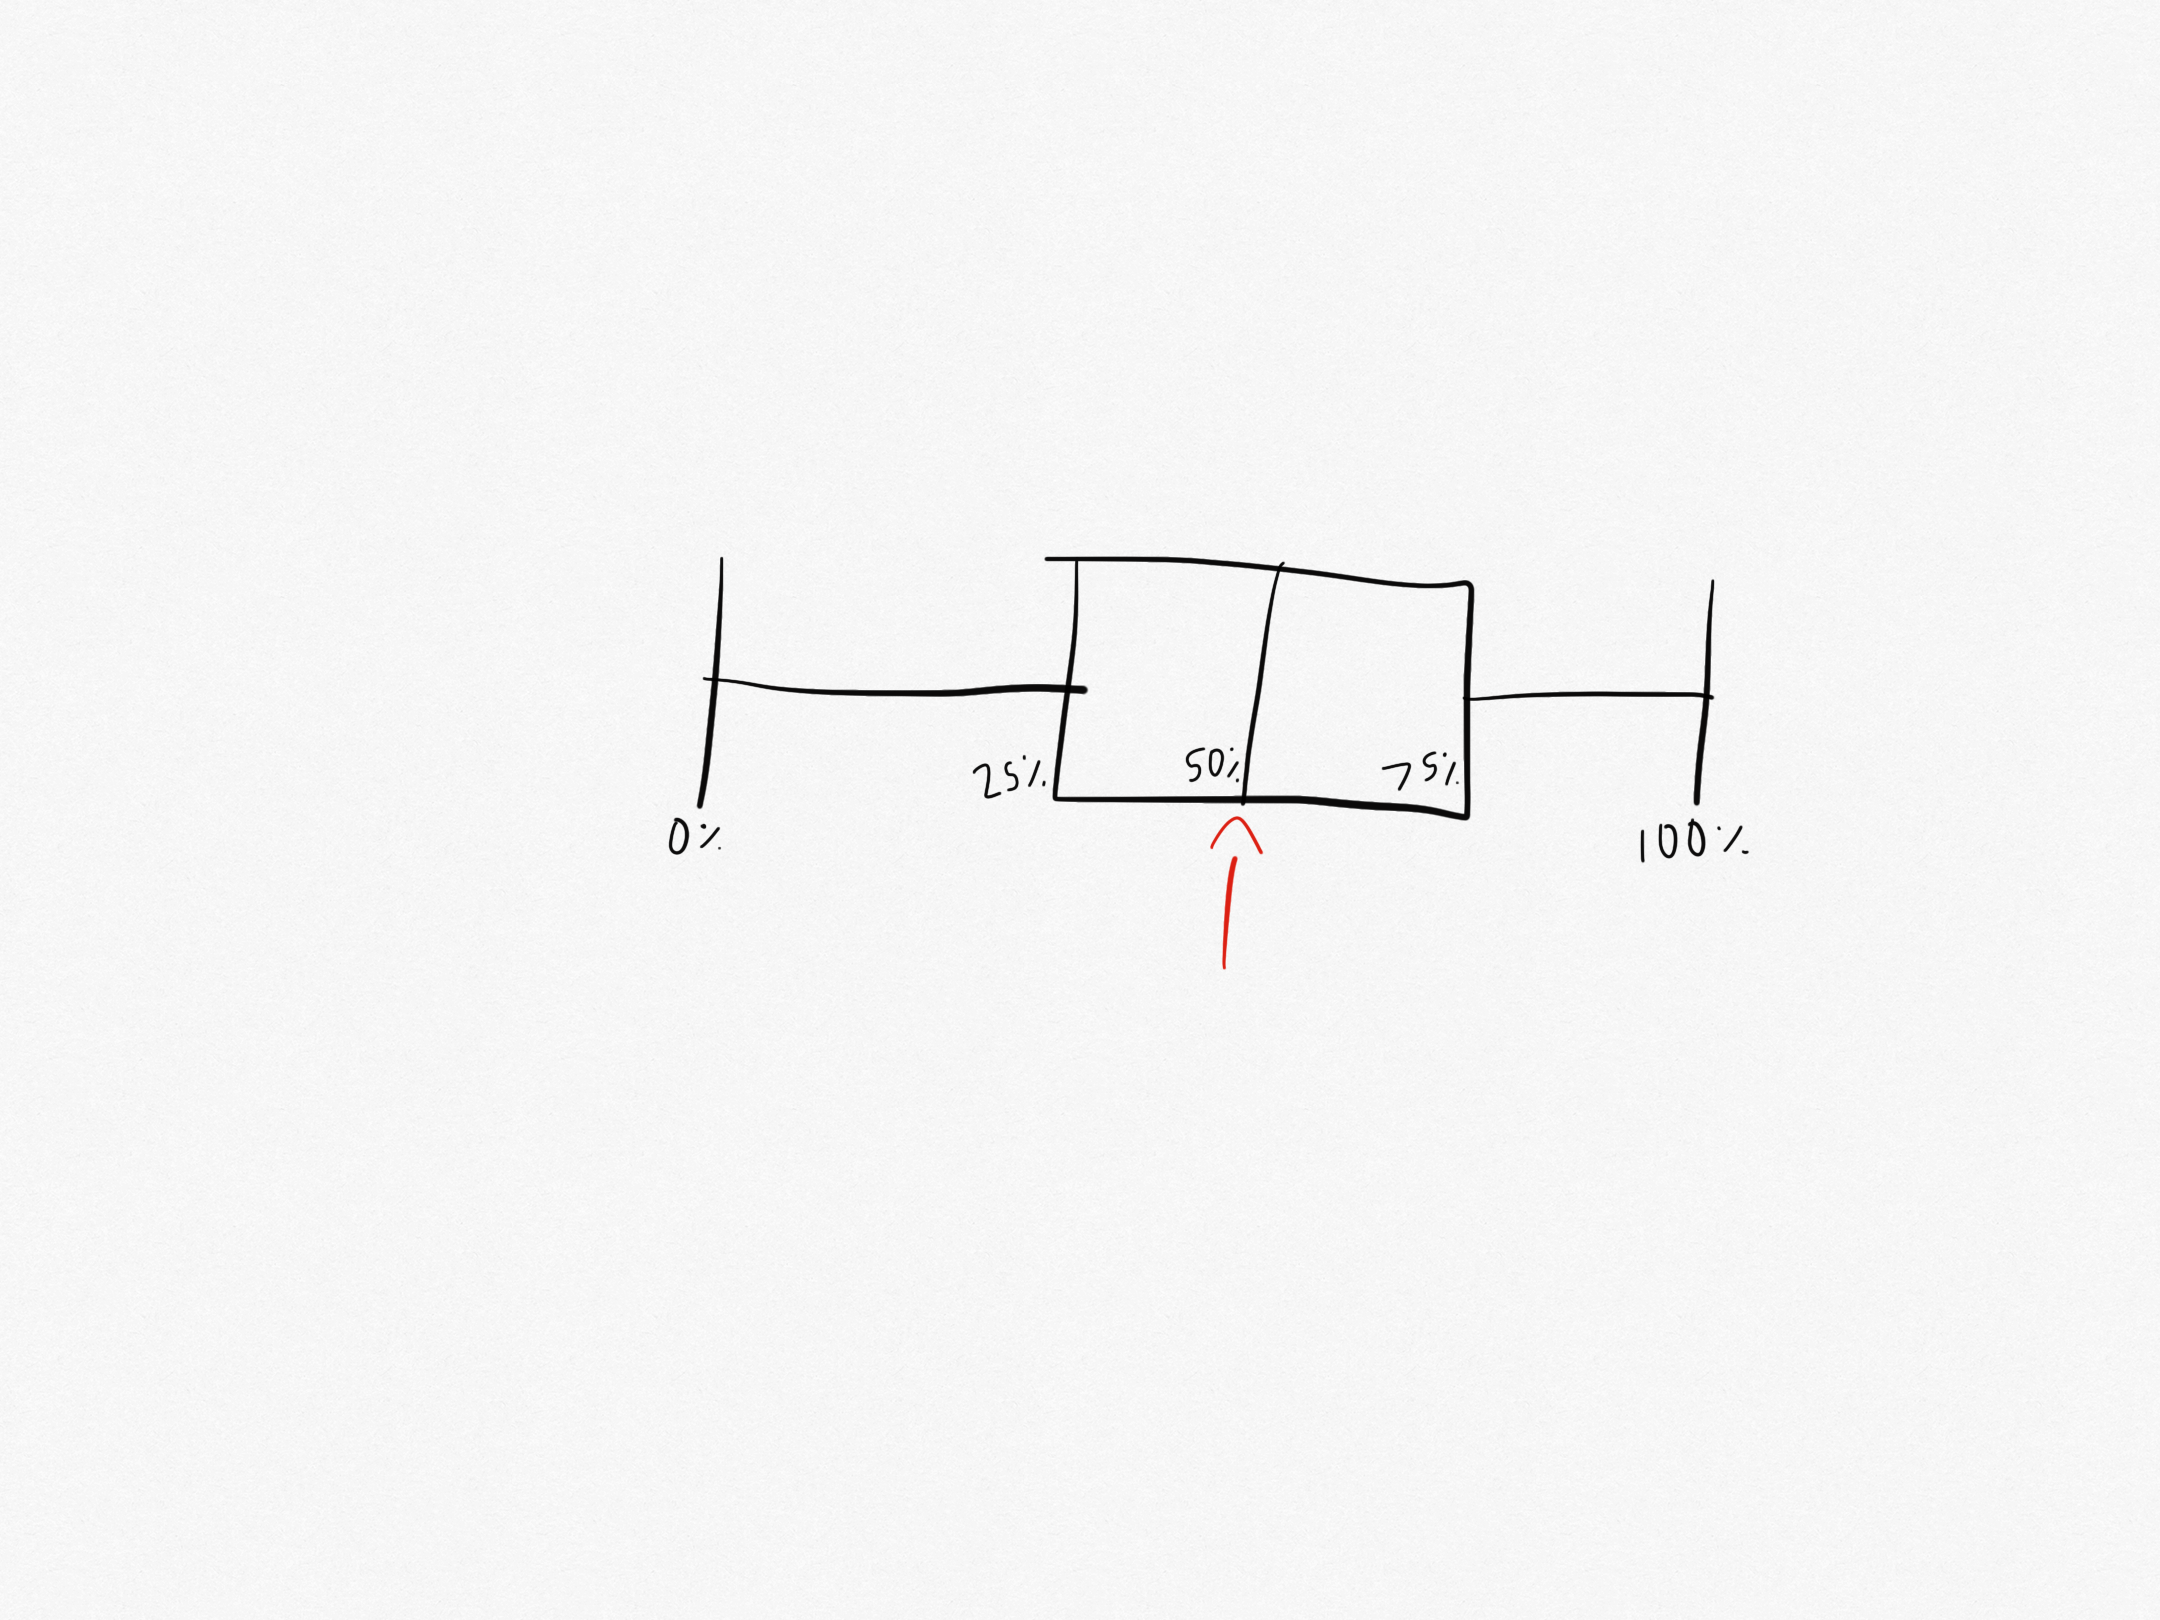
What part of the box plot is this?
That is the median. It is the number in the middle of the sequence of data.
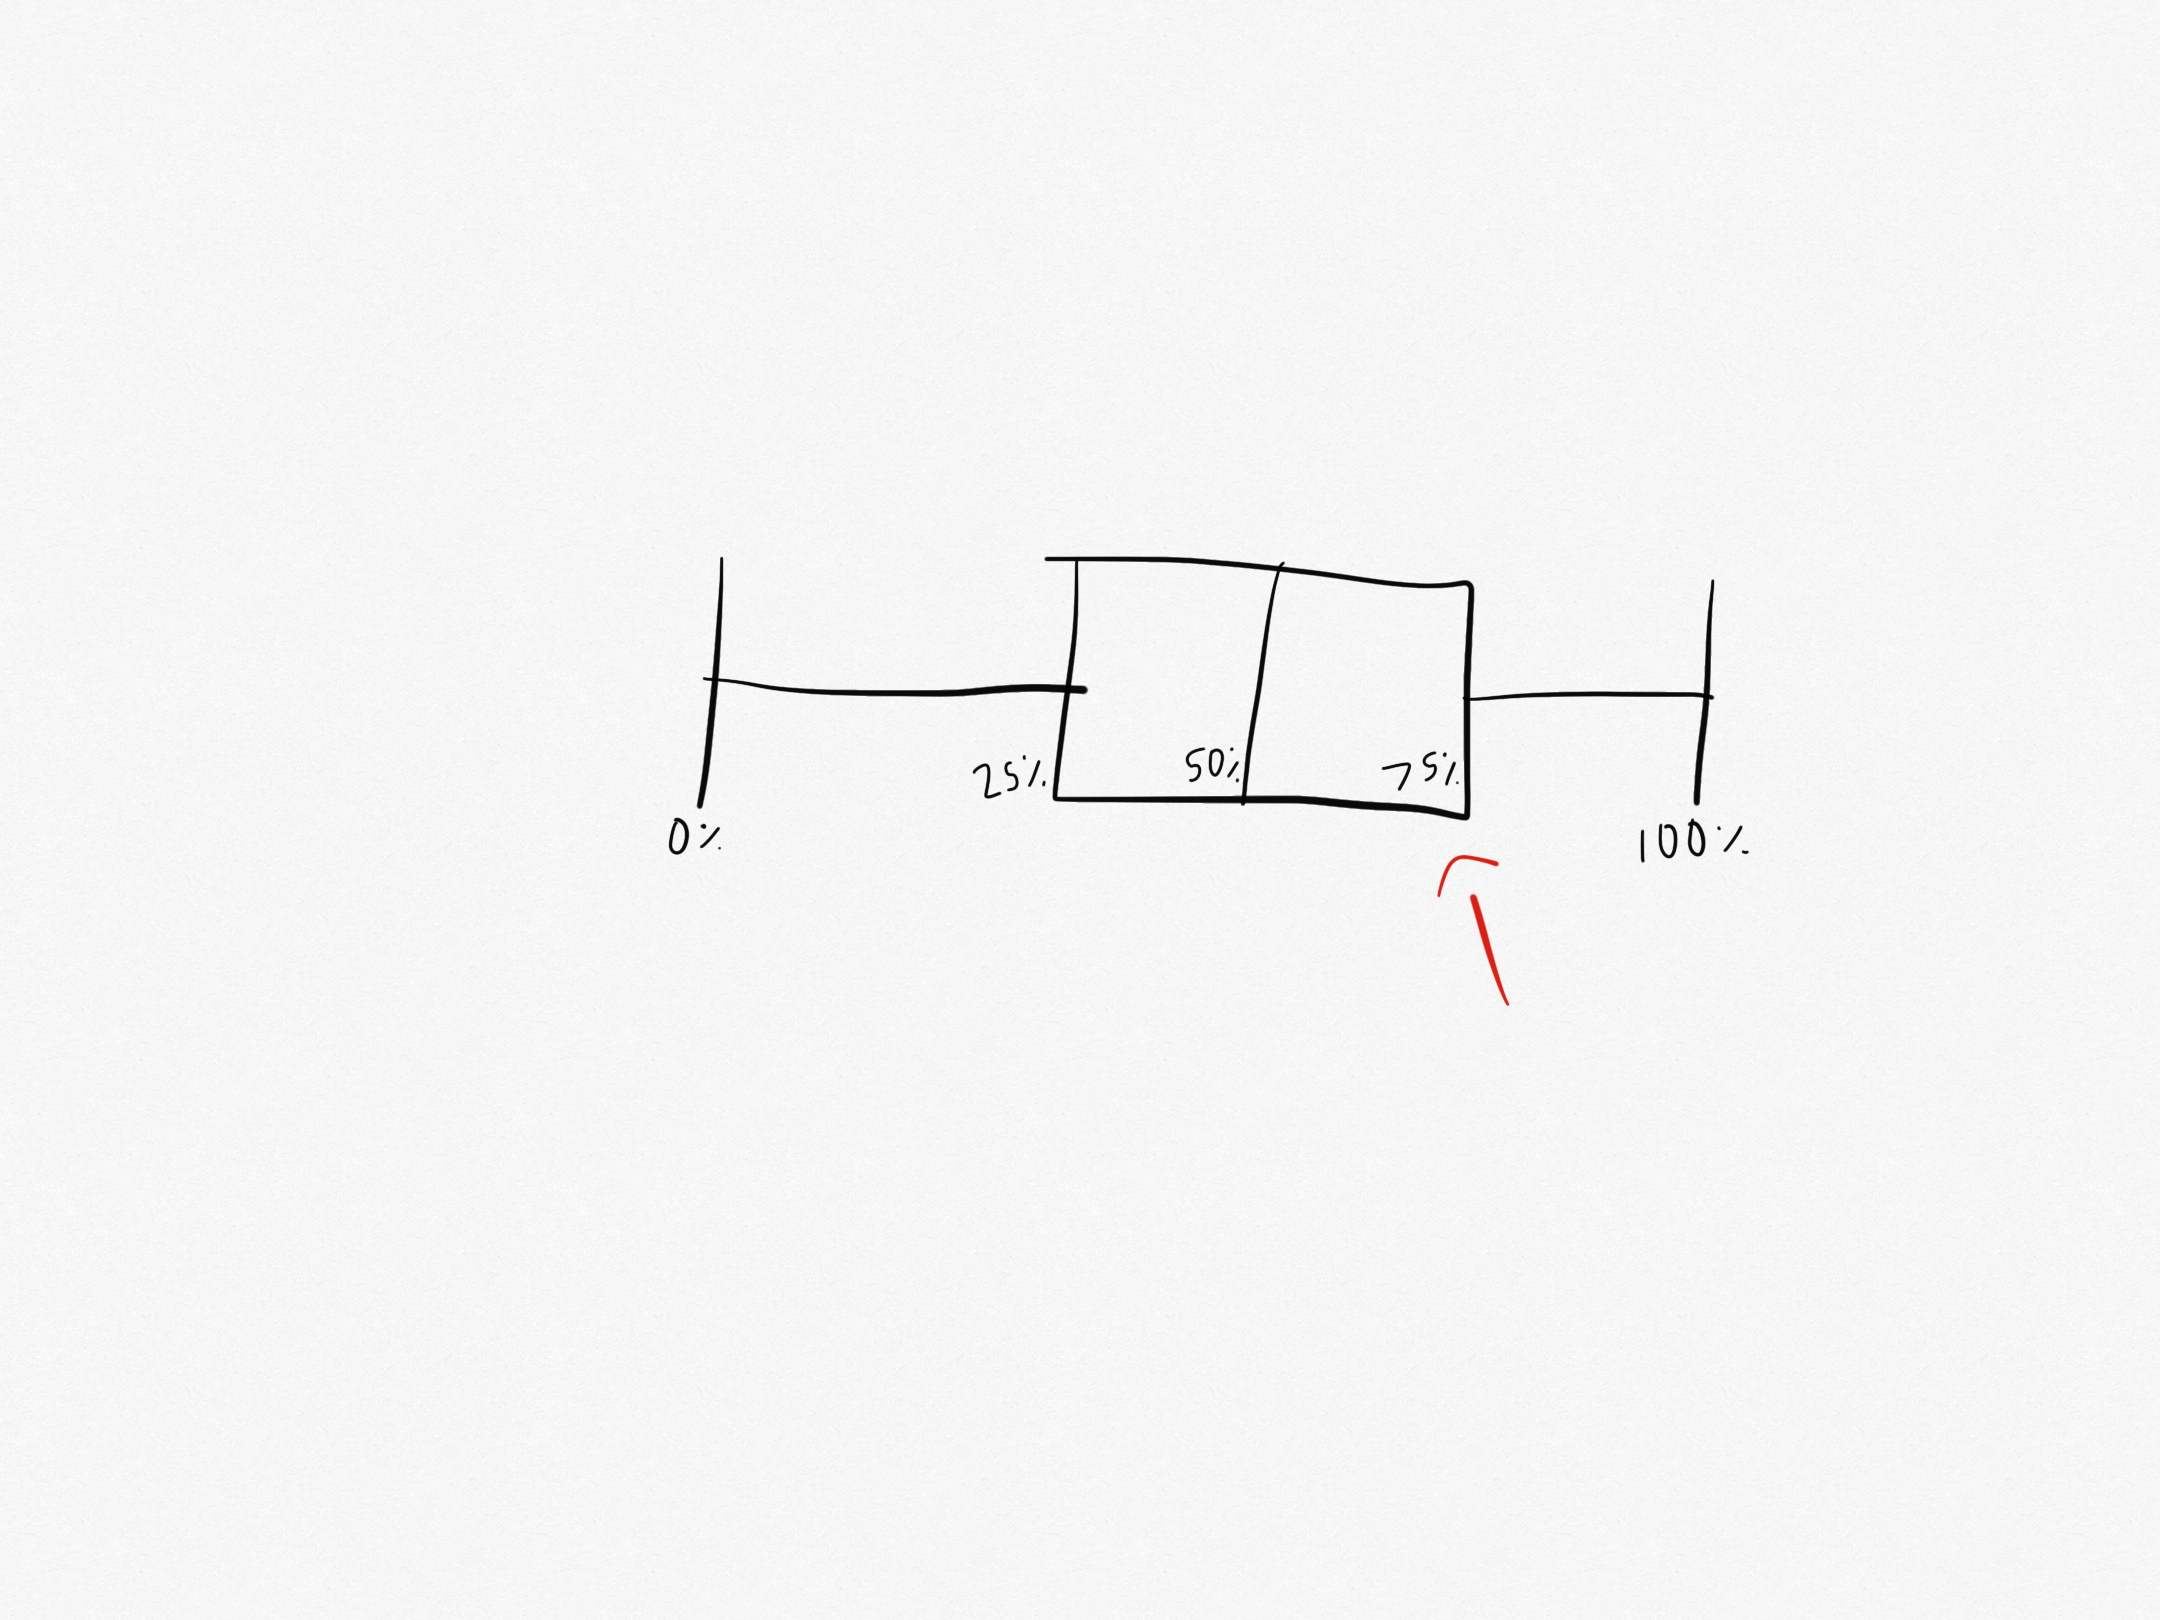
What part of the box plot is this?
That is the upper quartile. It is the median of the upper half of the data set.
What are error bars used for?
Error bars are used on graphs to show the variation at each data point.
What can error bars be?
Error bars can be:
Range bars
True error bars
What are range bars?
Range bars are a type of error bar that show the highest and lowest values in repeats for each data point.
What are true error bars?
True error bars are a type of error bar that show the standard deviation for each data point.
What is the relationship between the size of the error bar and amount of variation in the data?
The relationship between size of the error bar and the amount of variation in the data is the smaller the error bar, the less variation in the data.
How do you judge significance when looking at error bars?
When looking at error bars you judge significance by seeing if the error bars overlap.
What does it mean if error bars overlap?
If the error bars overlap then the two points are not significantly different from each other and could be due to chance alone.
What does it mean if the error bars do not overlap?
If the error bars do not overlap then the two points are significantly different and are unlikely to be due to chance alone
What is a correlation?
A correlation is when there is a relationship between two variables.
What is causation?
Causation is when a change in the independent variable value is known to cause the change in the dependent variable values.
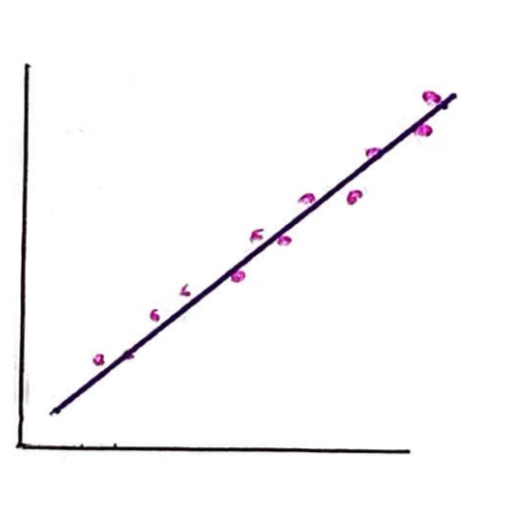
What kind of correlation is this?
This is a strong positive correlation. As x increases, so does y and the spread of data points lies close to the line of best fit.
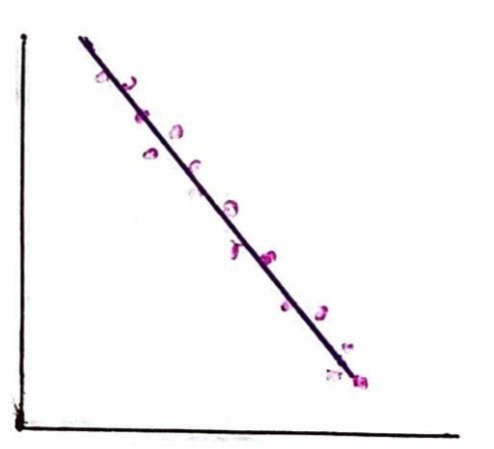
What kind of correlation is this?
This is a strong negative correlation. As x increases, y decreases and the spread of data points lies close to the line of best fit.
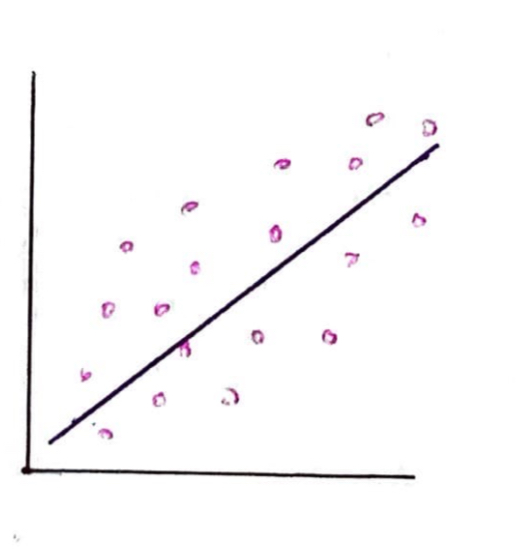
What kind of correlation is this?
This is a weak positive correlation. As x increases, so too does y and the spread of the data points is widely spread from the line of best fit.
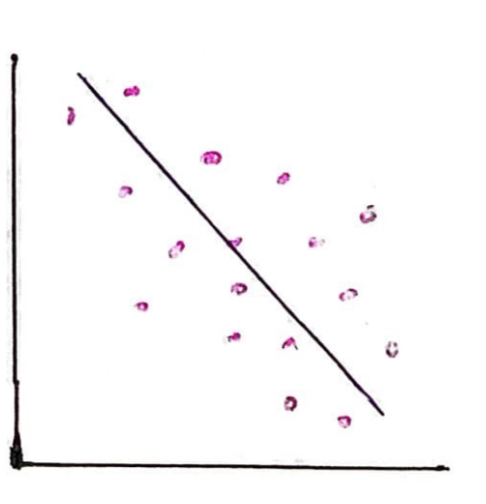
What kind of correlation is this?
This is a weak negative correlation. As x increases, y decreases and the spread of the data points is widely spread from the line of best fit.