Calculations & Statistics - OCR A Level Biology
1/41
There's no tags or description
Looks like no tags are added yet.
Name | Mastery | Learn | Test | Matching | Spaced | Call with Kai |
|---|
No analytics yet
Send a link to your students to track their progress
42 Terms
You want to know if there is an association between different measurement from the same sample, use...
Spearman's Rank Correlation
You have counted the number of individuals in two or more categories, use...
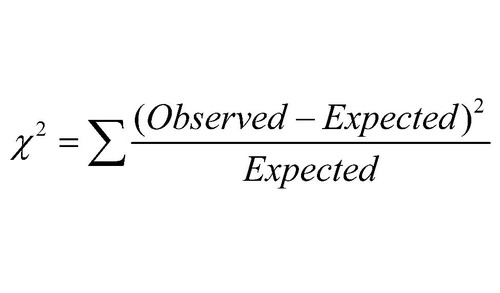
Chi squared test
You want to look at the spread of data about the mean, use...
Standard deviation
You want to compare two sets of data, the data sets are collected from the same individuals, use...
paired t-test
You want to compare two sets of data, the data sets are no collected from the same individual, use...
unpaired t-test
When can you use chi squared?
sample size over 20, only discontinuous data
Null hypothesis for chi squared
no difference between observed and expected results
If x2 is greater than critical value...
difference is not due to chance and the null hypothesis is rejected
How do you choose the number of degrees of freedom in chi squared?
n-1
(n= number of categories)
chi squared
What is the significance level?
5%
what percentage probability we are happy to accept for there to be a mistake in our conclusion
What is the null hypothesis of unpaired t-test?
The means of both groups are equal.
How do you choose the number of degrees of freedom in the unpaired t-test?
(nA + nB) - 2
(ie number of categories in group A but number of categories in group B -2)
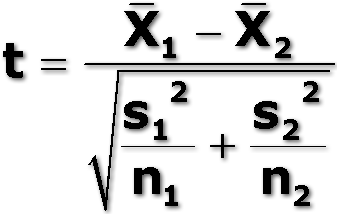
unpaired t-test
x= mean s= standard deviation n= number of categories
If t is bigger than the critical value in an unpaired t-test...
reject the null hypothesis, the two means are not equal
paired t-test
t =(d√n)/ sd
d= mean difference n= number of categories sd= standard deviation
How do you decide the number of degrees of freedom for the paired t-test?
n-1
(number of categories - 1)
If t is much bigger than the critical value in the paired t-test...
the difference is not due to chance
Spearman's rank- how to rank data
1 onwards, 1 being largest
2 groups, 1 labelled and ranked as x, the other as y
Spearman's rank- after ranking the data...
find the difference between ranks (d), then find d^2 and the total of d^2
Spearman's rank
d^2= square of difference between data ranks n= number of paired data items
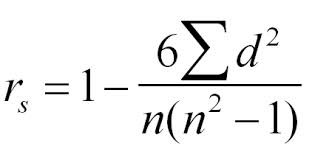
If rs is bigger than the critical value...
then we have evidence to reject the null hypothesis (H0) and accept H1- with 95% confidence there is a positive correlation between x and y
standard deviation
quantitative measure of the spread of data about the mean
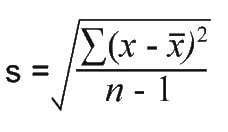
interpreting standard deviation
• The middle 68% of the data lie within one standard deviation either side of the mean • 95% of the data lie within 2 standard deviations either side of the mean.
Simpson's index of diversity
n= number of a particular species N= total number of organisms
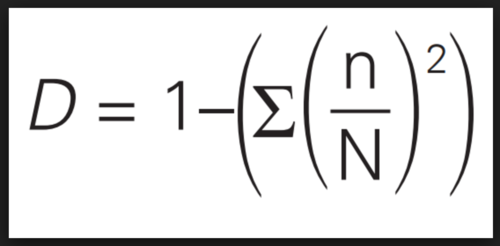
The higher the value of D...
the higher the diversity
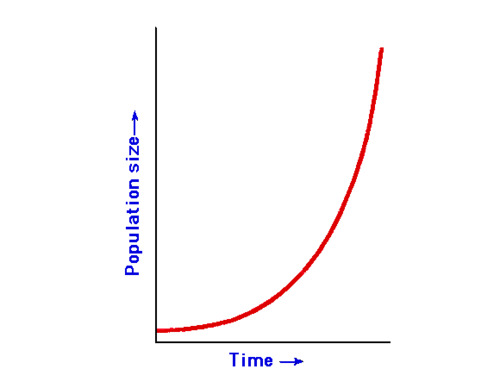
exponential graph
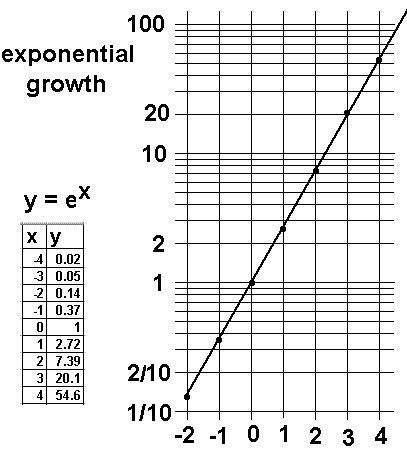
exponential log graph
percentage change=
(new-orginal/original) x100
percentage yield=
(actual/ theoretical)x100
percentage error (uncertainty)=
(2x absolute uncertainty/ quantity measured) x 100
magnification=
size of image/ size of real object
Rf=
distance moved by solute/ distance moved by solvent
rate =
change in quantity/ time taken
ratio=
SA/ V
proportion of polymorphic gene loci (genetic biodiversity)=
number of polymorphic gene loci/ total number of loci
cardiac output =
heart rate × stroke volume
Respiratory quotient
CO2 produced/ O2 consumed
Microorganism population growth N=
N0 × 2^n
Efficiency of biomass transfers=
(biomass transferred/ biomass intake) x 100
Temperature coefficient (Q10)=
R2/ R1
Hardy Weinberg principle
(p +q)^2= 1 (100%) so p^2 + 2pq + q^2 = 1 (100%)
p= dominant allele p^2= homozygous dom
q= recessive allele q^2= homozygous recessive 2pq= heterozygous