Algebra EOC Review
1/45
Earn XP
Description and Tags
Name | Mastery | Learn | Test | Matching | Spaced |
|---|
No study sessions yet.
46 Terms
Inspection
Recognition of a familiar pattern leading to immediate solution of a mathematical problem
Quadratic equation
Any equation containing one term in which the unknown is squared and notes in which it is raised to a higher power
Solution
value that when substituted in for the variable of an equation makes a true statement
inverse operation
An operation, such as subtraction, to undoes the effect of another operation; also known as an inverse function.
solution set
The set of values that satisfy an equation.
Factor
Any of the numbers or symbols in mathematics that, when multiplied together, form a product.
Zero Product Property
A property stating that if the product of two expressions or quantities is equal to zero, then at least one of the expressions or quantities is equal to zero.
trinomial
An algebraic expression with three terms.
quadratic trinomial
A trinomial that can be written in the form AX squared plus BX plus C where A is not equal to zero.
binomial
An algebraic expression with two terms.
parabola
A plane curve where any point is equidistant from a fixed point and a fixed straight line
Axis of symmetry of a parabola
The straight lines divides a parabola into two identical parts
vertex of a parabola
The highest or lowest point of a parabola that crosses its axis of symmetry.
zeros of a parabola
The points were a parabola intersects the X axis; the X values to make the quadratic equation equal to zero.
y-intercept of a parabola
The point where a parabola intersects the Y axis
Y equals AX squared plus BX plus C.
ellipsis in a sequence
An ellipsis in a sequence means that the sequence continues forever.
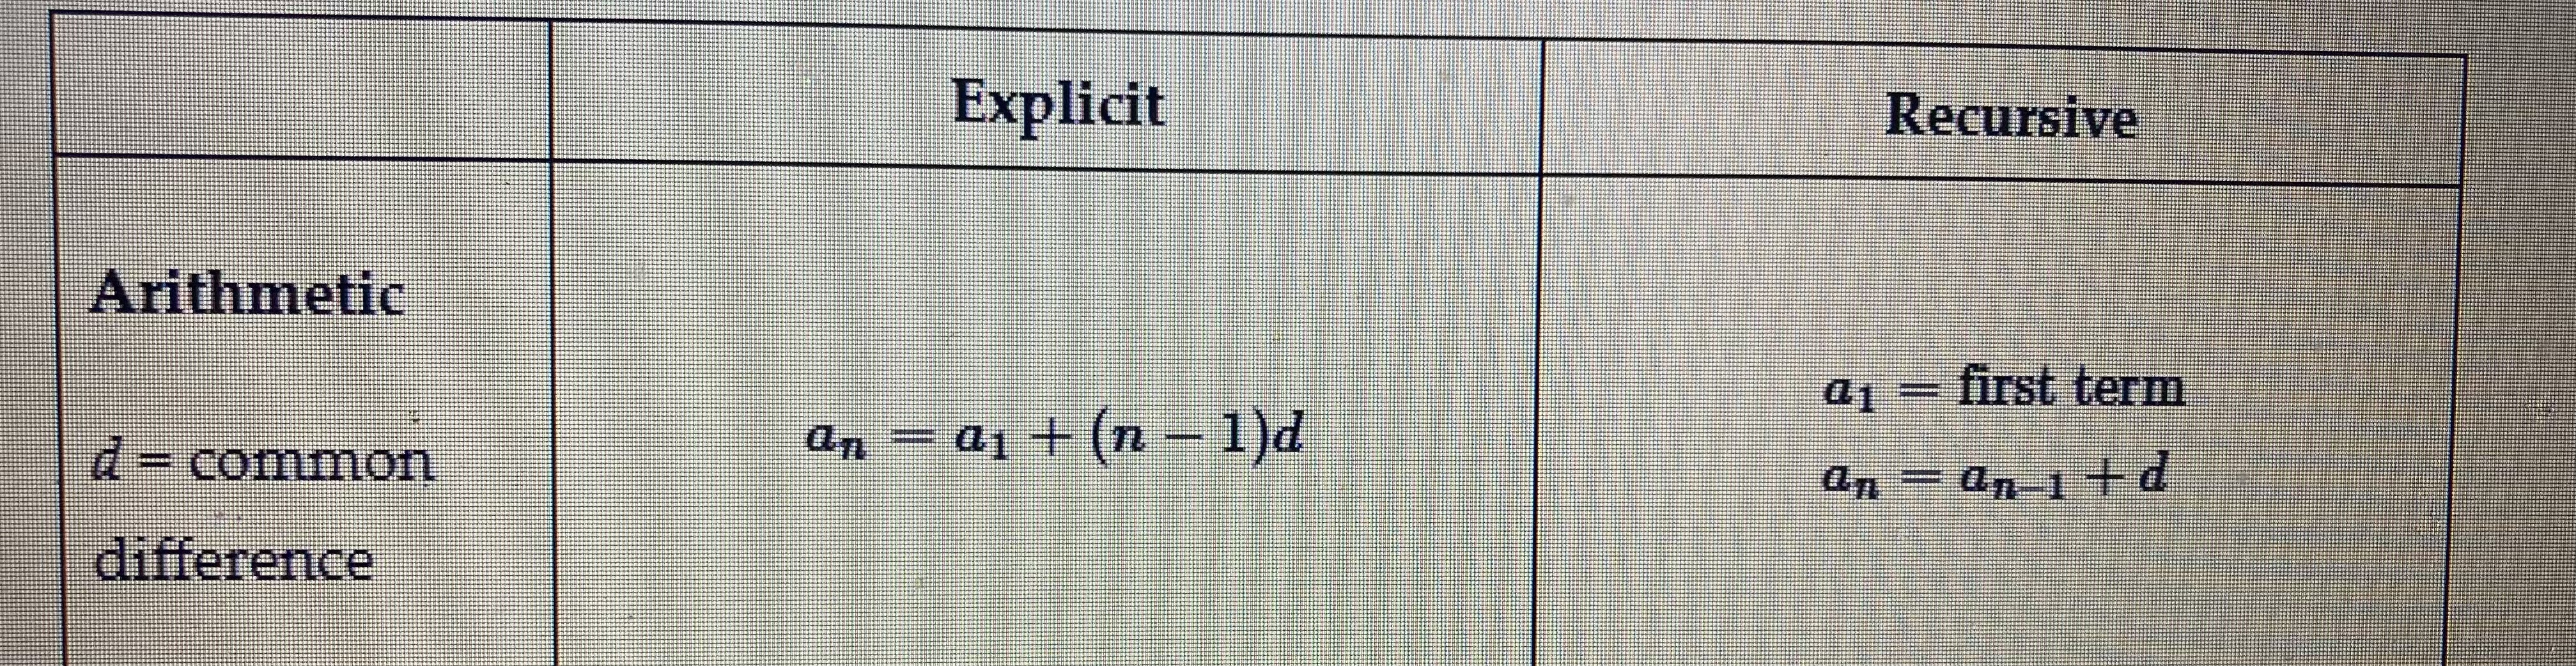
arithmetic sequence
An order list of terms in which the difference between any two consecutive terms remains constant
common difference
In an arithmetic sequence, the value of the difference between any two consecutive terms
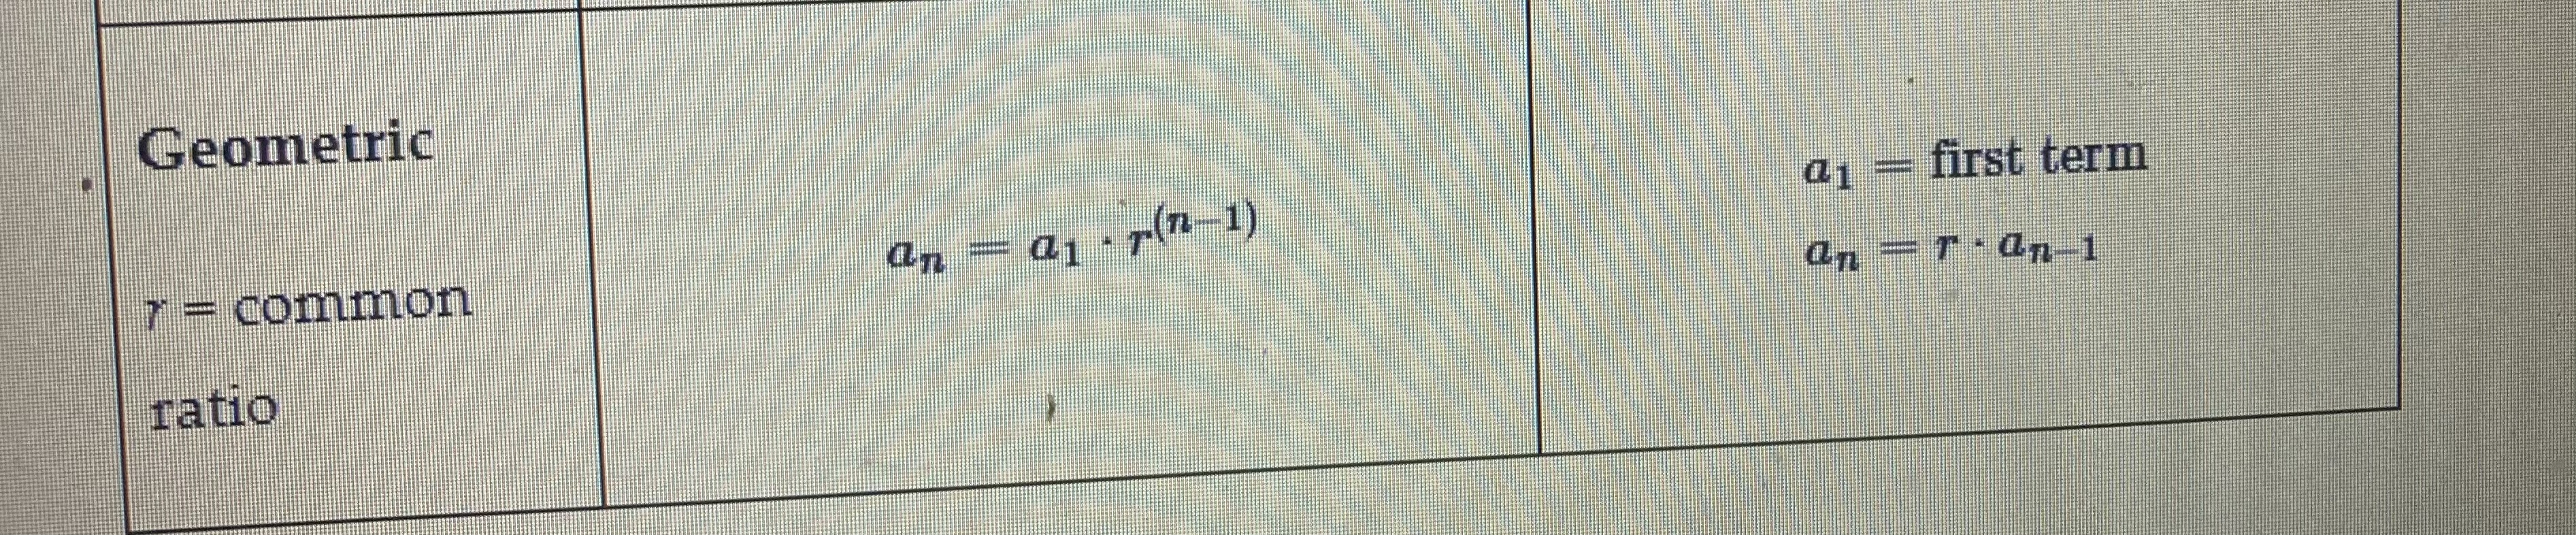
geometric sequence
An ordered list of terms which the ratio between any two consecutive terms remains constant
quadratic sequence
A sequence in which the terms are the output of a quadratic equation that is in which the index is raised the second power and no higher
recursion
The determination of a succession of elements, such as numbers or functions, by operation on one of our proceeding elements according to a role or formula involving a finite number of steps
“nth term”
the number corresponding to a number in the index.
index
A natural counting number that indicates the position of a term in a sequence starting with one or zero.
fibonacci sequence
A recursive sequence where the first two terms are zero and one.
common ratio
In a geometric sequence, the value of the ratio between any two consecutive numbers
Arithmetic formula
Geometric formula
exponential growth
there must be a common ratio that applies consistently to all values, and the value in the sequence must be increasing. in the case of exponential growth, the growth factor will always be greater than one. that is because the function is increasing by a certain percentage of time, so it will keep getting larger. for example if the function is doubling the next valuable beat twice as large as the proceeding value.
exponential decay
exponential decay describes the process of reducing an amount by consistent percentage over a period of time. An example of decay might be the sequence one ½ ¼ 1/8 1/16 and so on. just as an exponential growth sequences the next term of the sequence is determined by a common ratio. however, for sequences that model decay, the ratio is between zero and one, meaning the terms will decrease as the other term number increases. you can apply the geometric sequence formula to find any given term in the sequence.
Slope
The steepness of a line found by dividing the change in the Y value by the change in the X value. y2-y1/x2-x1
transformation
A manipulation of a function so that its graph is translated, reflected, rotated, or dilated.
parent function
A function without transformations. A parent function is in the most basic form of a function that shows the relationship between the independent and dependent variables.
Family of functions
A set of functions created from a transformation of a parent function. families of functions are created by reflections translations and dilation of parent functions.
reflection
The transformation that reflects the graph of a function over a horizontal or vertical line.
If a reflection is vertical, it is a reflection over the X axis. (x,-y)
If a reflection is horizontal it is a reflection over the Y axis. (-x, y)
translation
A translation is a transformation that shifts the graph of a function vertically or horizontally.
dilation
A dilation is a transformation that stretches or compress the graph of a function horizontally or vertically.
modeling horizontal reflections
To model a horizontal reflection, you must move the line or point to its negative x value. the y value remains the same.
modeling vertical reflections
to reflect a point or line vertically, you must convert the y value to its negative counterpart. the x value remains the same.
modeling horizontal translations
when modeling horizontal translations, note that they may appear “backwards”. to shift a function forward, use subtraction.
even and odd functions
even functions are functions that return the same expression for both X and -X. this means that f(x) is an even function when f(-x) = f(x). and even functions table of values will also have symmetric values.
odd functions do not return the same value for f(x) and f(-x).
format of a function
usually followed by an expression to which it equates, as in, f(x)=a(x)+b.
equation as a function
resembles writing an expression equal to the variable y, or y=a(x)+b
mean
A measure of the center of a data set found by adding all items in a set and dividing by the total number of items.
median
The middle value in an order set of data or the mean of the two middle numbers.
left-skewed data
Left skewed data means that most of the data points are on the higher end of the range on the right side of the graph.
right-skewed data
Right-skewed data means that most of the data points on the lower end of the range on the left side of the graph.