Gap & Go Charts
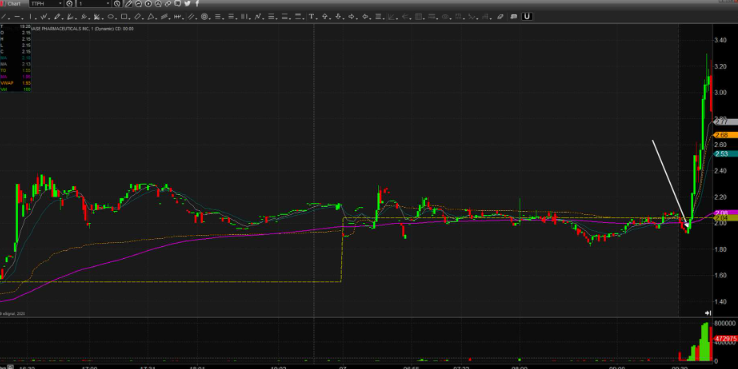
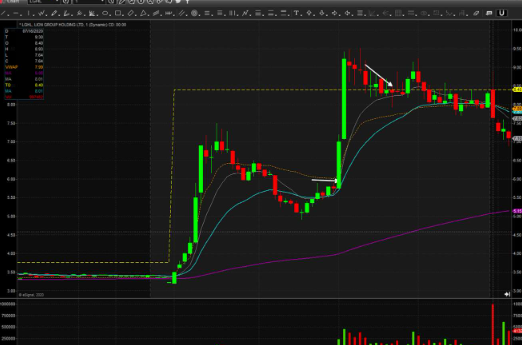
What Gap & Go trading strategy does this image represent?
The First Pullback 1-min (After a Red/Green)
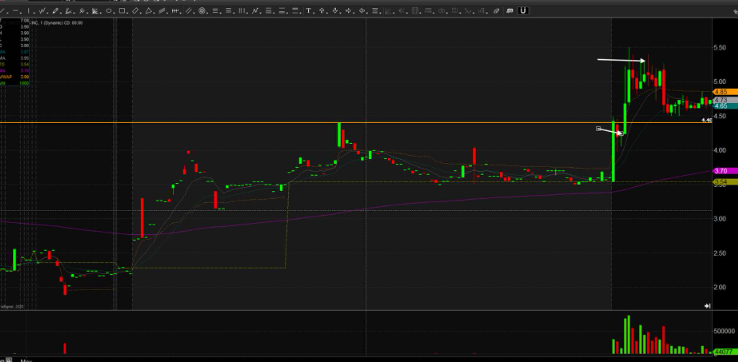
What Gap & Go trading strategy does this image represent?
The First Pullback 1-min
1/72
There's no tags or description
Looks like no tags are added yet.
Name | Mastery | Learn | Test | Matching | Spaced |
|---|
No study sessions yet.
73 Terms

What Gap & Go trading strategy does this image represent?
The First Pullback 1-min (After a Red/Green)

What Gap & Go trading strategy does this image represent?
The First Pullback 1-min
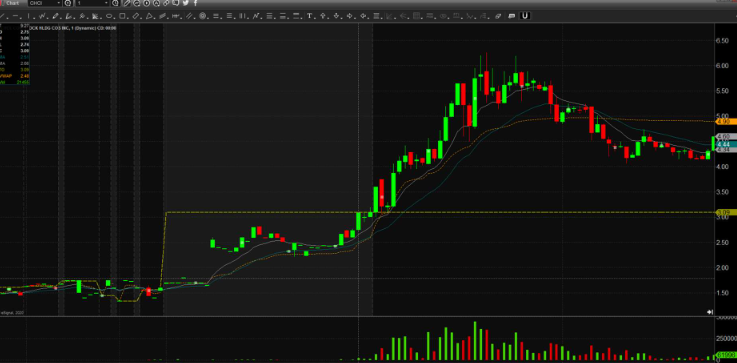
What Gap & Go trading strategy does this image represent?
The First Pullback 1-min
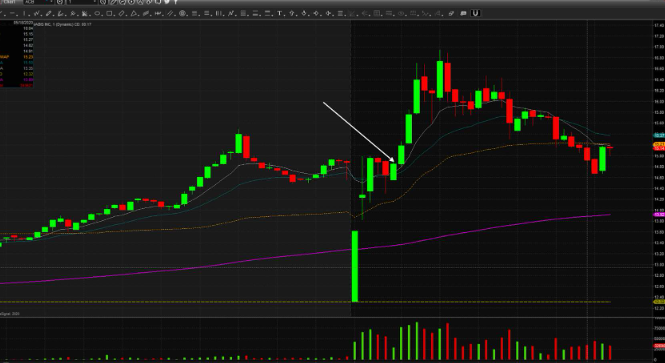
What Gap & Go trading strategy does this image represent?
The First Pullback 1-min
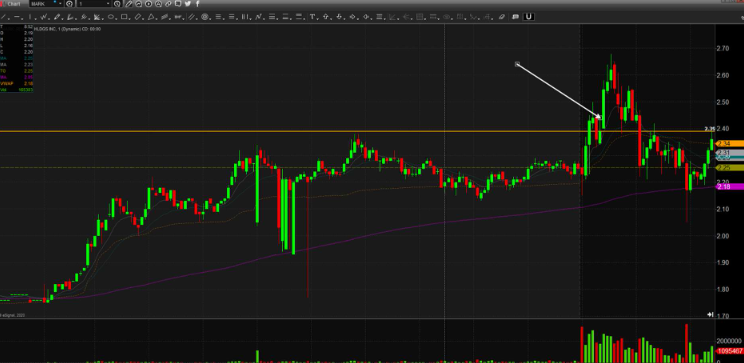
What Gap & Go trading strategy does this image represent?
The First Pullback 1-min
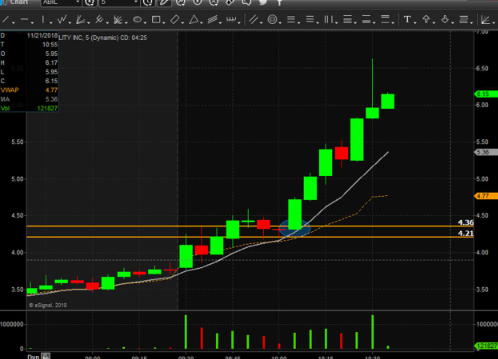
What Gap & Go trading strategy does this image represent?
The First Pullback (1-min & 5-min)
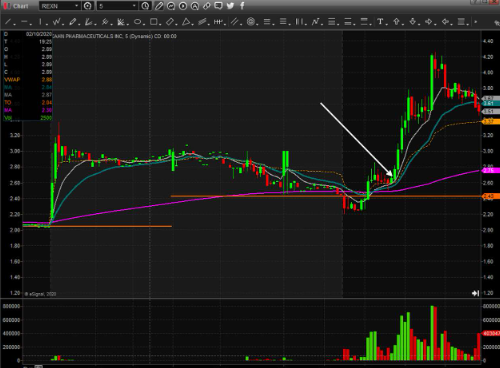
What Gap & Go trading strategy does this image represent?
The First Pullback (1-min & 5-min)
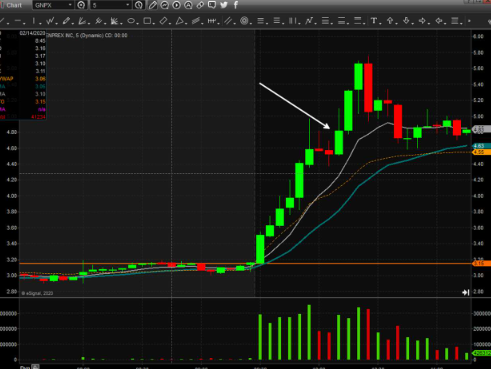
What Gap & Go trading strategy does this image represent?
The First Pullback (1-min & 5-min)
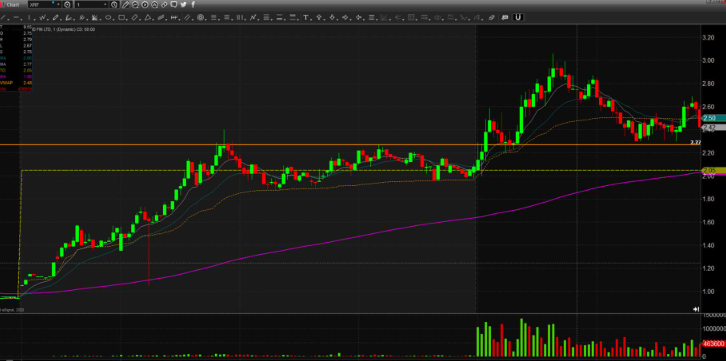
What Gap & Go trading strategy does this image represent?
The First Pullback (1-min & 5-min)
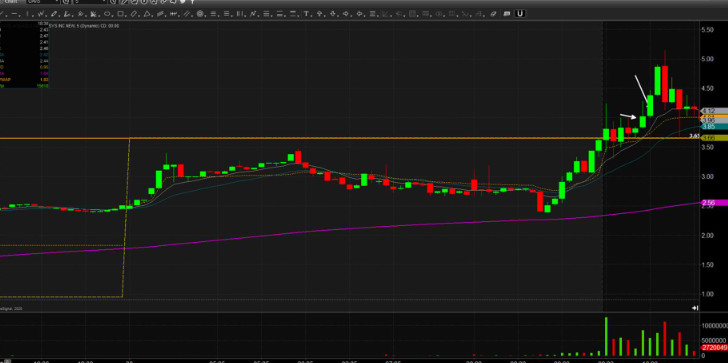
What Gap & Go trading strategy does this image represent?
Buying the First Pullback (ABCD)
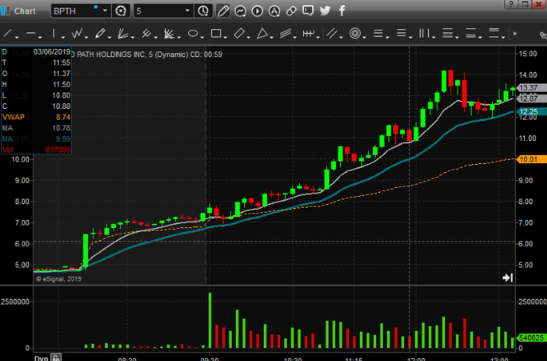
What Gap & Go trading strategy does this image represent?
The First Pullback (1-min & 5-min)
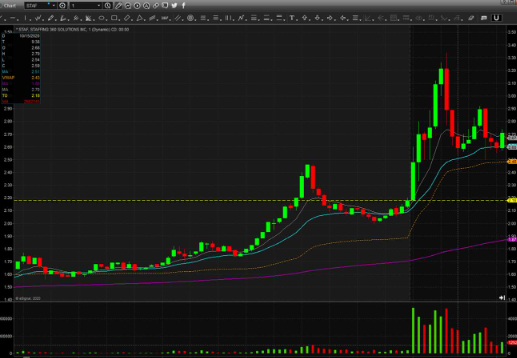
What Gap & Go trading strategy does this image represent?
The First Pullback (1-min & 5-min)
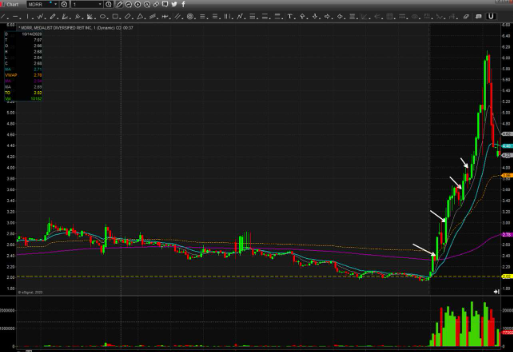
What Gap & Go trading strategy does this image represent?
The First Pullback (1-min & 5-min)
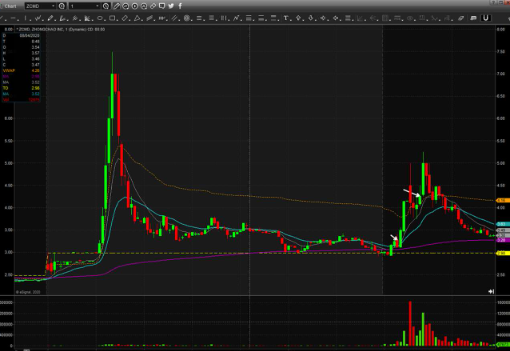
What Gap & Go trading strategy does this image represent?
The First Pullback (1-min & 5-min)
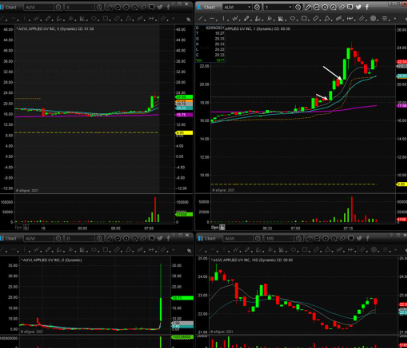
What Gap & Go trading strategy does this image represent?
The First Pullback (1-min & 5-min)
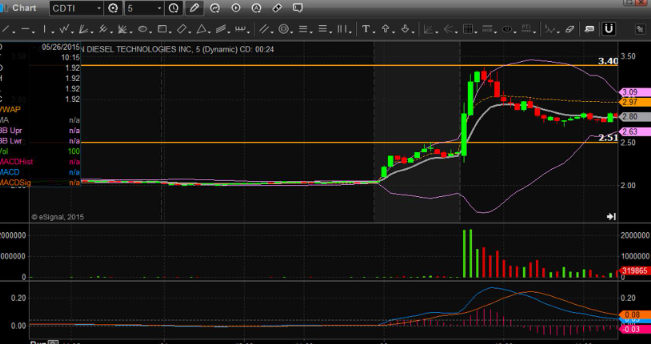
What Gap & Go trading strategy does this image represent?
Buying Pre-Market Highs (5-min chart)
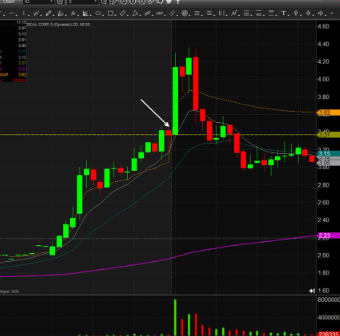
What Gap & Go trading strategy does this image represent?
Buying Pre-Market Highs (5-min chart)
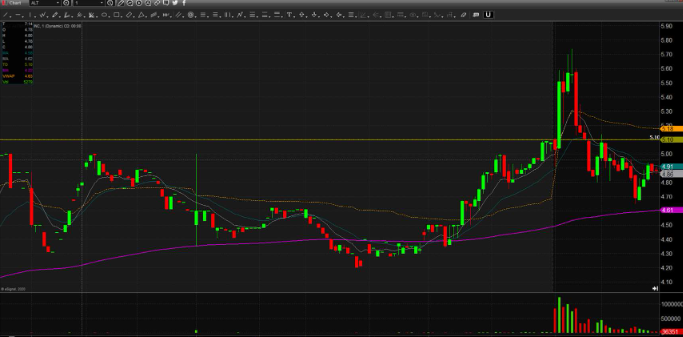
What Gap & Go trading strategy does this image represent?
Buying Pre-Market Highs (1-min chart)
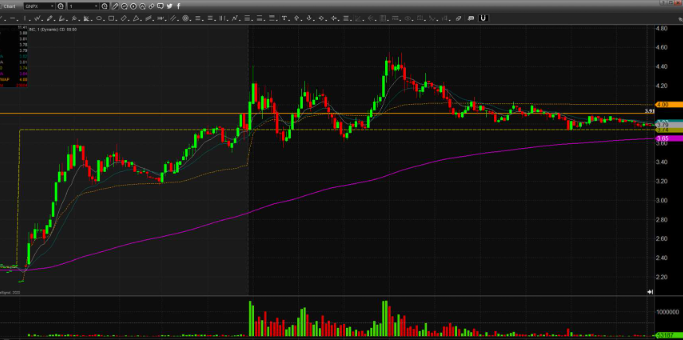
What Gap & Go trading strategy does this image represent?
Buying Pre-Market Highs (1-min chart)
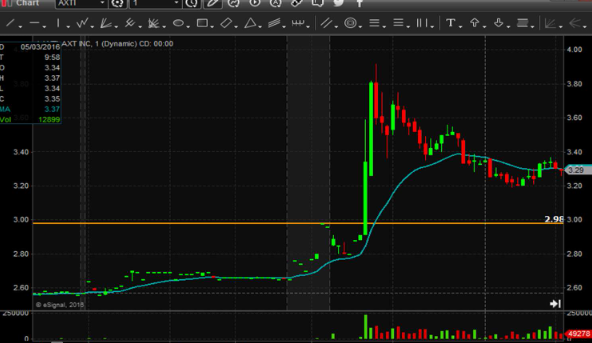
What Gap & Go trading strategy does this image represent?
Break of Pre-Market Highs
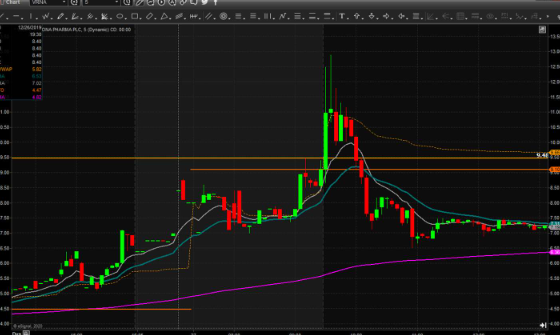
What Gap & Go trading strategy does this image represent?
Break of Pre-Market Highs (on a
Continuation Gap)
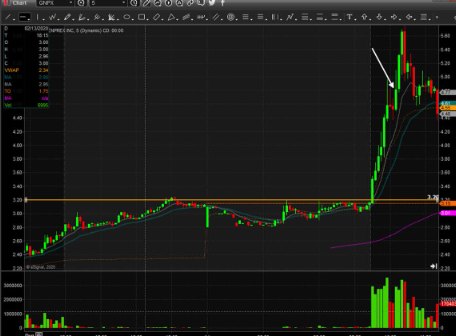
What Gap & Go trading strategy does this image represent?
Break of Pre-Market Highs (on a Continuation Gap)
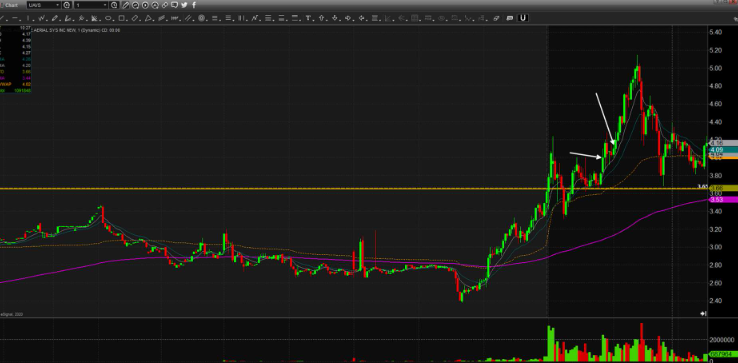
What Gap & Go trading strategy does this image represent?
Break of Pre-Market Highs
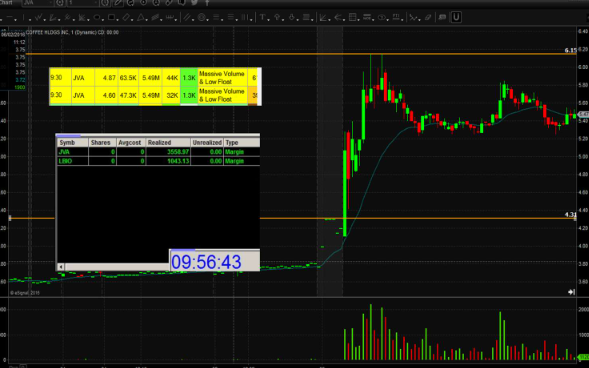
What Gap & Go trading strategy does this image represent?
Break of Pre-Market Highs
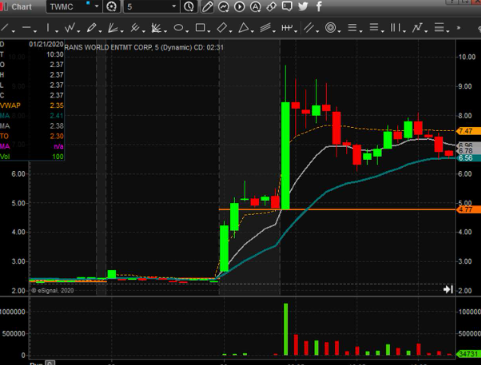
What Gap & Go trading strategy does this image represent?
Break of Pre-Market Highs
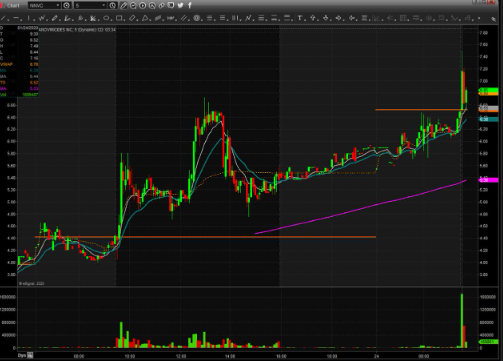
What Gap & Go trading strategy does this image represent?
Break of Pre-Market Highs
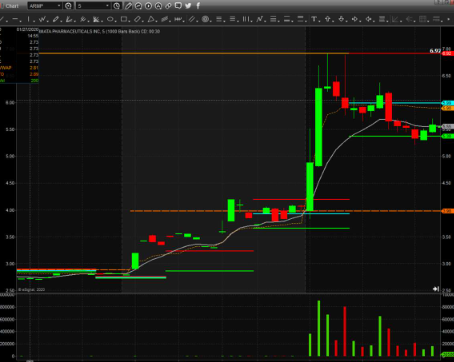
What Gap & Go trading strategy does this image represent?
Break of Pre-Market Highs
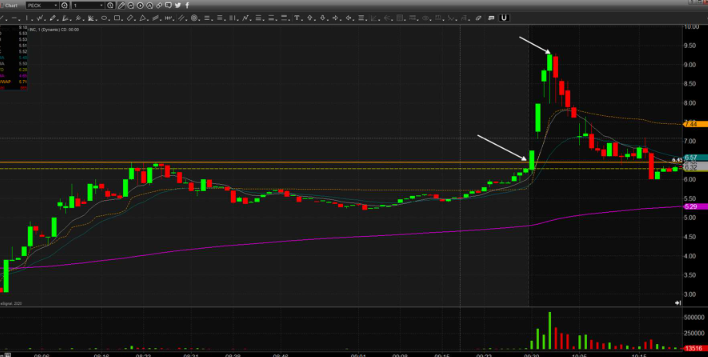
What Gap & Go trading strategy does this image represent?
Break of Pre-Market Highs
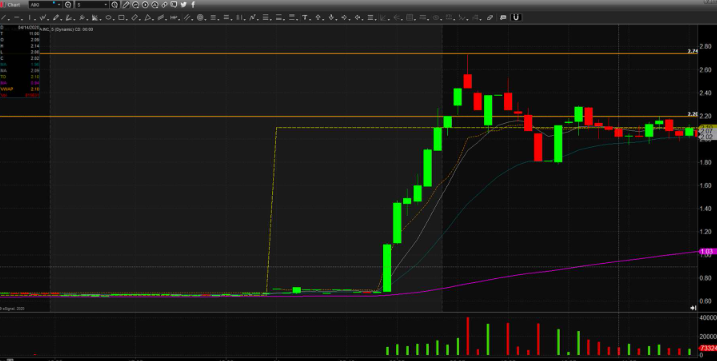
What Gap & Go trading strategy does this image represent?
Break of Pre-Market Highs
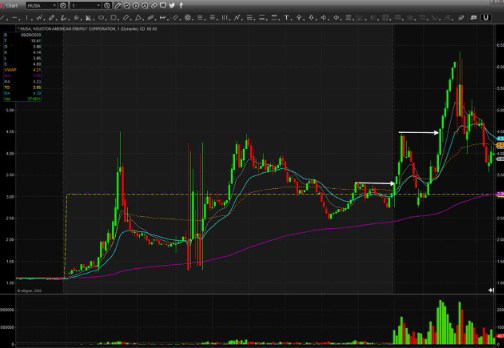
What Pre-market trading strategy does this image represent?
Break of Pre-Market Highs
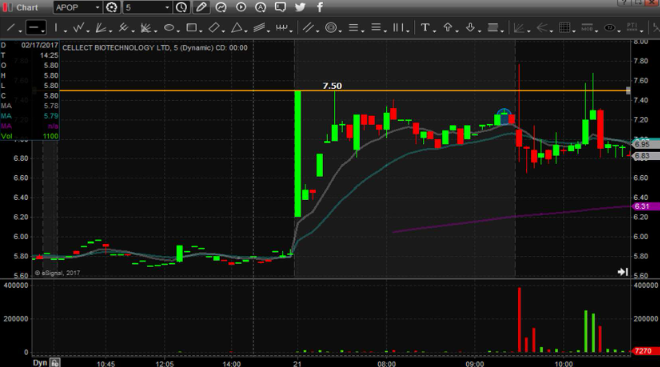
What Pre-market trading strategy does this image represent?
Buying Pre-Market Pivot
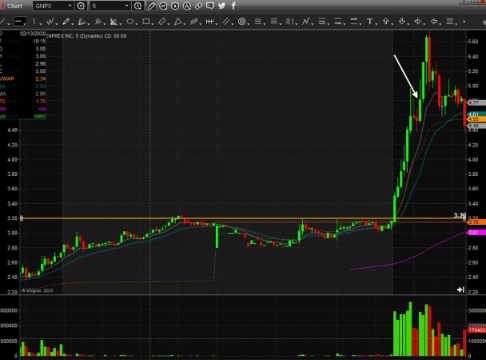
What Pre-market trading strategy does this image represent?
Buying Pre-Market Pivot
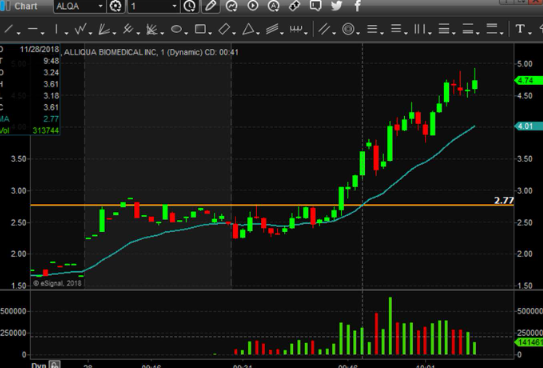
What Pre-market trading strategy does this image represent?
Buying Pre-Market Pivot
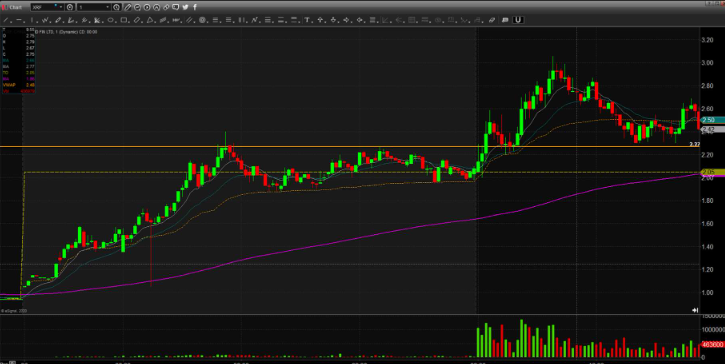
What Pre-market trading strategy does this image represent?
Buying Pre-Market Pivot
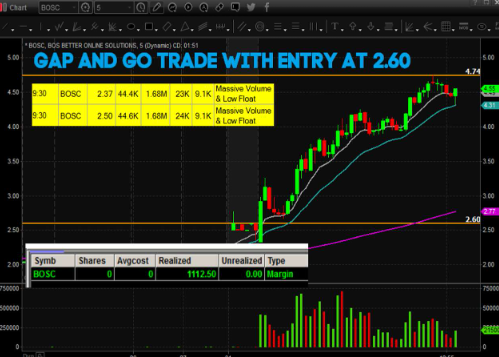
What Pre-market trading strategy does this image represent?
Buying Pre-Market Pivot
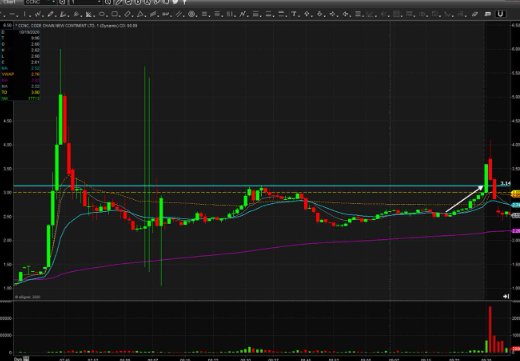
What Pre-market trading strategy does this image represent?
Buying Pre-Market Pivot
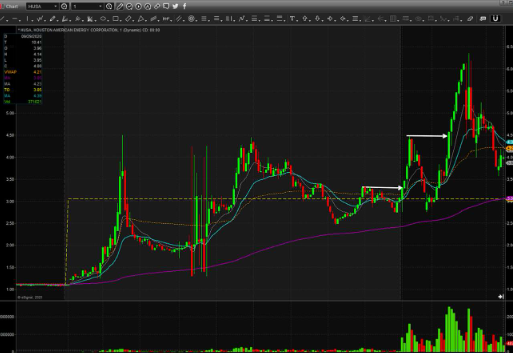
What Pre-market trading strategy does this image represent?
Buying Pre-Market Pivot
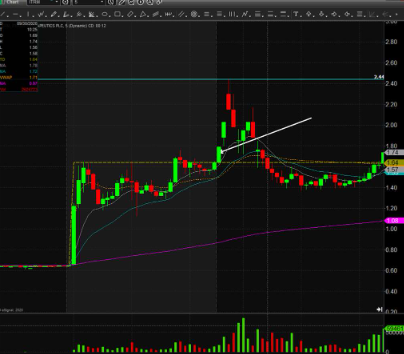
What Pre-market trading strategy does this image represent?
Buying Pre-Market Pivot
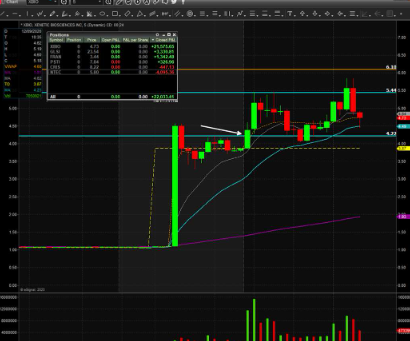
What Pre-market trading strategy does this image represent?
Buying Pre-Market Pivot
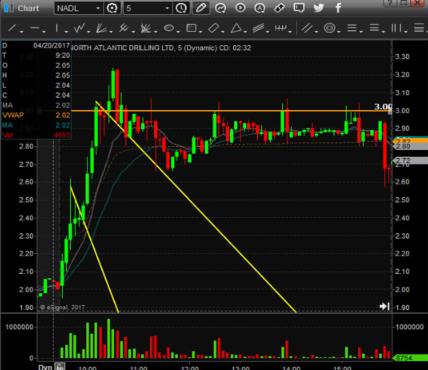
What level does this image represent?
Whole Dollar Entry Fake Outs
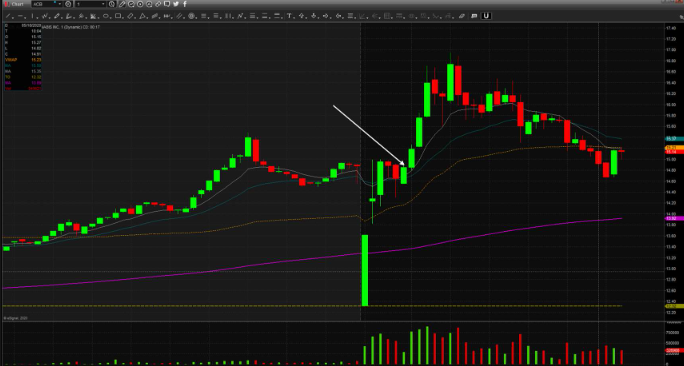
What level does this image represent?
Whole Dollar Break Micro 1-min Pullback
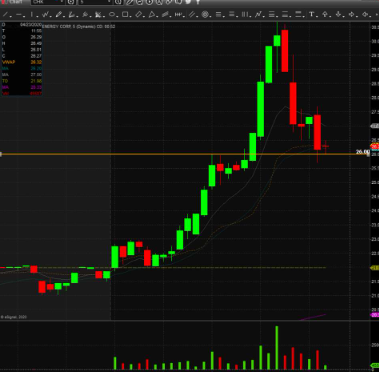
What level does this image represent?
Whole Dollars & ½ Dollars
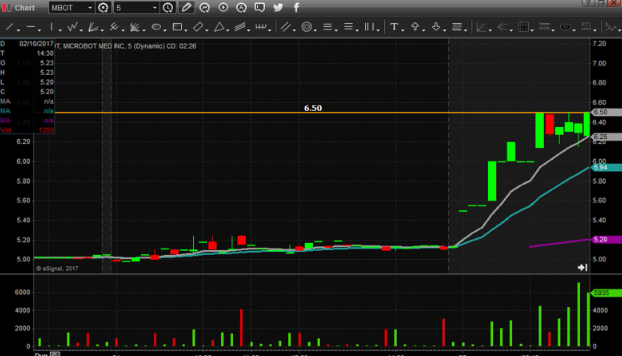
What level does this image represent?
Whole Dollars & ½ Dollars
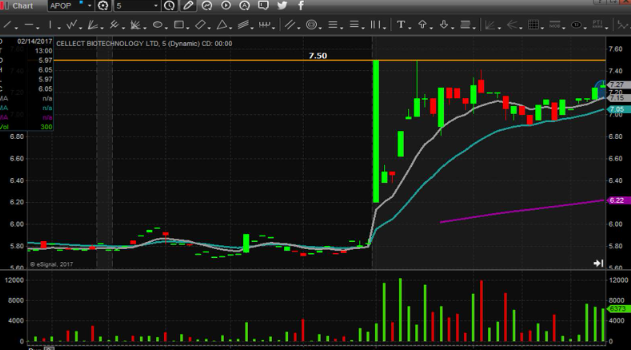
What level does this image represent?
Whole Dollars & ½ Dollars
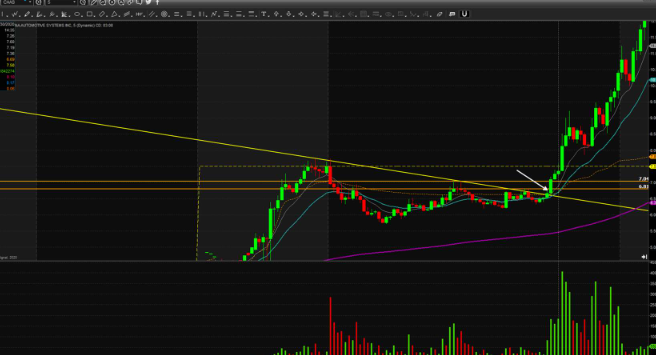
What level does this image represent?
9.50 Whole Dollar Pullback then Breakout
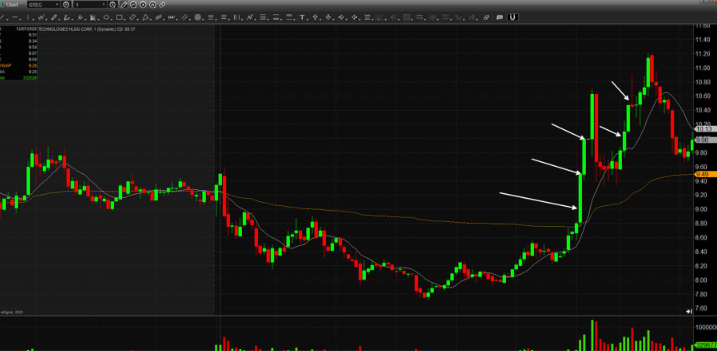
What level does this image represent?
Whole Dollar Break Out (Buying at 9.00 into Surge, Stop 8.90)
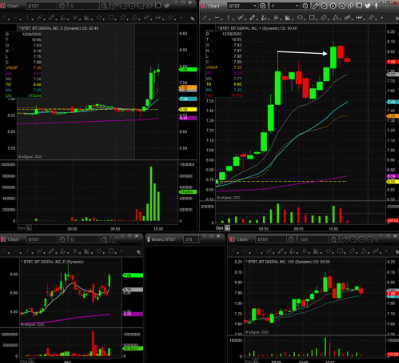
What level does this image represent?
Buying into Whole Dollar Break
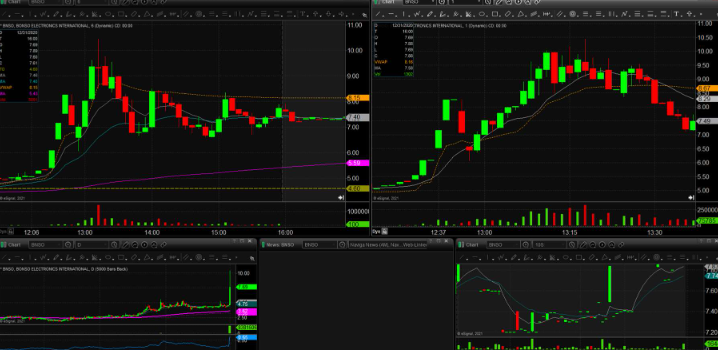
What level does this image represent?
Buying into Whole Dollar Break
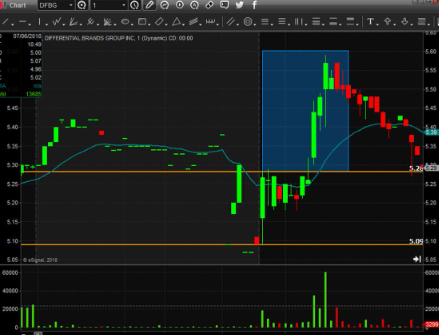
What Gap & Go Strategy does this image represent?
Opening Range Breakout (1-min chart)
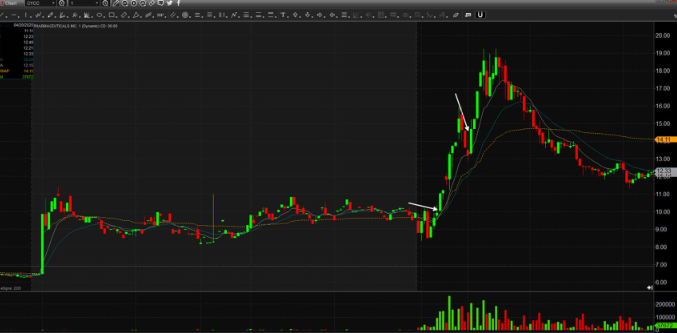
What Gap & Go Strategy does this image represent? Ignore Arrows
Opening Range Breakout (1-min chart)
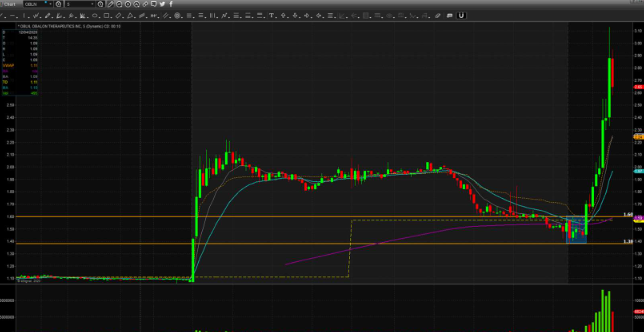
What Gap & Go Strategy does this image represent?
Opening Range Breakout (5-min chart)
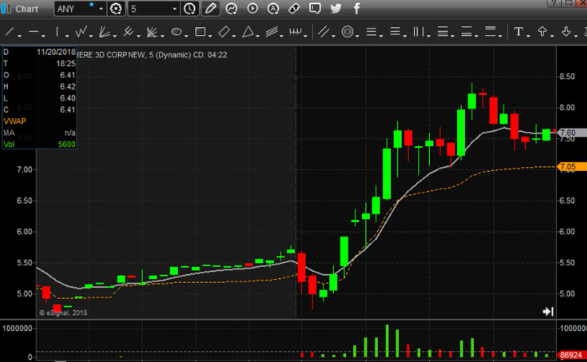
What kind of chart has transitions?
Red to Green
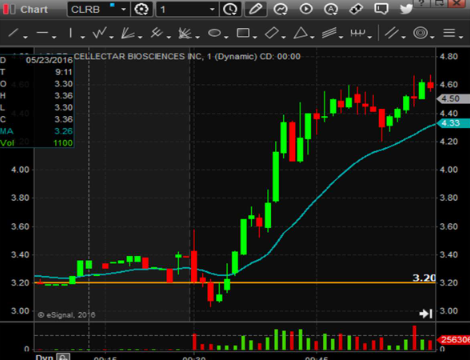
What kind of chart has transitions?
Red to Green
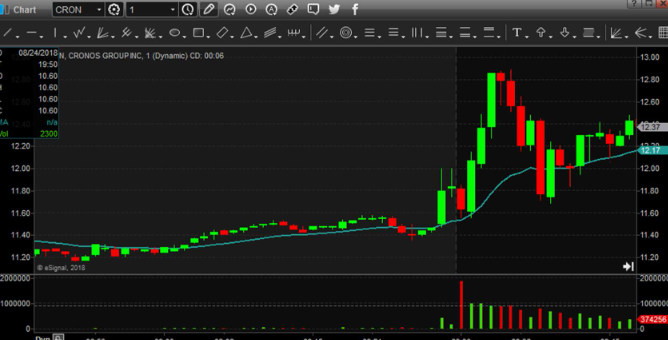
What kind of chart has transitions?
Red to Green (1-min)
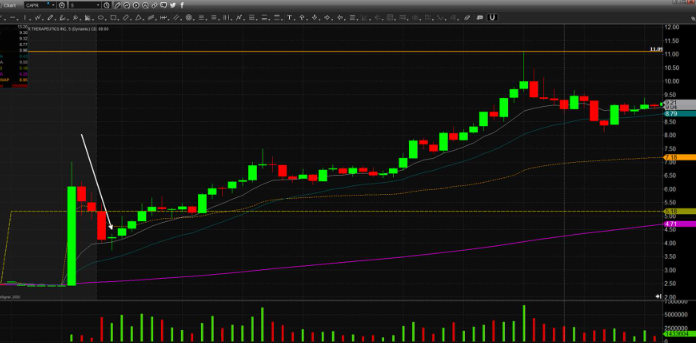
What kind of chart has transitions?
Red to Green
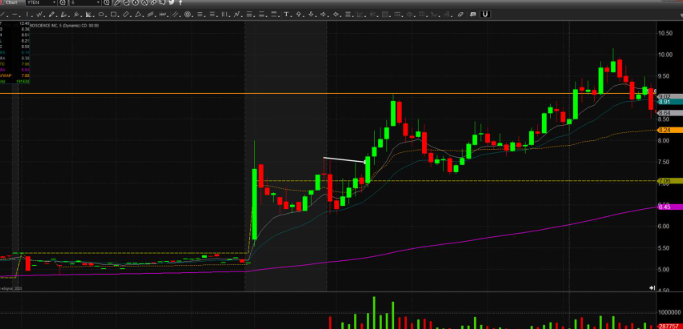
What kind of chart has transitions?
Red to Green
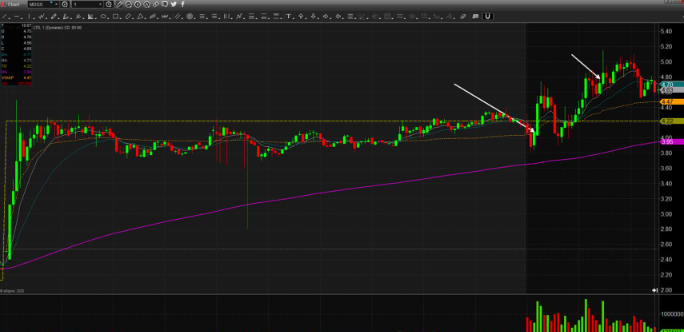
What kind of chart has transitions?
Red to Green
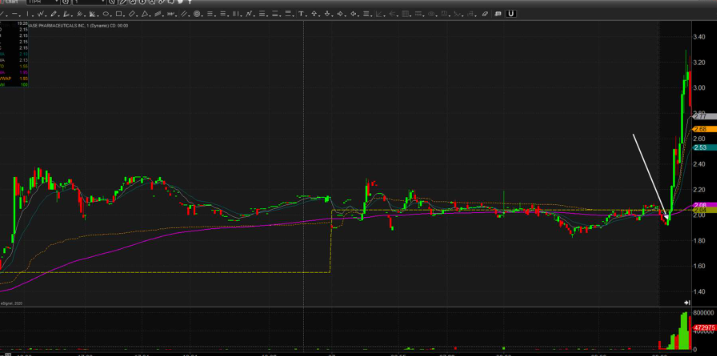
What kind of chart has transitions?
Red to Green (1-minute)
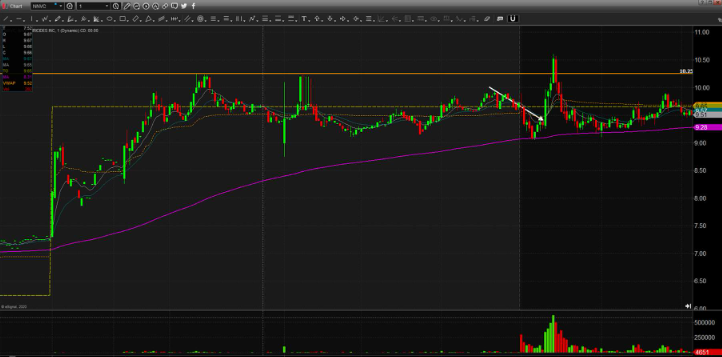
What kind of chart has transitions?
Red to Green (1-min)
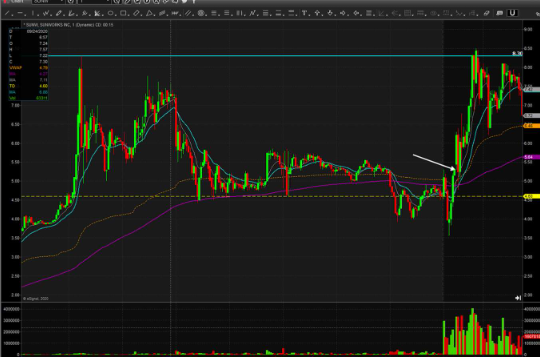
What kind of chart has transitions?
Red to Green (1-min)
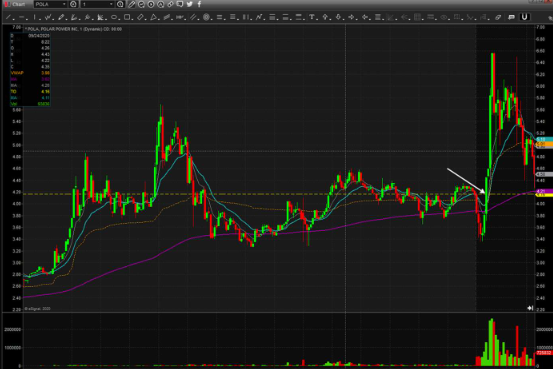
What kind of chart has transitions?
Red to Green (1-min)
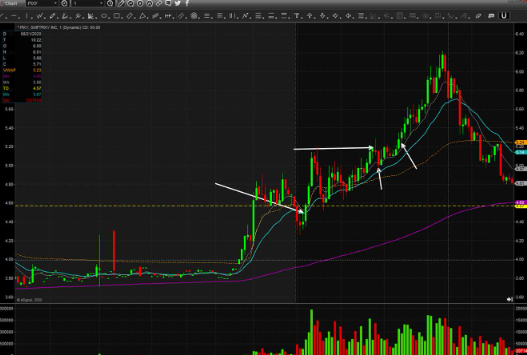
What kind of chart has transitions?
Red to Green (1-min)
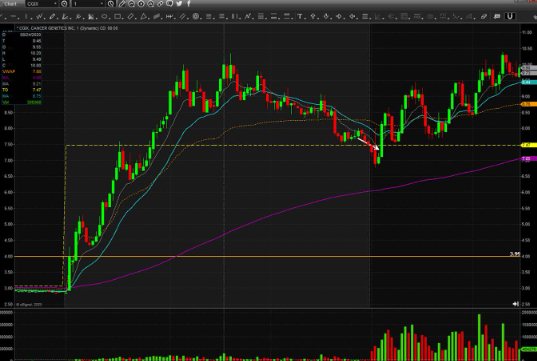
What kind of chart has transitions?
Red to Green (1-min)
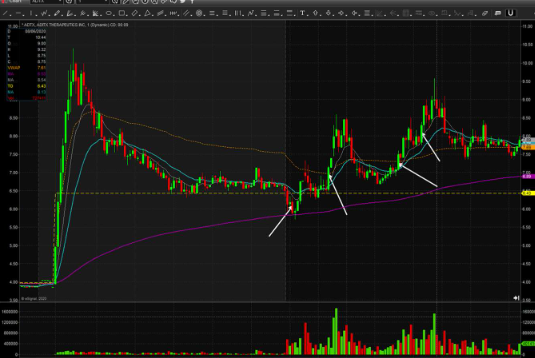
What kind of chart has transitions?
Red to Green Move into a Halt
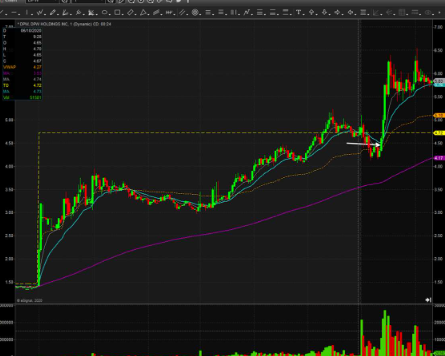
What kind of chart has transitions?
Red to Green
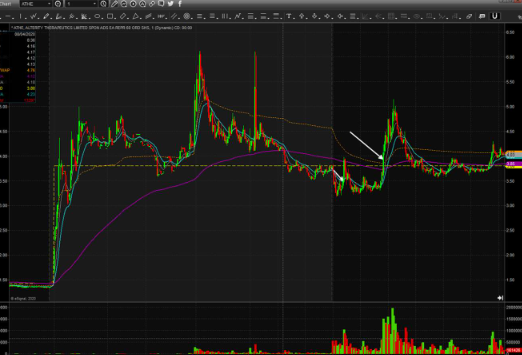
What kind of chart has transitions?
Red to Green
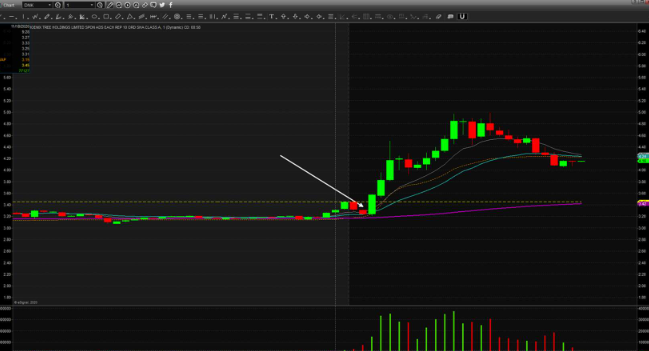
What kind of chart has transitions?
Red to Green
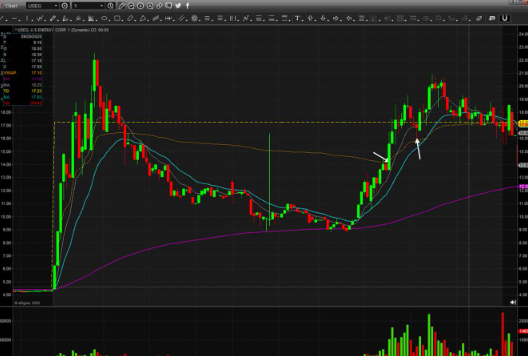
What level does this image represent?
Break of VWAP Pre-Market
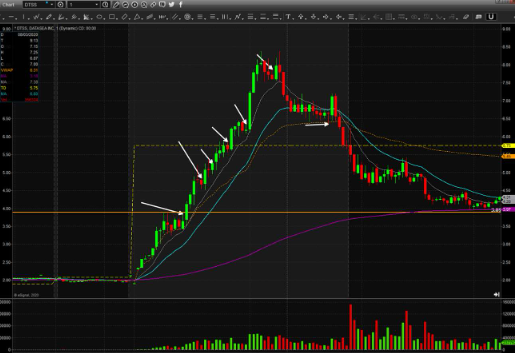
What Gap & Go Strategy does this image represent?
Buying 1-min Pullbacks Pre-Market
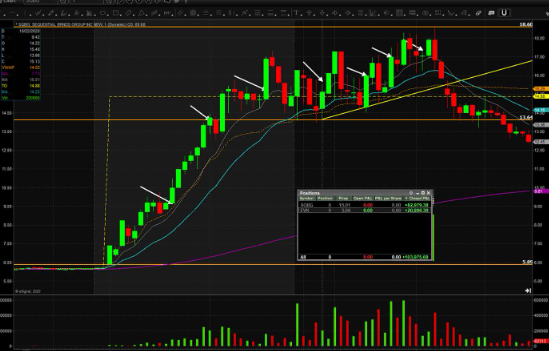
What Gap & Go Strategy does this image represent?
Buying 1-min Pullbacks Pre-Market
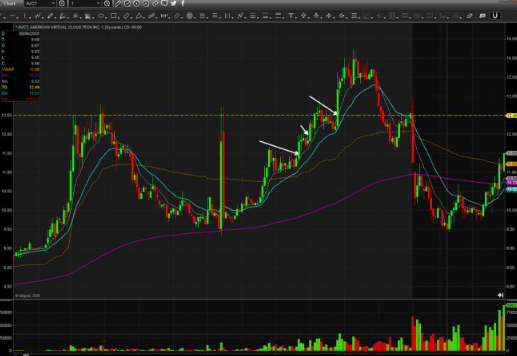
What Gap & Go Strategy does this image represent?
First and Second Pullbacks Pre-Market
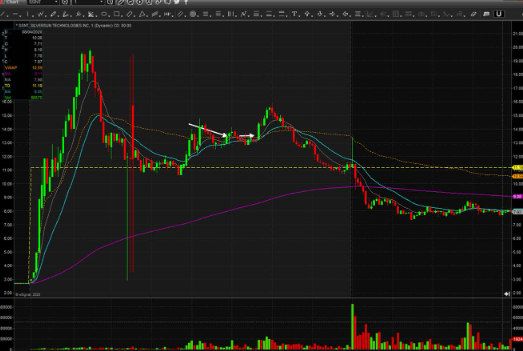
What level does this image represent?
Break of VWAP Pre-Market
What level does this image represent?
Break of VWAP Pre-Market