Strategic Management Exam 2
1/158
There's no tags or description
Looks like no tags are added yet.
Name | Mastery | Learn | Test | Matching | Spaced |
|---|
No study sessions yet.
159 Terms
Unicorns
Private firms with a valuation of $1 billion at IPO
Public Stock Company Benefits
Limited liability for investors
Transferability of investor ownership
Has it’s own legal personality
Separation of legal ownership and management control
Issues with Public Companies: Responsibility
Some believe that “the social responsibility of business is to increase its profits” - Milton Friedman, Others (Michael Porter) believe companies should create shared value.
Shared Value
Economic value (for shareholders) + Social value (address society’s needs and challenges)
Issues with Public Companies
Responsibility?
Principal-Agent Problem
Principal-Agent Problem
When there’s a separation of legal ownership and management control, and the agent doesn’t act in the principal’s best interest.
Principle = Shareholders, Agent = Executives
Shared Value Creation Framework
Provides guidance to managers
Helps reconcile:
Gaining and Sustaining competitive advantage with corporate social responsibility
Creates a larger “pie” to benefit shareholders & stakeholders
ESG Criteria
A set of standards beyond mere financial results on which companies are evaluated. (Environment, Social, Governance)
Shareholder Capitalism
The social responsibility of business is to increase its profits - Milton Friedman
Competitive Advantage
A firm that achieves superior performance relative to other competitors in the same industry or the industry average. Always relative, not absolute
3 Ways to assess performance
Accounting profitability
Shareholder value creation
Economic value creation
Accounting Profitability
Accurately assess firm performance using standardized accounting metrics
Compares firm performance to competitors/industry average
Available through
Standardized accounting metrics
10-K statements
Profitability Ratios
Return on invested capital (ROIC)
= Net income/invested capital
Return on Equity (ROE)
= Net income/total shareholders equity
Return on Assets (ROA)
= Net income/total assets
Limitations of Accounting Data
Historical and thus backward-looking
Does not consider off-balance sheet items, such as:
Pension obligations
Leasing obligations
Focuses mainly on tangible assets
May not be the most important in explaining firms performance
E.g., innovation, quality, customer experience.
Shareholder Value Creation
An assessment of how much value a firm creates for its shareholders
Shareholders
Owns shares of stock in a company
The legal owners of public companies
Return on Risk Capital
= total returns to shareholders
Money provided for an equity share in a company
Cannot be recovered if the firm goes bankrupt
Measures of Shareholder Value Creation
Market Capitalization
Dollar value of total shares outstanding
= (Number of shares outstanding) x (Share Price)
Total Return to Shareholders (return on risk capital)
Stock price appreciation plus dividends
Limitations of Shareholder Value Creation
Stock prices can be highly volatile
Makes it difficult to assess firm performance
Macroeconomic factors affect stock price
Economic growth or contraction
Unemployment, interest, and exchange rates
Stock prices can reflect the mood of investors
Can be irrational
Economic Value Creation
The difference between:
A buyer’s willingness to pay for a product/service
And the firm’s total cost to produce it
The difference between value (V) and cost (C)
Competitive advantage can be based on:
Economic value creation because of superior product differentiation
Or a relative cost advantage over rivals
Reservation Price
= Total perceived consumer benefit + Maximum willingness to pay
Value
The dollar amount a consumer attaches to a good or service; the consumer’s maximum willingness to pay; also called reservation price.
Producer Surplus
The difference between the price changed (P) and the cost to produce (C)
Consumer Surplus
The difference between what you were willing to pay (V) and what you paid (P)
Both parties
_____ capture some of the value created. (Economic Value Created: Producer and Consumer surplus)
Limitations of Economic Value Creation
Determining value for consumers is not simple
The value of a good in the eyes of consumers changes.
Based on income, preference, time, and other factors
To measure firm-level competitive advantage, we must estimate the economic value created for all products and services offered by the firm.
2 main holistic frameworks to measure firm performance
The balance scorecard
The triple bottom line
The balanced scorecard
Helps managers achieve their strategic objectives more effectively
Uses internal and external performance metrics
Balances both financial and strategic goals
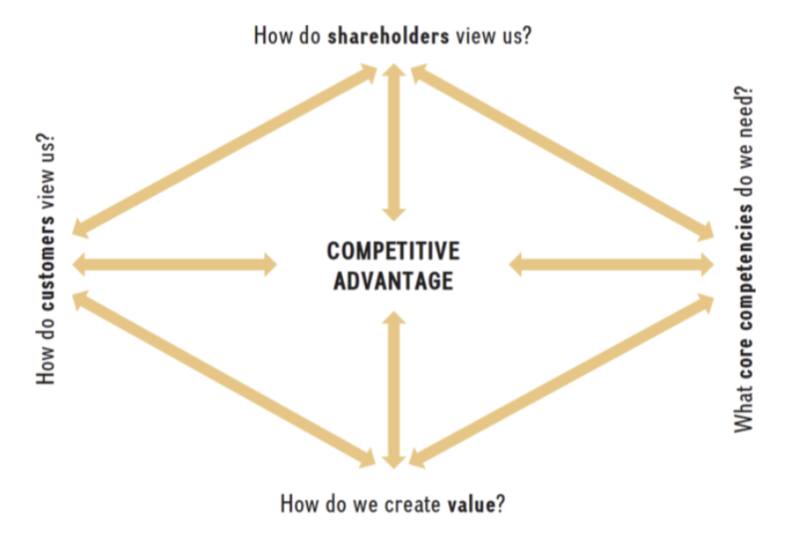
Questions for Balanced Scorecard
How do customers view us?
How do we create value?
What core competencies do we need?
How do shareholders view us?
How do customers view us?
Metrics → Revenue, profit, customer stisfaction
How do we create value?
Metrics → Competitiveness, innovation, organizational learning
What core competencies do we need?
Metrics → Core competencies, supporting business processes
How do shareholders view us?
Metrics → Cash flow, operating income, ROIC, ROE, total returns to shareholders
Advantages of the Balanced Scorecard
Links the strategic vision to responsible parties
Translates the vision into measurable goals
Designs and plans business processes
Implements feedback and organizational learning
Alerts to needed strategic goal adaptation
Disadvantages of the Balanced Scorecard
Focused on strategy implementation
Not formulation
How to get back on track if deviations occur.
Limited guidance:
Which metrics to use?
How to address setbacks?
The Triple Bottom Line
Three dimensions fundamental to sustainable strategy:
Profits: The economic dimension [The business must be profitable to survive]
People: The social dimension [Emphasizes the people aspect]
Planet: The ecological dimension [Emphasizes the relationship between business and the natural environment]
![<p>Three dimensions fundamental to sustainable strategy:</p><ol><li><p>Profits: The economic dimension [The business must be profitable to survive]</p></li><li><p>People: The social dimension [Emphasizes the people aspect]</p></li><li><p>Planet: The ecological dimension [Emphasizes the relationship between business and the natural environment]</p></li></ol><p></p>](https://knowt-user-attachments.s3.amazonaws.com/e0fd569e-79dc-437e-8b97-2de2a800bafb.png)
What is business level strategy?
Goal-directed actions managers take
To achieve competitive advantage
In a single product market
How should we compete?
How should we compete?
Who: which customer segments will we serve?
What: customer needs will we satisfy?
Why: do we want to satisfy them?
How: will we satisfy out customers’ needs?
Strategic Position
A strategic profile based on value creation and cost in a specific product-market
Firms attempt to stake out a valuable and unique position, which:
Meets customer needs
Maximizes product value
Lowest possible product cost
Strategic Trade-offs
Choices between a cost or value position
There is tension between:
Value creation and Pressure to keep cost in check
Purpose to maximize the firm’s:
Economic value creation
Profit Margin
Generic Business Strategies
Differentiation and Cost Leadership
Focused Business Strategies
Narrower competitive scope
Focused differentiation
Focused cost leadership
Differentiation Strategy
Unique features that increase value, so that consumers are willing to pay a higher price
The focus of competition(drivers):
Unique product features
Customer Service
New product launches
Marketing & promotion
Competitive advantage achieved when:
(Value - Cost) > competitors
Product features
Increases perceived value
Turns commodity products into differentiated products
Strong R&D capabilities are often needed
Unique features » Higher price
Customer Service
Increases perceived value
Offers things like free shipping
Representatives do not use scripts, etc.
Complements
Add value to a product/service when consumed in tandem
Cost Leadership Strategy
Goals:
Reduce cost below competitors
Offer adequate value
Reduce prices for customer
Optimize the value chain to achieve low-cost
Can achieve a competitive advantage as long as its economic value created (V - C) is greater than that of its competitor
4 cost drivers that help keep costs low
Cost of input factors
Economies of scale
Learning-curve effects
Experience-curve effects
Cost of Input factors
Input factors such as:
Raw materials
Capital
Labor
IT services
Economies of Scale
Decreases in cost per unit as output increases, allow firms to:
Spread fixed costs over a larger output
Employ specialized systems and equipment
Take advantage of certain physical properties.
Learning curve effects
Learning drives down costs
It takes less time to produce the same output
We learn how to be more efficient
People learn from cumulative experience
Writing computer code
Developing new medicines
Building submarines
First noted shortly before WWII (aircraft manufacturing)
When production doubled, per-unit cost dropped 20%
Experience Curve Effects
When technology is changed while output is constant
Process facilitated with advanced tech
Differentiation Strategy Benefits
Can contribute to low threat of entry & low threat of substitutes
Customer loyalty
Differentiation Strategy Risks
When differentiated products are commoditized, lose competitive advantage
Need to be careful not to overshoot its differentiated appeal (can increase costs, not perceived value)
Cost Leadership Strategy Benefits
Strengths when a price war ensues
Economies of scale allows to further lower prices.
Cost Leadership Strategy Risks
High risk of replacement if a potent substitute emerges due to innovation
Potential to lose competitive advantage when the focus shifts from price to non-price attributes
Successful Business Strategy
A ___________:
Leverages the firm’s internal strengths
Mitigates internal firm weaknesses
Exploits external opportunities
Avoids external threats
There is no single correct business strategy for a specific industry
Choose a strategy that:
Provides a strong position that attempts to maximize economic value creation
Is effectively implemented
Blue Ocean Strategy
Successfully combining differentiation and cost-leadership activities
Uses value innovation to reconcile trade-offs
The metaphor of ______ means:
Untapped market space
The creation of addition demand
The opportunity for highly profitable growth
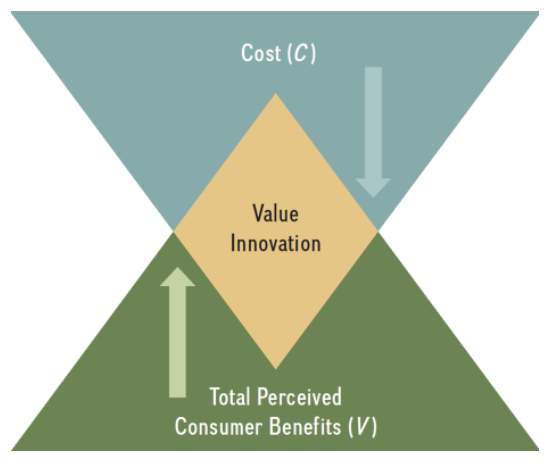
Value Innovation
Accomplished through the simultaneously pursuing differentiation (V /\) and low cost (C \/)
Lowering Cost Questions
Eliminate: which of the factors that the industry takes for granted should be eliminated?
Reduce: Which of the factors should be reduced well below the industry’s standards?
Increasing perceived consumer benefits questions
Raise: Which of the factors should be raised well above the industry’s standards?
Create: Which factors should be created that the industry has never offered?
Stuck in the middle
Blue Ocean gone wrong, when no one wants a slightly differentiated, slightly cost leadership product. (Also think Red Ocean of strong competitors)
The Strategy Canvas
Graphical depiction of a company’s performance
Relative to its competitors
Shows focus of divergence
Viewed across the industry’s key success factors
The value curve
Horizontal connection points
Located on the strategy canvas
Helps strategists determine courses of action.
Industry Effects
Industry Attractiveness
5 forces model
Complements
Within Industry
Strategic Groups
Firm Effects
Value Position
Relative to competitors
Cost Position
Relative to competitors
Business Strategy
Cost leadership
Differentiation
Blue Ocean
Economies of Scope
A proportionate saving gained by producing two or more distinct goods, when the cost of doing so is less than that of producing each separately.
Minimum efficient scale (MES)
The lowest point on a long-term average cost curve where a company can produce a product as a competitive price
Waves
Innovation often comes in _________.
Foundational
Initial Innovations are _________ for other rapid innovations.
The four I’s of the innovation process
Idea
Invention
Innovation
Imitation
Idea
Abstract concepts or research findings
Invention
Transformation of an idea into a product
The modification and recombination of products
Patents in invention is useful, novel, and non-obvious
Double edged sword - some firms use trade secrets
Innovation
Commercialization of an invention
First-mover advantages
Doesn’t have to be high-tech; firms can achieve innovation through other tactics
Imitation
Copying a successful innovation
Entrepreneurship
The process by which change agents undertake economic risk to innovate
Create new products, processes, and organizations
Create value for society
Commercialize ideas and inventions
Strategic Entrepreneurship
Pursuit of innovation using strategic tools and concepts
Combining entrepreneurial actions
Creating new opportunities
Exploiting existing opportunities
Social Entrepreneurship
Pursuit of social goals while creating profitable businesses
Evaluate performance by financial, ecological, and social contribution metrics
Triple-bottom-line approach
The industry Lifecycle Over time:
The number of size of competitors change
Different types of consumers enter the market
The supply and demand sides of the market change
Different competencies are needed for the firms to perform well
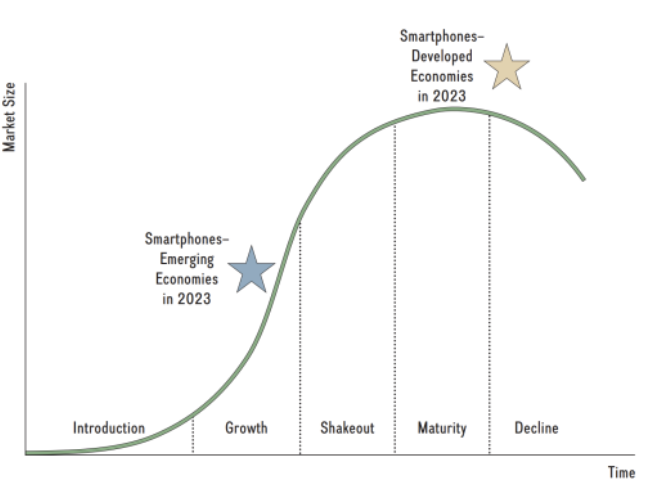
The industry lifecycle
Introduction → Growth → Shakeout → Maturity → Decline
Introduction Stage
When an entrepreneur can transform an invention to an innovation, a new industry emerge.
Core competency: Research and development (R&D)
Necessary to create a product category that will attract customer.
Can be very capital-intensive (high costs).
Barriers to Entry are high.
Emphasize unique product features rather than price
Strategic objective: market acceptance & future growth
Growth Stage
Demand increases rapidly
First-time buyers rush to purchase.
Proof of concept has been demonstrated
Product/service standard emerge
A common set of features and design choices
Emerges from competition, government, or agencies
Product innovation
New or recombined knowledge embodied in new products, Higher in the beginning of an industry life cycle
Process Innovation
New ways to produce existing products, higher in the middle section of a product life cycle
Shakeout Stage
The rate of growth declines
Firms begin to intensely compete
Weaker firms are forced out
Industry consolidation
Only the strongest competitors survive
Price is an important competitive weapon
Maturity Stage
Only a few large firms remain (oligopoly)
They enjoy economies of scale
Process innovation has reached a maximum
Demand: replacement or repeat purchases
Market has reached maximum size
Industry growth is zero or negative
Decline Stage
Demand falls rapidly
Innovation efforts cease
If a breakthrough emerges, it leads to a new industry or resets the life cycle
Strong pressure on prices
Crossing-the-chasm framework
Different customer groups responding to innovation/the different customer groups at each stage of a life cycle.
Technology Enthusiasts
Entering the market in the introduction stage.
Pursue new technologies proactively
Seek new products before they are officially introduced
Provide feedback and suggestions to companies
Often pay a premium price to have the latest gadget.
Early Adopters
Entering the market in the growth stage
Eager to buy early into a new technology or product concept
Early Majority
Entering the market in the shakeout stage
Practicality drives them
Weigh the benefits and costs carefully before adopting a new product
Winning them over is critical to the commercial success of the innovation.
Late Majority
Entering the market in the maturity stage
Not confident in their ability to master the new technology
Prefer well-established firms with a strong brand image
Laggards
Entering in the declining stage.
Don’t want new technology, generally not considered worth pursuing
Increment Innovation
Existing market, existing technology
Radical Innovation
New market, new technology
Architectural Innovation
Leverages existing technology into a new market
Disruptive Innovation
Leverages new technologies in existing markets
Exploration
Searching for new knowledge that may enhance a firm’s future performance (risk-taking, experimentation, search)
Related to radical changes
Exploitation
Applying current knowledge to enhance firm performance in the short term (refinement, execution, implementation)
Related to incremental changes
Ambidexterity
Balancing exploration with exploitation