AP Biology - SCIENTIFIC DESIGN/STATS ASSESSMENT
1/50
There's no tags or description
Looks like no tags are added yet.
Name | Mastery | Learn | Test | Matching | Spaced | Call with Kai |
|---|
No analytics yet
Send a link to your students to track their progress
51 Terms

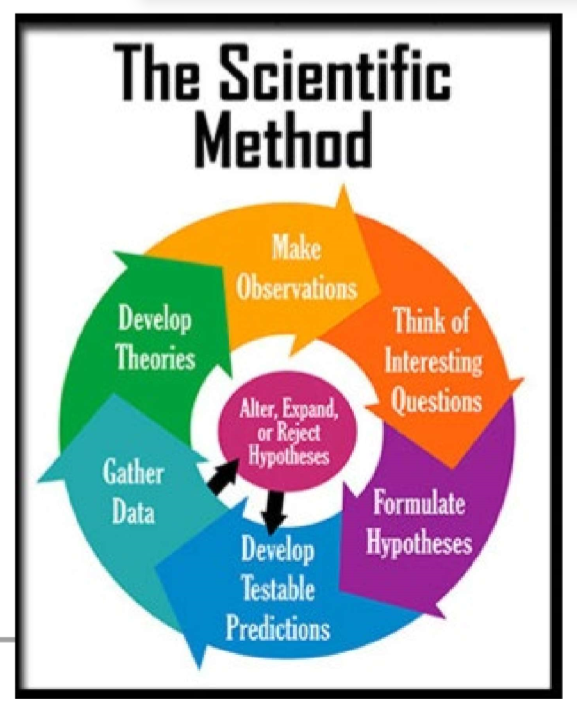
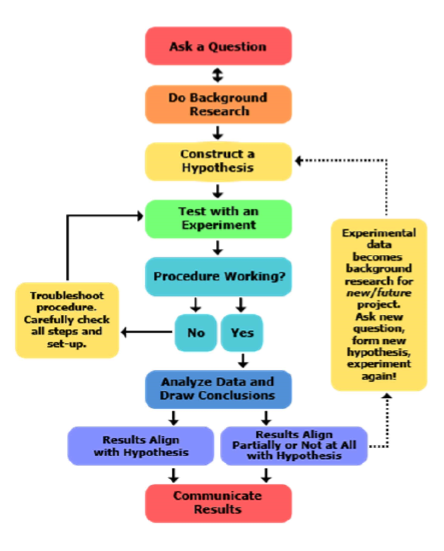
(Scientific Design) Scientific Method & Experimental Design: Step #1
Ask a Question / Define a Problem
Start with an observation about the natural world.
Formulate a specific, testable question. It must be a testable question!
Example: Does sunlight increase the rate of plant growth?

(Scientific Design) Scientific Method & Experimental Design: Step #2
Background Research
Gather existing information (scientific articles, textbooks, prior experiments).
This step helps refine the question and avoid repeating known work.
Anything you reference in your background must be cited!

(Scientific Design) Scientific Method & Experimental Design: Step #3
Write a Hypothesis
A hypothesis is a testable, falsifiable statement that predicts the outcome.
It is often written as an “If… then… because…” statement.
If plants are given more sunlight, then they will grow taller because photosynthesis depends on light energy.
Must include:
Independent variable (what you change).
Dependent variable (what you measure).
Rationale (biological reasoning behind the prediction).
Using this structure helps ensure that hypotheses are clear, testable, and grounded in logical reasoning. It also helps researchers communicate their predictions in a standardized way that others can understand and evaluate. It shows a…
Cause (independent variable) → Effect (dependent variable) relationship

(Scientific Design) Scientific Method & Experimental Design: Step #4
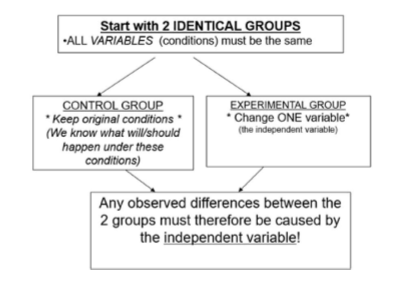
Design a Controlled Experiment
Controlled experiment: Only one variable is changed at a time, while all others are kept constant.
Experimental group(s): Exposed to the independent variable.
Control group(s): Provide a baseline for comparison.
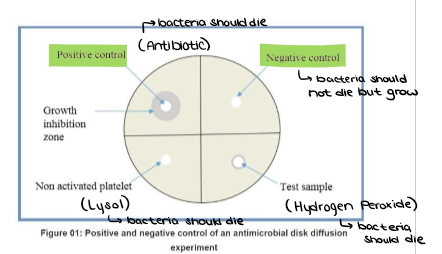

(Scientific Design) Scientific Method & Experimental Design: Step #4 - What is a NEGATIVE CONTROL?
Negative control: A group where no response is expected.
Example: Cells treated with plain water instead of a drug.
(Scientific Design) Scientific Method & Experimental Design: Step #4 - What is a POSITIVE CONTROL?
Positive control: A group where a known response is expected.
Example: Cells treated with a drug known to increase enzyme activity.

(Scientific Design) Scientific Method & Experimental Design: Step #4 - Both controls are important because…
…they verify results are valid and not due to random chance, contamination, or poor experimental design.

(Scientific Design) Scientific Method & Experimental Design: Step #4 - TO SET UP A CONTROLLED EXPERIMENT…

(Scientific Design) Scientific Method & Experimental Design: Step #5
Variables
Independent variable: The factor that is deliberately changed.
(change pH, change amount of sunlight)
Dependent variable: The measurable outcome (what you record/measure).
Controlled variables: Conditions kept constant to ensure fairness.
Example: same plant species (can’t measure growth of cactus, fern, daisy), same soil, same water, same pot size.

(Scientific Design) Scientific Method & Experimental Design: Step #6
Data Collection
Collect quantitative data (numerical measurements, counts, time).
Collect qualitative data (observations, changes in color/shape/behavior).
Use replicates (multiple samples per condition) to ensure reliability.
Record data in organized tables, noting units and conditions.

(Scientific Design) Why More Data = More Accurate and Reliable Results
Accuracy Improves with More Data
When scientists collect only a few data points, a single unusual result (an outlier) can make the results misleading.
With more data, the unusual results get “averaged out,” so the overall pattern is clearer and closer to the true effect.
Example: Measuring the height of just 3 students might give a misleading idea of the class average. Measuring all 25 gives a much more accurate picture.

(Scientific Design) Why More Data = More Accurate and Reliable Results
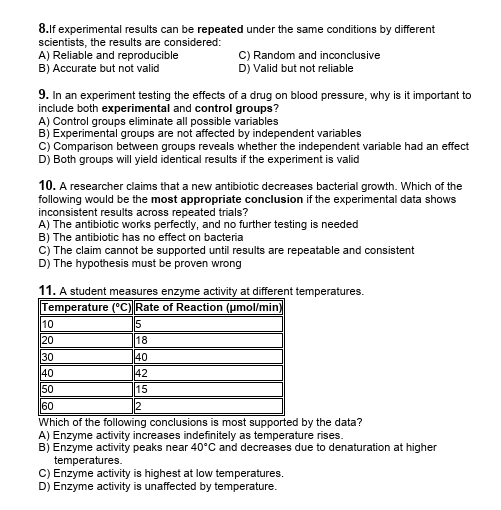
Repeatability Ensures Reliability
A scientific result should not just happen once by chance—it should be repeatable under the same conditions.
Multiple trials (repeating the experiment several times) confirm that results are consistent.
If repeated trials give the same outcome, confidence in the conclusion increases.

(Scientific Design) Why More Data = More Accurate and Reliable Results
Larger Sample Size Reduces Error - What is SAMPLE SIZE?
Sample size = the number of subjects or items tested.

(Scientific Design) Why More Data = More Accurate and Reliable Results
Larger Sample Size Reduces Error
A larger sample size reduces the influence of random variation.
Small samples may not represent the true population (like flipping a coin only twice might give “2 heads” and make it look unfair).
Bigger samples give a result that is closer to the actual probability or trend.

(Scientific Design) Scientific Method & Experimental Design: Step #7 - Bar Graphs
Choosing Graphs for Data
Bar graphs: Compare categories (e.g., enzyme activity at different pH levels).

(Scientific Design) Scientific Method & Experimental Design: Step #7 - Line Graphs
Choosing Graphs for Data
Line graphs: Show trends over time or continuous changes (e.g., population growth over weeks).

(Scientific Design) Scientific Method & Experimental Design: Step #7 - Scatter Plots
Choosing Graphs for Data
Scatter plots: Show relationships between two variables (e.g., light intensity vs. photosynthesis rate).

(Scientific Design) Scientific Method & Experimental Design: Step #7 - Histograms
Choosing Graphs for Data
Histograms: Show distribution of a dataset (e.g., height of plants in a population).

(Scientific Design) Scientific Method & Experimental Design: Step #7 - Pie Chart
Choosing Graphs for Data
Pie Chart: Shows how a whole is made up of different parts so that they add up to 100% (e.g. a budget spent on different items in a year).

(Scientific Design) Scientific Method & Experimental Design: Step #8
Analyze Data
Look for patterns, trends, and statistical significance.
Compare results between experimental and control groups.
Ask: Do the results support or refute the hypothesis?

(Scientific Design) Scientific Method & Experimental Design: Step #9
Conclusion
State where the hypothesis was supported or not supported (avoid “proved”—science rarely proves, it supports).
Explain reasoning using biological principles.
Consider errors, limitations, and improvements (sample size, uncontrolled variables, measurement errors).
Suggest future experiments to expand or refine the findings.

(Scientific Design) Scientific Method & Experimental Design: Step #10
Communicate Results
Share findings in lab reports, presentation, or publications.
Include methods, data, graphs, analysis, and conclusion so others can replicate your experiment.
Experiments are about: logical design, valid controls, careful measurement, and thoughtful interpretation.
Is control legit? Is sample size large enough?
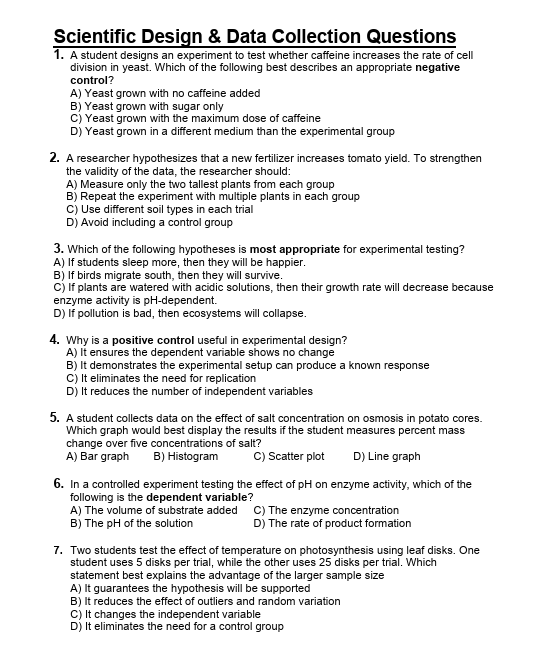
(Scientific Design) Scientific Design & Data Collection Questions: Set #1
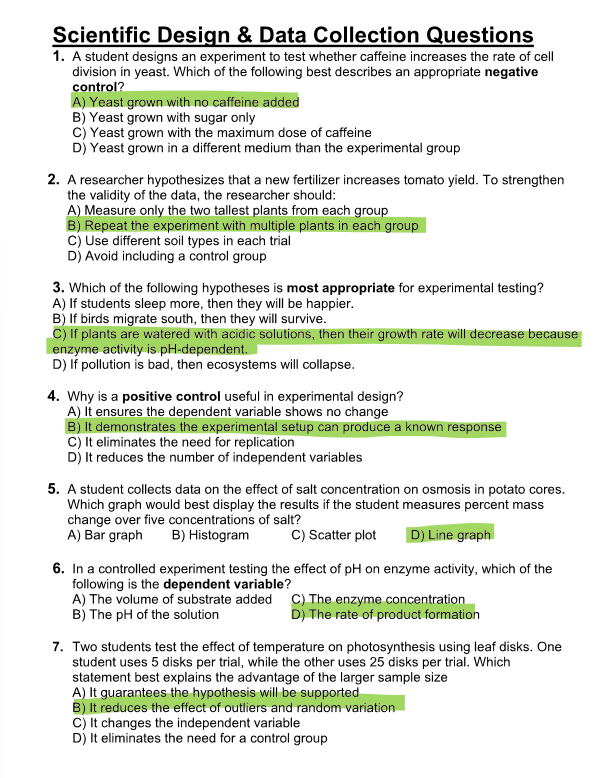
(Scientific Design) Scientific Design & Data Collection Questions: Set #2
(Scientific Design) Scientific Design & Data Collection Questions: Set #3
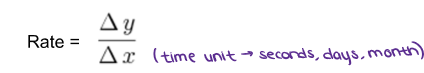
(Graphing ErrorBars) To calculate changes between 2 points on a line graph (slope)…
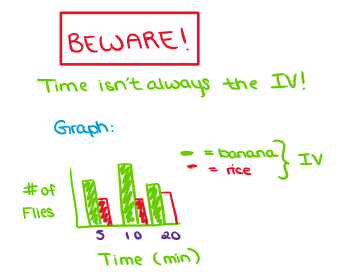
(Graphing ErrorBars) Is TIME always the IV?
No…
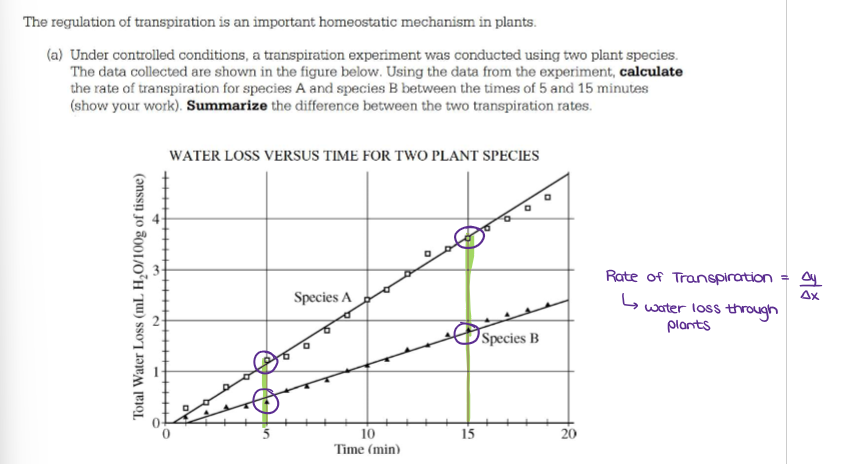
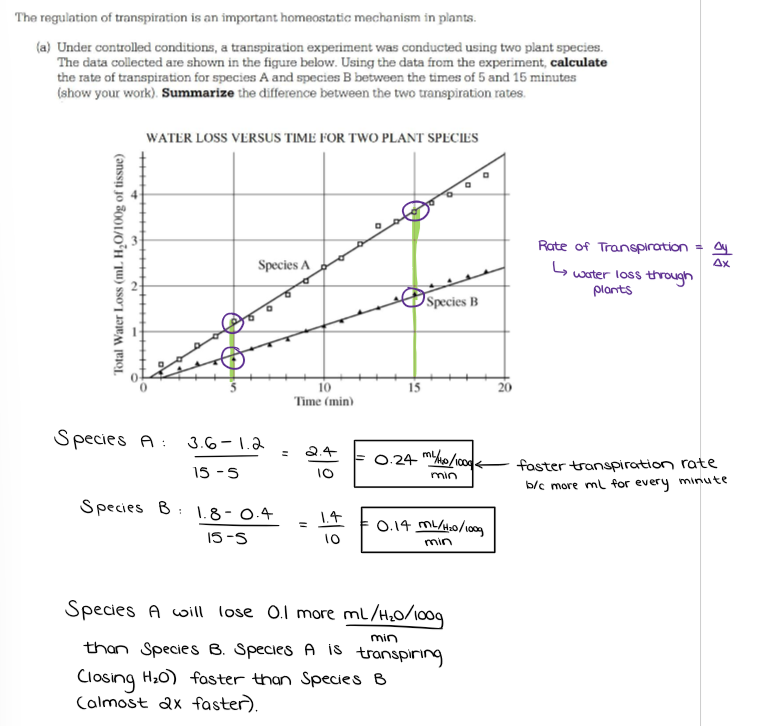
(Graphing ErrorBars) Calculate RATE OF CHANGE.
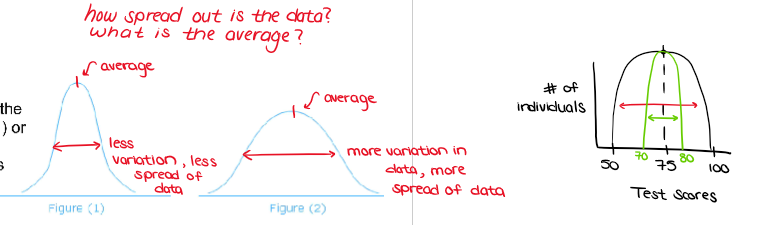
(Graphing ErrorBars) ANALYZING DATA ON A GRAPH: Standard Deviation
Averages do not tell us everything about a sample. Samples can be very uniform with the data all bunched around the mean (Figure 1) or they can be spread out a long way from the mean (Figure 2).
The statistic that measures this spread for normally distributed data is called the standard deviation.
The wider the spread of scores, the larger the standard deviation.
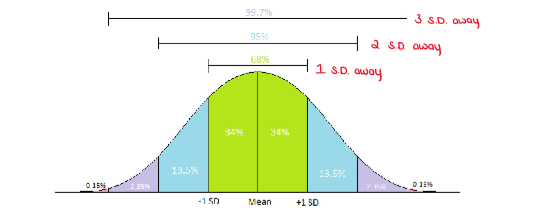
(Graphing ErrorBars) ANALYZING DATA ON A GRAPH: Empirical Formula
For data that has a normal distribution, 68% of the data lies within one standard deviation of the mean.
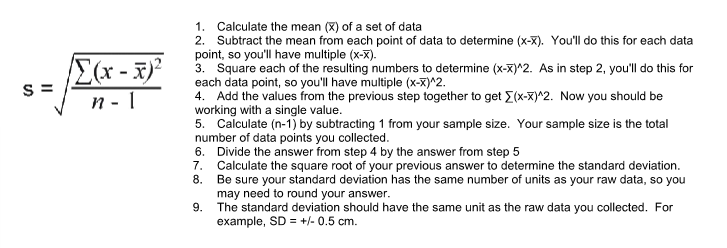
(Graphing ErrorBars) ANALYZING DATA ON A GRAPH: How to Calculate the Standard Deviation
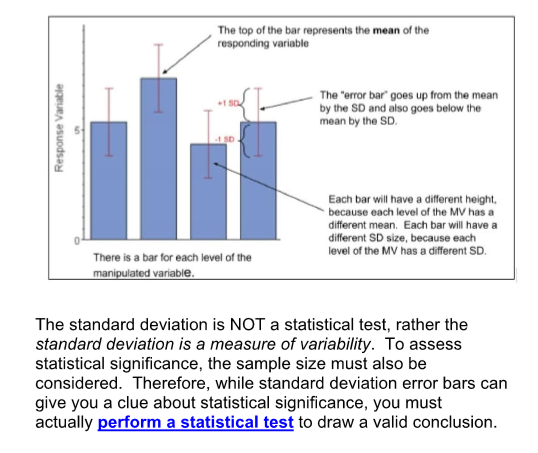
(Graphing ErrorBars) ANALYZING DATA ON A GRAPH: What is an Error Bar?
An error bar is a line through a point on a graph which represents the uncertainty or variation of the corresponding data point.
In Biology, the error bars must often represent the standard deviation of a data set.
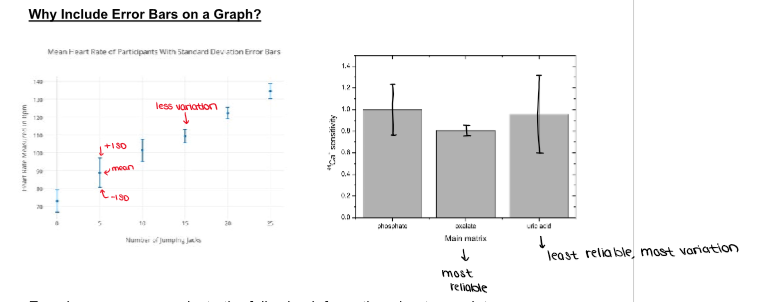
(Graphing ErrorBars) ANALYZING DATA ON A GRAPH: Error bars can communicate the following information about your data: How spread the data is are around the mean value
Small SD bar = low spread, data are clumped around the mean;
Larger SD bar = larger spread, data is more variable from the mean
(Graphing ErrorBars) ANALYZING DATA ON A GRAPH: Error bars can communicate the following information about your data: The reliability of the mean value as a representative number for the data set. In other words, how accurately the mean value represents the data
small SD bar = more reliable,
larger SD bar = less reliable
(Graphing ErrorBars) ANALYZING DATA ON A GRAPH: Error bars can communicate the following information about your data: It’s important to note that just because you have a larger SD, it does not indicate your data is ___ _____. Biological measurements are notoriously variable.
not valid
(Graphing ErrorBars) ANALYZING DATA ON A GRAPH: Error bars can communicate the following information about your data: The likelihood of there being a ___________ __________ between data sets.
significant difference
(Graphing ErrorBars) ANALYZING DATA ON A GRAPH: What do Error Bars Indicate about Statistical Significance?
A “Significant difference” means that the results that are seen are most likely not due to chance or sampling error.
If the result is “significant,” then the investigator may conclude that the observed effect actually reflects the characteristics of the population rather than just sampling error or chance.
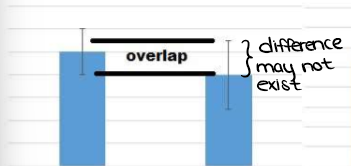
(Graphing ErrorBars) ANALYZING DATA ON A GRAPH: What do Error Bars Indicate about Statistical Significance? - The standard deviation error bars on a graph can be used to get a sense for whether or not a difference is significant. Look for overlap between the standard deviation bars.
When standard deviation error bars overlap quite a bit…
…it’s a clue that the difference is not statistically significant. You must perform a statistical test to draw a conclusion.
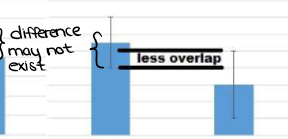
(Graphing ErrorBars) ANALYZING DATA ON A GRAPH: What do Error Bars Indicate about Statistical Significance? - The standard deviation error bars on a graph can be used to get a sense for whether or not a difference is significant. Look for overlap between the standard deviation bars.
When standard deviation error bars overlap even less…
…it’s a clue that the difference is probably not statistically significant. You must perform a statistical test to draw a conclusion.
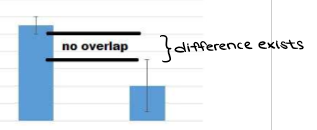
(Graphing ErrorBars) ANALYZING DATA ON A GRAPH: What do Error Bars Indicate about Statistical Significance? - The standard deviation error bars on a graph can be used to get a sense for whether or not a difference is significant. Look for overlap between the standard deviation bars.
When standard deviation error bars do not overlap…
…it’s a clue that the difference may be significant, but you cannot be sure. You must perform a statistical test to draw a conclusion.
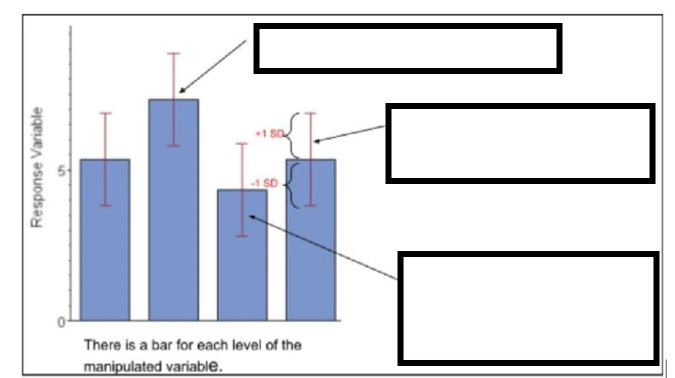
(Graphing ErrorBars) ANALYZING DATA ON A GRAPH: What do Error Bars Indicate about Statistical Significance? - Label the ERROR BARS.
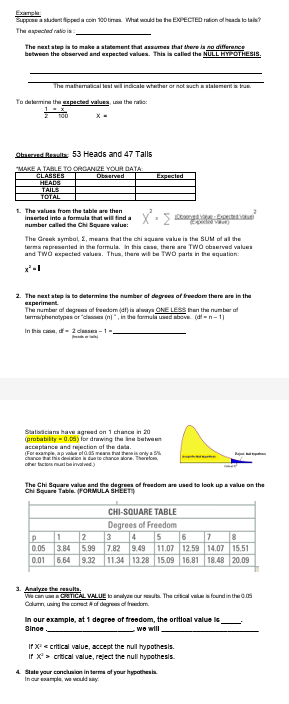
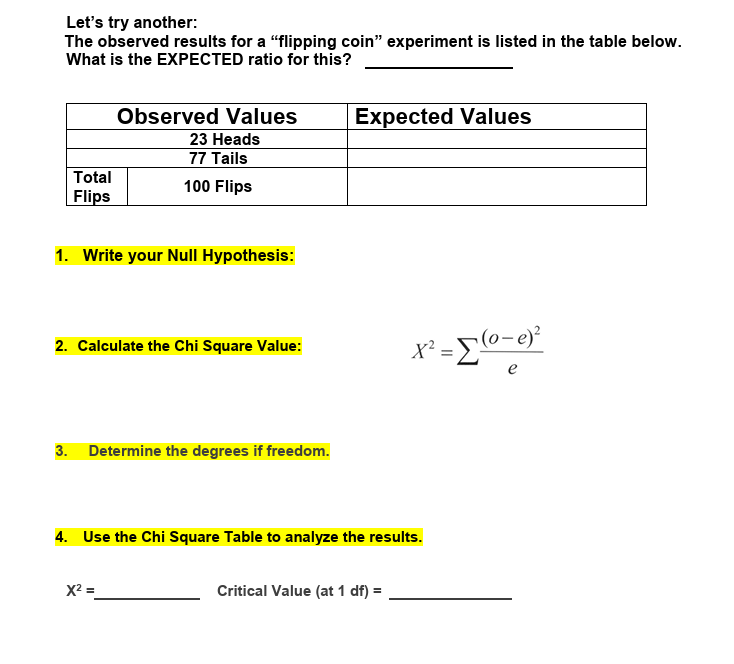
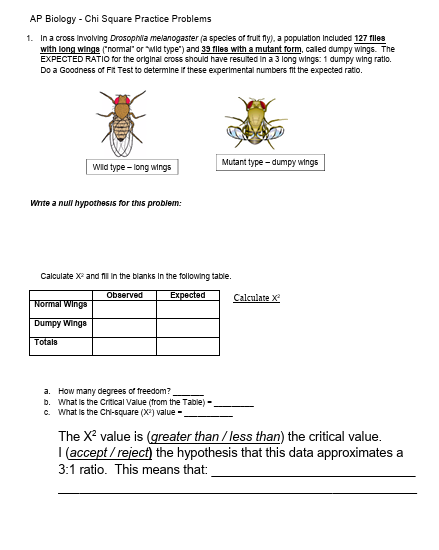
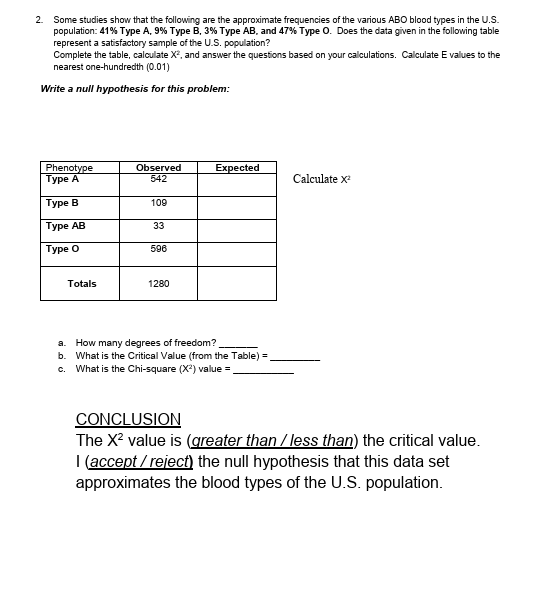
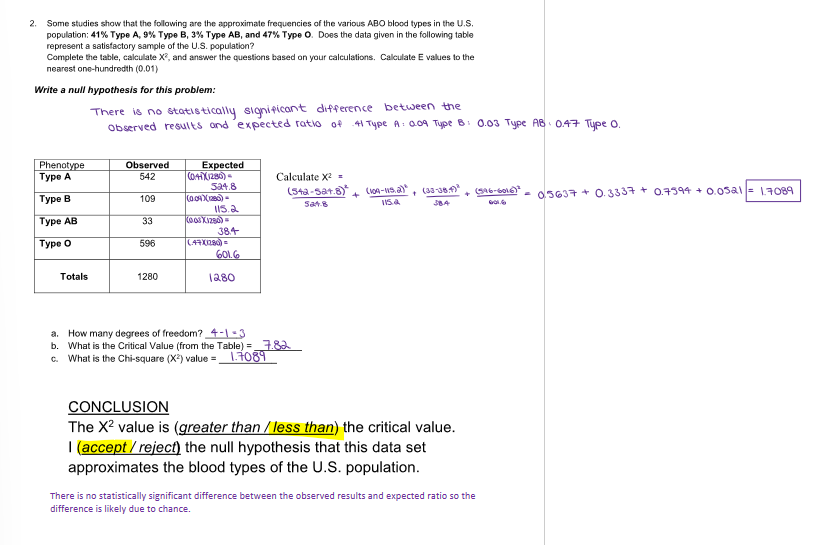
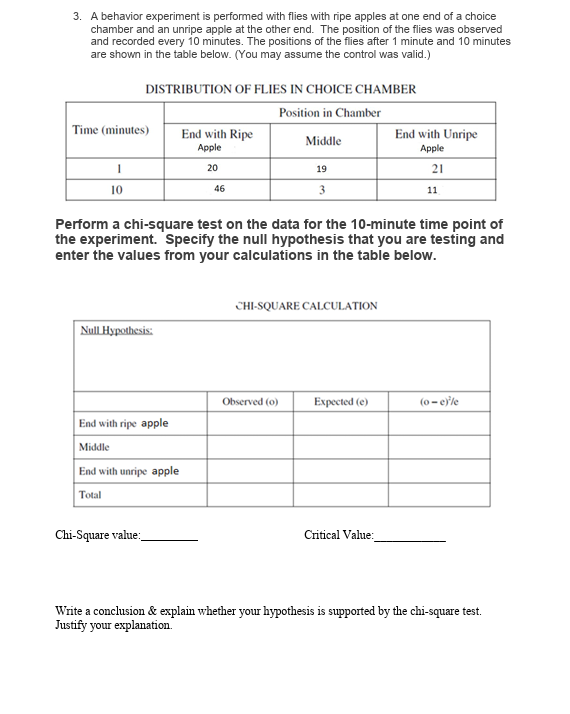
(CHi SQUARE TESTS) What is a Chi Square Test (x2) or “Goodness of Fit” test?
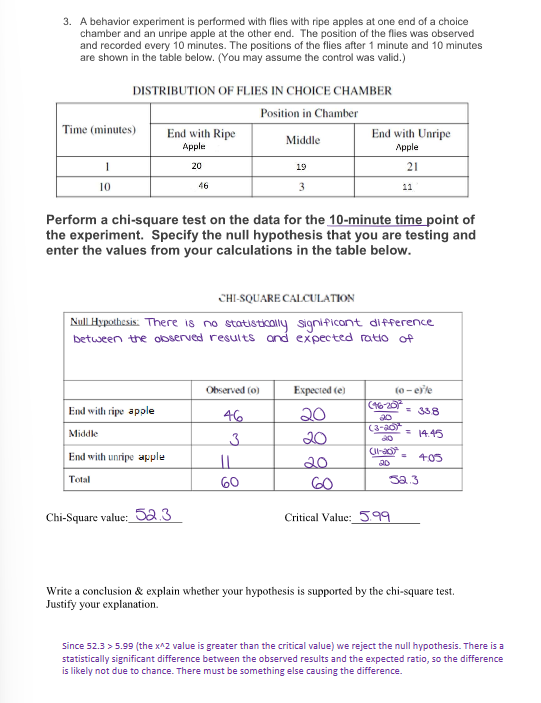
The chi-square test is always testing what scientists call the null hypothesis.
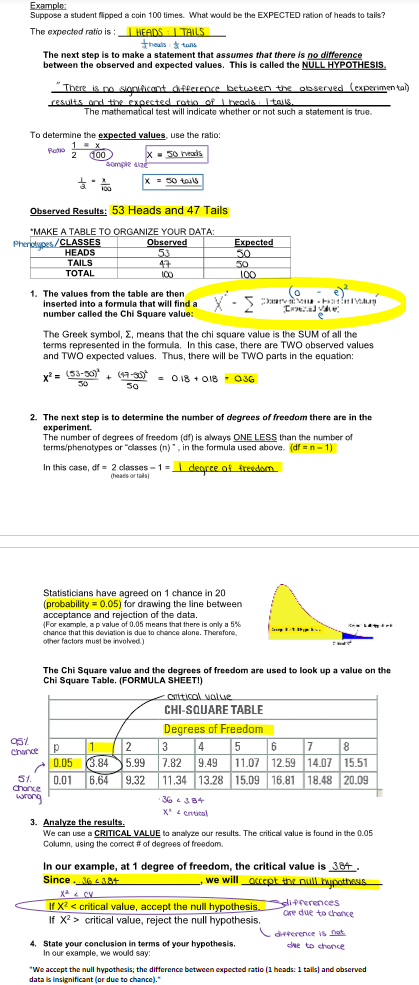
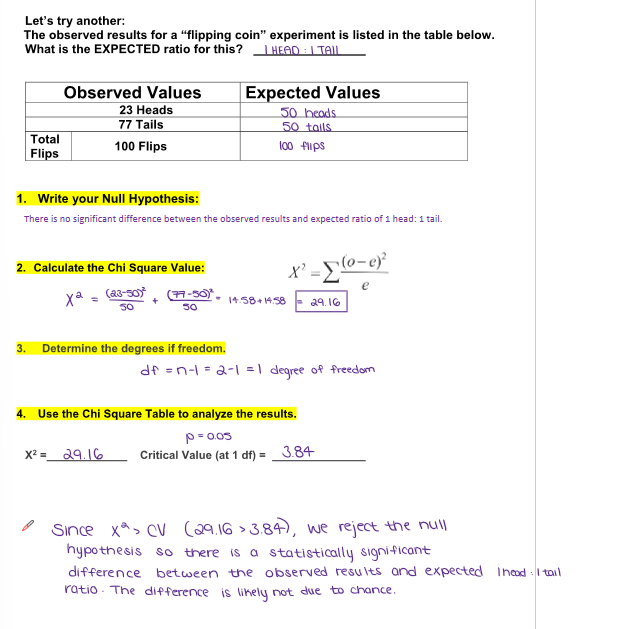
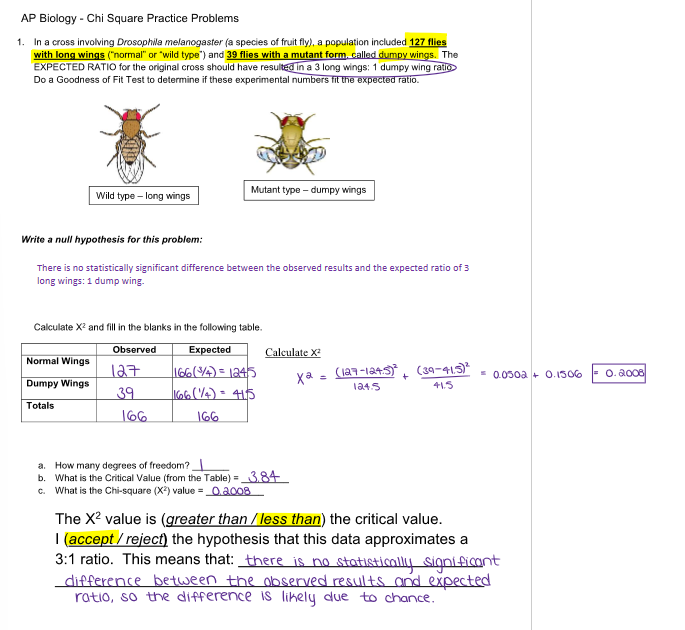
A null hypothesis ALWAYS states: There is no significant difference between the expected (include the expected ratio) and the observed (experimental) result.
(In other words, the differences between the two results are due to chance and NOT due to the testing variable.)
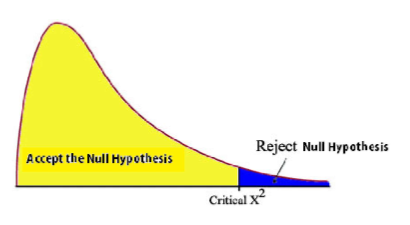
(CHi SQUARE TESTS) When should the null hypothesis be ACCEPTED and REJECTED?
We accept the null hypothesis (or “fail to reject”) if there is no significant difference between the expected and observed ratios. The differences between the expected and actual data is due to chance and the data was consistent with the expected ratio.
If x2 < critical value
We reject the null hypothesis if the difference between the expected and observed ratio is due to something other than chance.
If x2 > critical value
(CHi SQUARE TESTS) What are the OBJECTIVES?
Write a null hypothesis that pertains to an investigation.
Determine the degrees of freedom (df) for an investigation
Calculate the x2 value for a given set of data.
Use the critical values table to determine if the calculated value is equal to or less than the critical value.
Determine if the Chi Square value exceeds the critical value and if the null hypothesis is accepted or rejected.
(CHi SQUARE TESTS) What are DEGREES OF FREEDOM?
df = n - 1
n = # of possible outcomes
(CHi SQUARE TESTS) Where is the line drawn between ACCEPTANCE and REJECTION of the data?
Statisticians have agreed on 1 chance in 20 (probability = 0.05) for drawing the line between acceptance and rejection of the data.
For example, a p value of 0.05 means that there is only a 5% chance for this deviation is due to chance alone. Therefore, other factors must be involved.
(CHi SQUARE TESTS) Example #1
(CHi SQUARE TESTS) Example #2
(CHi SQUARE TESTS) Example #3
(CHi SQUARE TESTS) Example #4
(CHi SQUARE TESTS) Example #5