Statistical tests
1/30
There's no tags or description
Looks like no tags are added yet.
Name | Mastery | Learn | Test | Matching | Spaced | Call with Kai |
|---|
No analytics yet
Send a link to your students to track their progress
31 Terms
the direction of the difference in the variables is stated e.g. greater or less recalled in each condition
directional or one-tailed hypothesis
there is a difference between the variables but it is not stated
non-directional or two-tailed hypothesis
the researcher can conclude that a difference did occur and the variables did affect each other and therefore the alternative hypothesis can be accepted
alternative or experimental hypothesis
there is no difference and the variables did not affect each other and therefore the null hypothesis can be accepted
null hypothesis
it leads to type 1 and type 2 errors
what happens when 5% levels are not used in psychology?
A false positive
The results are accepted as significant, and the hypothesis is accepted when results could be due to chance
The null hypothesis is rejected when it should have been accepted
Caused by using a level of significance that is too lenient - such as p < 0.10
what is a type 1 error?
A false negative
The results are accepted as significant, and the hypothesis is rejected when it should not be.
The null hypothesis is accepted despite the possibility of the alternate hypothesis being correct.
Caused by using too strict significance levels e.g. p < 0.01
what is a type 2 error?
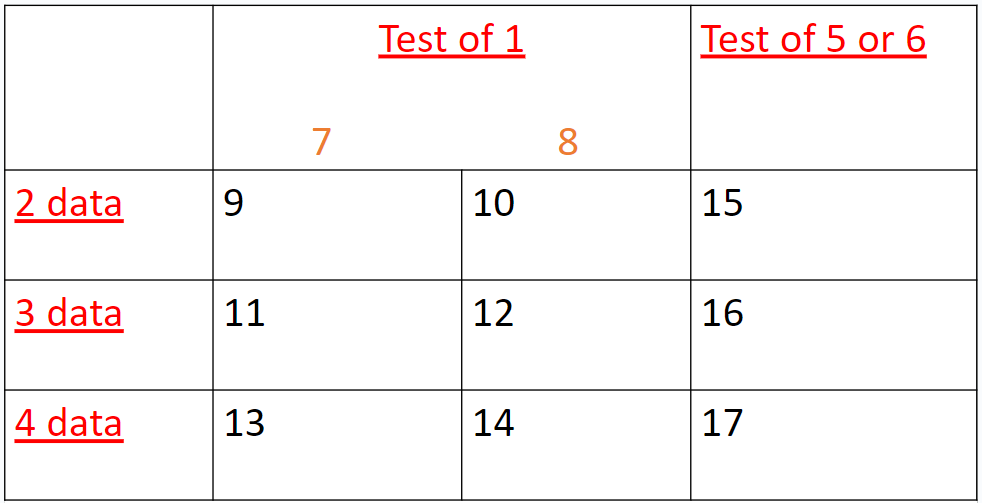
difference, nominal, ordinal, interval, association, correlation, unrelated, related, Chi-Squared, Sign Test, Mann-Whitney Wilcoxon, Unrelated t-test, Related t-test, Chi-Squared, Spearman’s rho, Pearson’s r
name the 8 statistical tests used in psychology (go in numerical order)
Carrots should come mashed with swede under roast potatoes
No idea
U r associated with correlation
what mnemonic can be used to remember the table?
Difference - this is the difference or relationship/ association which is relevant to the aim of the study/method used.
Design - independent groups (unrelated), repeated measures (related) or matched pairs (related).
Data - this is the level of measurement (ordinal, nominal, interval) which is how the data is presented.
what factors are used to determine which statistical tests are used?
categories
what is nominal data?
specific measurement e.g. cm, time, or numbers
what is interval data?
rank order (1st, 2nd, 3rd)
what is ordinal data?
A test of difference
Repeated measures/ matched pairs (related test)
Nominal data
When is a sign test used?
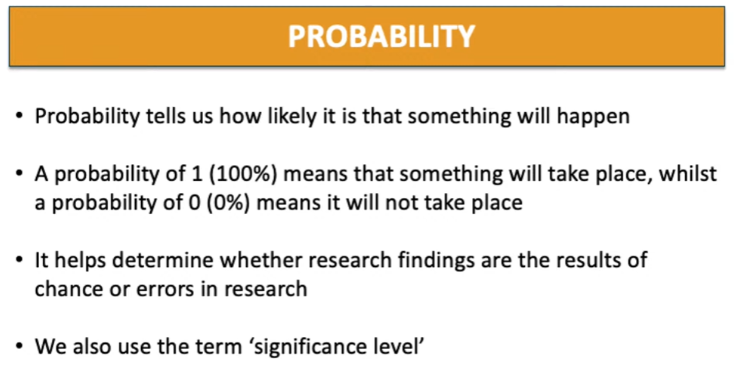
what does probability mean?
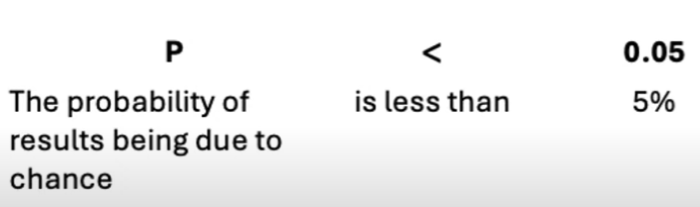
what does P<0.05 mean?
It strikes a balance between a type 1 and type 2 error
It leaves reasonable room for error (e.g. participant behaviours)
why is the 0.05 level preferred in Psychology?
Making significance levels stricter reduces the chance of a type 1 error but will increase the chance of making a type 2 error.
what should you remember about significance levels?
We can reject the null hypothesis and accept the experimental hypothesis.
What can be done when a result is concluded as significant?
As the calculated value of (x) is less than the critical value of (x), the results are not significant at the 0.05 level. The null hypothesis is accepted
how would you write out an answer explaining why a result is not significant?
As the calculated value of (x) is more than the critical value of (x), the results are significant at the 0.05 level. The experimental hypothesis is accepted
how would you write out an answer explaining why a result is significant?
Parametric tests make calculations using the mean and standard deviation of the data
Non-parametric tests use ranked data, thus losing some of the detail.
The end result is that parametric tests can detect significance in some situations where non-parametric tests cannot.
Parametric tests can only be used if the following assumptions are met:
The level of measurement is interval
The data is from a population that has a normal distribution
The variances of the two samples are not significantly different (only matters when the design is independent groups)
Parametric and non-parametric tests
When is a parametric test?
What is a non-parametric test?
What is the end result?
When are parametric tests used?
the (s) calculated value
the value where you add up the less frequent sign (+ or -)
the critical value
the value used from looking at the table
If the calculated value is equal to or less than the critical value, then it is significant and you can accept the alternative hypothesis and reject the null
what is the general rule of knowing whether the results are significant?
the calculated value has to be equal to or greater than the critical value to accept the alternative hypothesis and reject the null
what is the rule of R used for knowing when the results are significant or not?
x²
U
rs
T
r
s
Representing data tests
What are the calculated values of each of the followng?
Chi = ?
Mann-Whitney = ?
Wilcoxon = ?
Pearson = ?
Related or unrelated T-test = ?
Sign = ?
if the statistical test has the letter R in it, the calculated value has to be equal to or greater than the critical value to accept your alternative hypothesis and reject the null.
what is the rule of R?
Df = Number participants -1
what is the formula for df for a related t-test?
Df= (participants in condition 1 + participants condition 2) -2
what is the formula for df for an unrelated t-test?
Df = (no of columns with data in -1) x (no of rows with data in -1)
what is the formula for df for an chi squared test?