ECO10: Inflation and UE
1/26
Earn XP
Description and Tags
Only strucutral UE was given an individual card as the other types of UE have their explanations covered in the name the 4 types of employment flashcard.
Name | Mastery | Learn | Test | Matching | Spaced |
|---|
No study sessions yet.
27 Terms
Define UE
A situation where a person who is willing and able to work (and is actively seeking a job) at prevailing wages but is not able to find one.
How is UE measured/calculated?
Usually countries use the UE rate metric, the rate of Pop who is UEd. (Common sense shi).
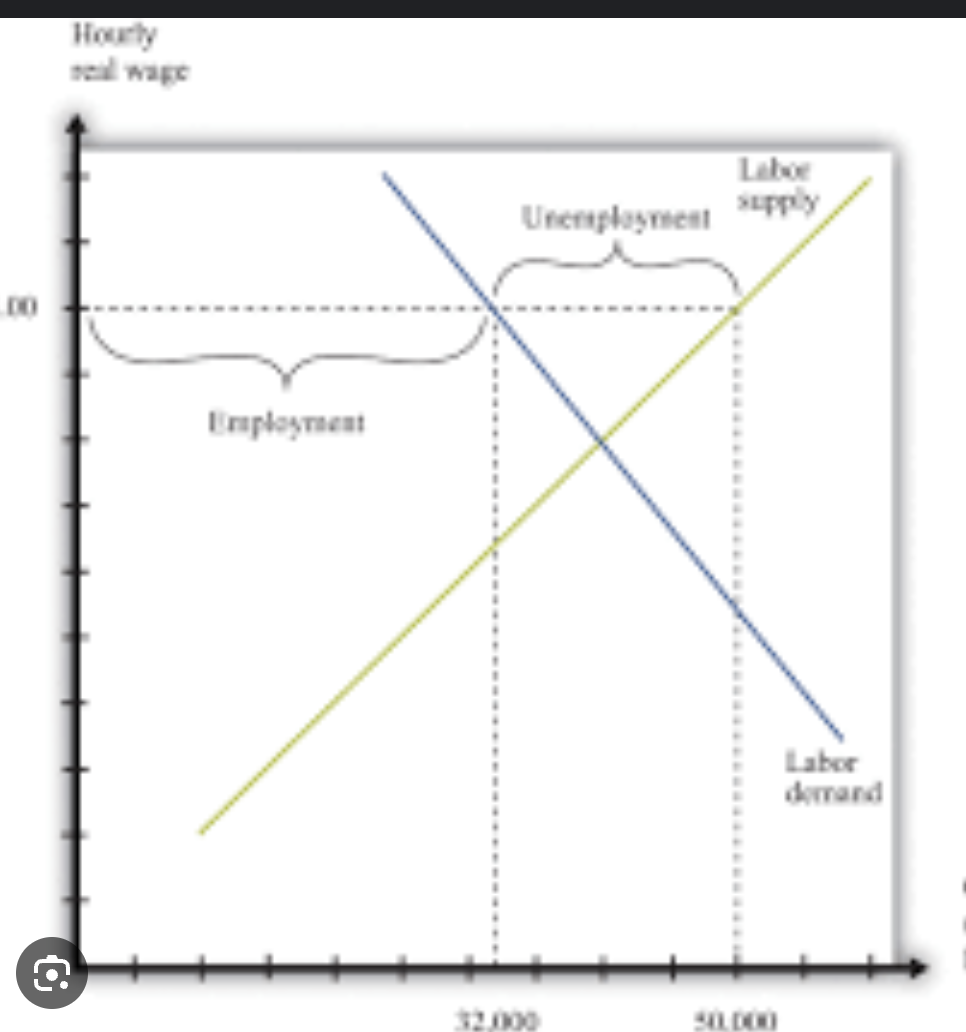
How is UE and the NRUE shown in diagrams?
Most of the time, UE is the gap between the potential/full output in an AD/AS diag. Yf - Y1 (Macro diagrams only)
NRUE is shown as the YFE, the full employment output in macro diagrams only.
Sometimes it can also be illustrated as shortages or surpluses in min wage diagrams, etc. (Micro)
Define the Natural Rate of Unemployment
the sum of frictional, structural, seasonal UE. (does not count dd-deficient/cyclical) structural, frcitional,
Difficulties in Measuring UE, Problems with using UE rate. (around 7 difficulties)
Does not consider “discouraged workers” who give up looking for a job after a while due to no hope. (These people drop out of the labour force)
Does not distinguish full-time vs part-time employment. (Part timers are still considered underemployed)
Does not distinguish the type of work done. Eg. will not know if a PhD is working as a waiter or not (underemployment not registered)
Does not include people on retraining programs who previously lost their job.
Does not include people who are forced to retire early even though they still want to work.
Does not consider the underground economy of work, taxes not registered.
Overgeneralises as it is an average rate across a country, fails to show the differences in UE within certain populations/societies within a country. (ie. by region, age, gender, race, education level, etc.)
Costs of High UE. [2 broad cost groups, economic and social/personal]
Economic Costs
Lower GDP, economy lesser than max capacity, inside PPC
Loss in income for the unemployed workers → financially worse off.
Loss of tax revenue for gov since lesser income tax.
Costs to gov for UE benefits.
Struggle to find work in the future due to long term of UE, loss of skill.
These result in greater budget deficits, or smaller budget surpluses → poorer financial position for the government.
Increased income disparity/worser distribution of income.
Personal Costs
Embarrassment, financial stress, emotional stress, depression, etc.
Increased crime, violence, drug use, etc.
Define all the Types of Unemployment (4 main types, 1 damn easy)
Structural UE: UE that arises from 1) changes in demand for labour over time, 2) changes in firm geographical location/shutdown of companies, 3) Labour market rigidities.
Seasonal UE: UE due to seasonal changes in worker/FOP demand/supply.
Cyclical/Demand-Deficient UE: Due to insufficient aggregate demand in the economy due to cyclical changes in the business cycle.
Frictional UE: The phenomena of workers being UE while between jobs, either because they are seeking new work or have just been fired; is short term and caused my imperfect information regarding suitable candidates for employers and suitable job vacancies for employers.
Explain how Structural UE arises. [3 main causes]
1) Change in demand for workers over time due to technological change, workers with irrelevant skills will be fired, etc. (Diagram can show demand for workers in labour market for a specific job decrease (Micro diagram).
2) Change in geographical location. If company relocates, since they cant possibly move their whole workforce to the new country, the old country loses employment, new country gains employment. Eg. Dyson move to SG. (Same diag to illustrate as 1)
3) Labour market rigidities
Min wage laws —> creates surplus of workers (draw price floor diag), suplus = unemployment.
Employment protection laws —> Make firms more cautious about hiring due to higher risk —> less hiring.
Worker union demand higher wages —> same as point 2.
Generous gov UE benefits —> incentivise people to stay UE.
Define Inflation
a sustained increase in the general price level.
Generally to be considered “sustained” means usually over a year.
Define Deflation
A sustained decrease in the general price level.
Define disinflation.
a decrease in the rate of the inflation.
Explain how inflation is measured.
It is often measured using the percentage change in the CPI and is measured in terms of inflation RATE.
Eg. if the CPI increases by 5% from 2017-2019, then the inflation rate from 2017-2019 is 5%.
Diagramatically, any increase in the GPL is signal of inflation.
Explain how a weighted CPI is constructed, and how it is used to calculate inflation.
Define the base year.
Define the basket of goods and its weights (quantity of each good). The basket contains all the common goods that an average household is assumed to consume.
Find the value of all the goods by multiplying price by the quantity.
Percentage change in CPI is the inflation rate.
CPI is used as a proxy for the general price level.
Explain the problems with the CPI.
Cross country comparions are meaningless
Yearly comparisons are meaningless
Does not account for change in basket of goods amongst consumers due to change in price/discounts/ or introduction of new products, resulting in substitution to cheaper alternatives or reduction in conusmption, etc.
Overgeneralisation of the inflation rate across different regions, income groups, races, ages in a society.
Name and explain the two causes/types of inflation.
1) demand-pull inflation.
Occurs when there is excess AD over AS the market equilibrium for the economy, resulting in prie increase. (or the AD increases faster the the economy’s productive capacity, the SRAS.)
Oftentimes represented as rightward shift of AD.
Caused by anything that increases AD.
Generally considered to be safe, stable, and beneificial. (eg. leads to economic growth (see consequences of inflation)).
2) Cost-Push Inflation.
Occurs when there is a deficiency in the SRAS over the AD at the market equilibrium, resulting in price increase.
Oftentimes represented as a leftward shift of SRAS (Monetairist)
Caused by anything that decreases SRAS (Same as determinants of supply, WETPIGS)
(Note, only montetairst diagrams can show cost-push as it is a monetarist concept, keynesians don’t believe in decreases in AS in the short-run due to downward wage rigidity).
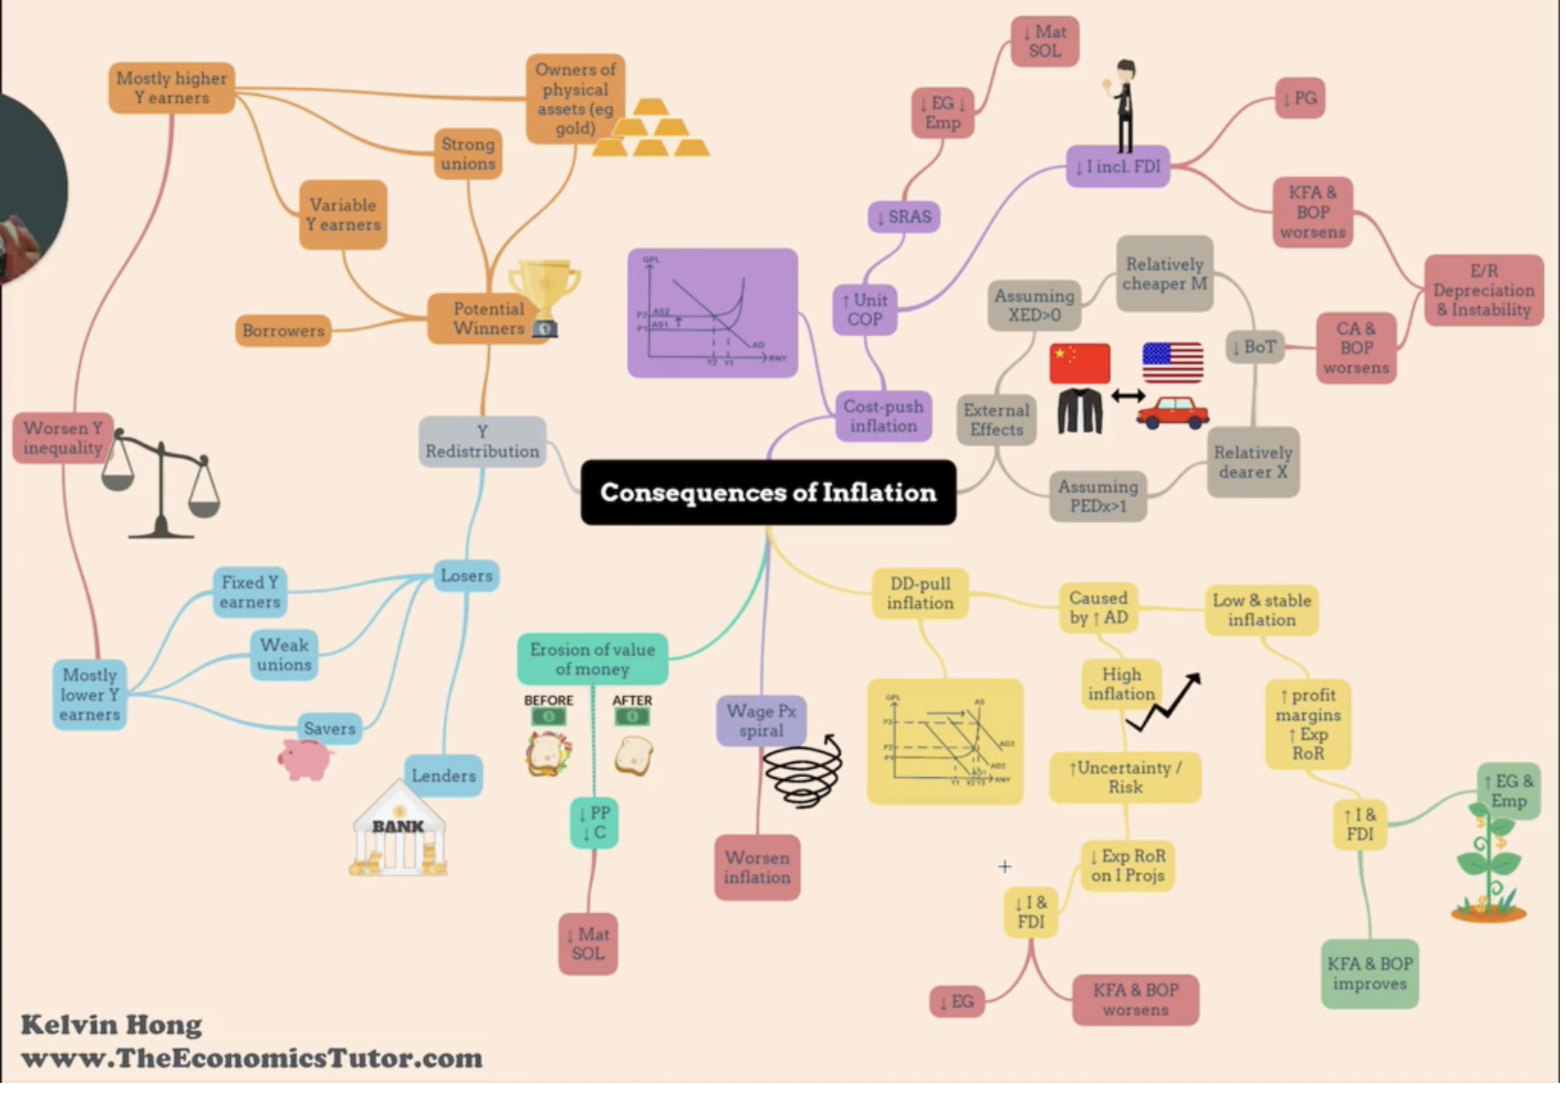
Explain all the impacts/costs/benefits/harms of inflation.
Hint: mindmap

What is the ideal rate of inflation?
One that is low and stable, not not zero, as zero is too close to deflation which has other negative effects.
Allows for promotion of economic growth (See consequences of inflation TET infographic above)
Usually between 2-3% for most countries.
Causes of Deflation
Any factor that causes decrease in AD
Any factor that causes increases in AS.
Why deflation doesnt occur in the real world most of the time.
Wages are sticky downwards and do not fall easily. (ie. cost of labour/production does not easily decrease, thus AS does not easily increase resulting in deflation)
Firms (most firms in major industries are generally oligopolistic) are cautious with cutting price in fear of downward price wars.
Name the impacts of deflation
opposite of inflation, see mindmap
Which is more severe, UE Or inflation?
UE is more severe, a study showed that increase in UE resulted in 6 percentage points decrease in happiness while a similar increase in inflation only resulted in 1.
Loss of income has a very very big impact on households.
What is the Conflict between low UE and low Inflation (not the tradeoff)
Simple stuff, it basically states that if UE decreases (a good thing), inflation increases (a bad thing).
This can be illustrated diagramatically above, where increased AD (signifying decreasing UE) results in higher price level (inflation)
This can be explained because higher AD means resources are being used more fully, there will be more supply-side bottlenecks, workers will demand higher wages, higher costs of maintenance and operating for some firms’ machines, this makes firms price their products higher, resulting in inflation.
Explain the Inflation and Unemployment Tradeoff in the short-term

The SR Philips curve is a means of illustrating the tradeoff, shown by the negative relationship between rate of inflation and UE.
The theory of the PC also states that countries can only operate on points on or close to the curve.
Thus the ideal spot, point e, is unattainable in the real world by theory.
See that the choice of where a country lies on the phillips curve is equivalent to where their AD is at (see the figures above).
What is stagflation and how is it shown on the SR philips curve.
STAGFLATION: Refers to the state of a country of having both high inflation and high UE.
It occurs mainly when SRAS shifts to the right as it causes lower Y and higher P.
Correspondingly, the Phillips curve shifts outwards to denote stagflation.

What is the Long Run PC and why does it exist/what is the theory behind it.

The short-run PC is not known to be an accurate model and has been questioned time and again.
The LRPC was come up with and is the vertical line seen in the left diag ontop.
It is vertical for the same reason the LRAS is vertical— you can just keep increasing output (decreasing UE) of the economy, it will overheat and go back to the same Y but at higher price.
The LRPC has the implications that policymakers barely have a choice between Inflation and UE as demand side policies will not work at the NRUE.
LRPC is used mostly by monetarists.
What are the key differences in the implications of the SR and LR philips curve.
Short run shows the negative relationship between UE and inflation, and implies that policymakers have a CHOICE to decide where to tradeoff UE and inflation
Long-run says UE is independent of inflation (at least at less than the NRUE), and thus policy makers DO NOT HAVE A CHOICE.